Download the "Real Time is the Future - Apache Flink Best Practices in 2020" whitepaper to learn about Flink's development and evolution in the past year, as well as Alibaba's contributions to the Flink community.
By Dong Tingting, Director of the Real-time Computing Engine Team at Kuaishou

As a sharing and live streaming platform for short videos, Kuaishou has applied Apache Flink in a wide range of its service scenarios. These scenarios include quality monitoring of short videos and live streams, user growth analysis, real-time data processing, and scheduling of live streaming traffic for content delivery networks (CDNs). This article introduces the application and practices of Apache Flink in Kuaishou by considering scenarios and the Flink cluster scale, the technical evolution of Apache Flink during its application in Kuaishou, and Kuaishou's future plans regarding Apache Flink.
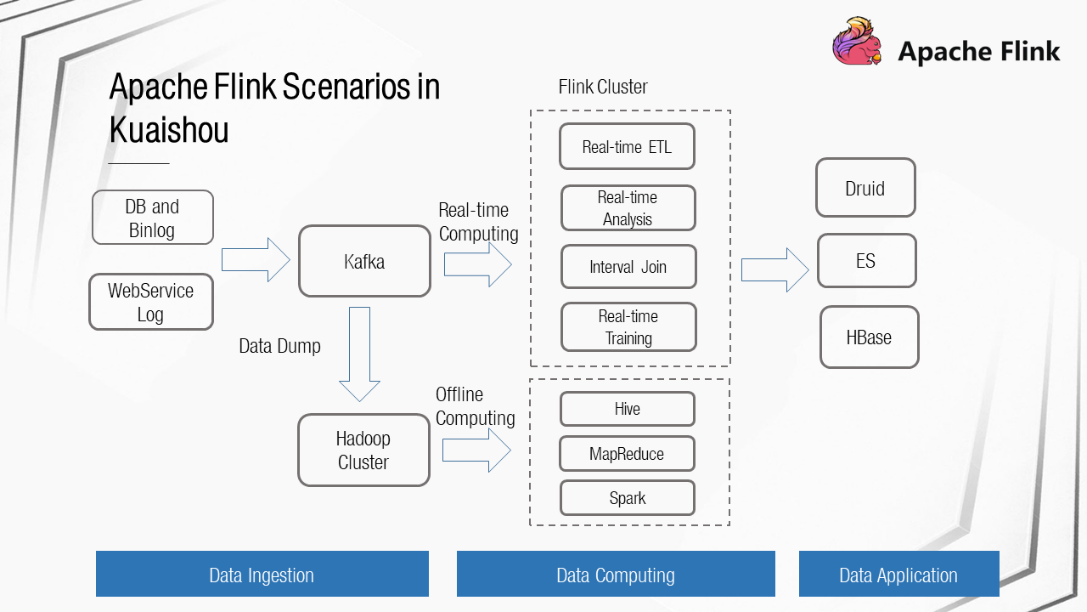
In Kuaishou, data to be computed is imported from DB, Binlog, and WebService Log to Kafka in real time and then is connected to Flink for real-time computing. The real-time computing process includes real-time extract, transform, and load (ETL), real-time analysis, interval joins, and real-time training. The real-time computing results are stored in Druid, ES, or HBase and then are connected to data applications. At the same time, the Kafka data is dumped to a Hadoop cluster in real time and then is connected to Flink clusters for offline computing.
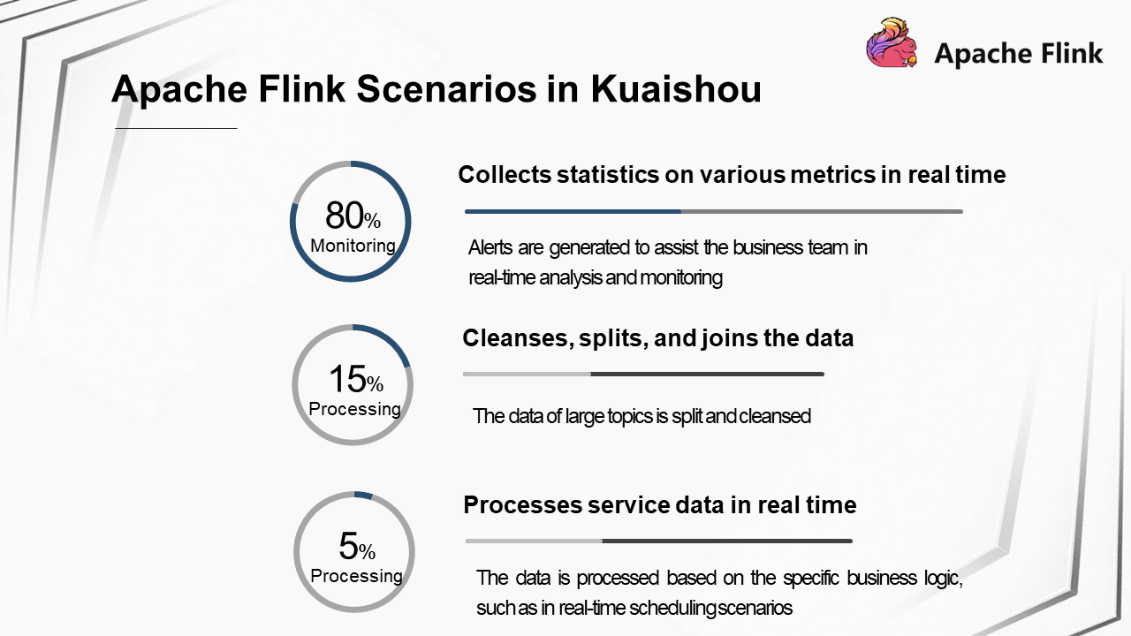
Flink is applied to the following areas in Kuaishou:
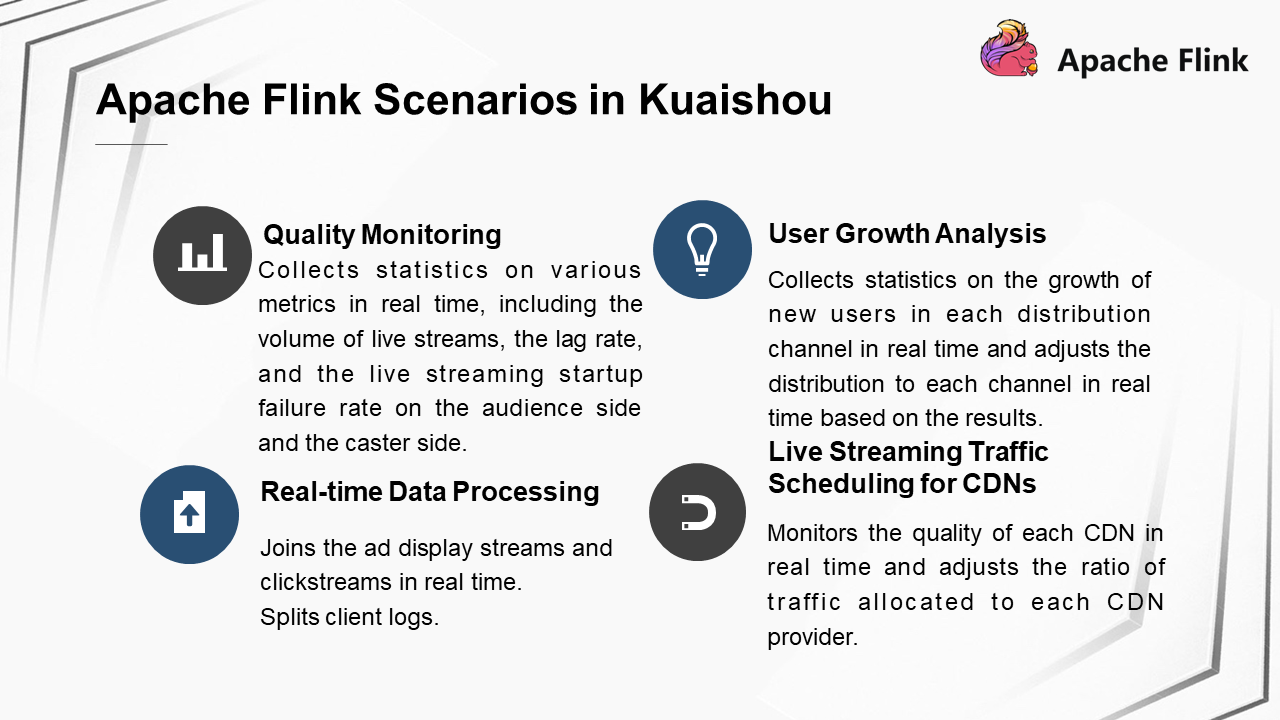
Flink is used in the following major scenarios in Kuaishou:
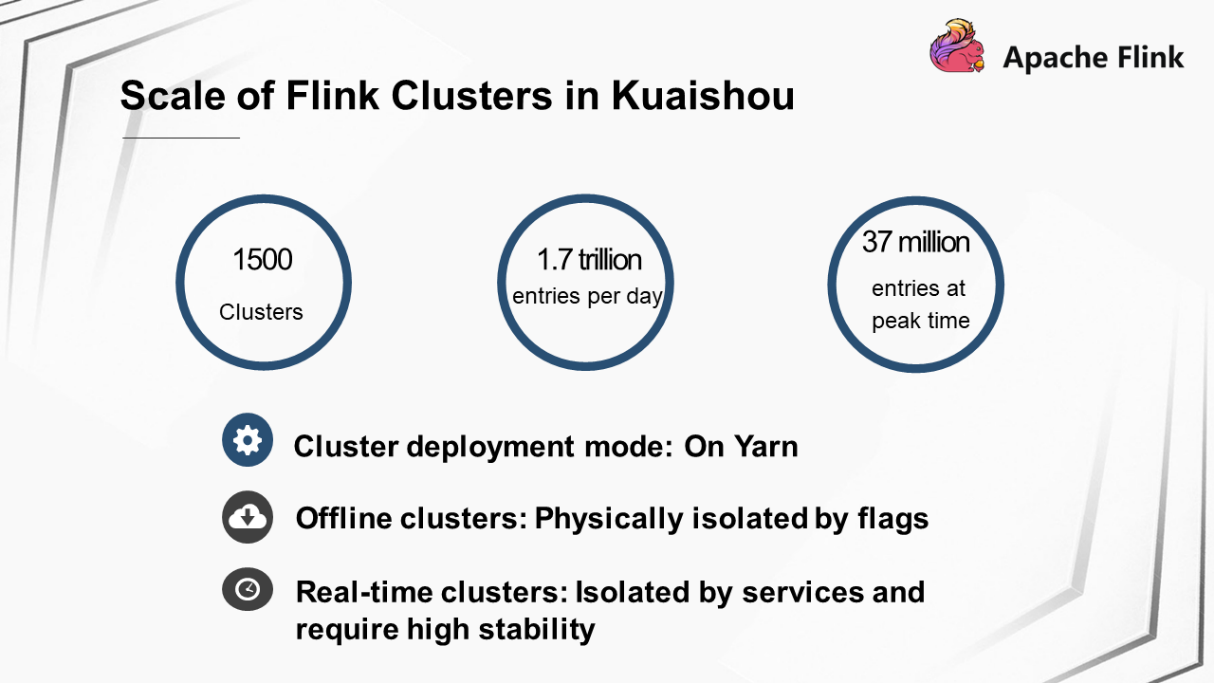
Currently, Kuaishou has deployed approximately 1500 Flink clusters and 500 jobs. The clusters can process a total of 1.7 trillion entries per day and approximately 37 million entries at peak times. The clusters are deployed in On Yarn mode and can be classified into offline clusters and real-time clusters. Offline clusters are deployed in hybrid mode, where nodes are physically isolated by flags. Real-time clusters are dedicated Flink clusters and are used to deploy services with high isolation and stability requirements.
We evolved the Flink technology applied in Kuaishou in the following ways:
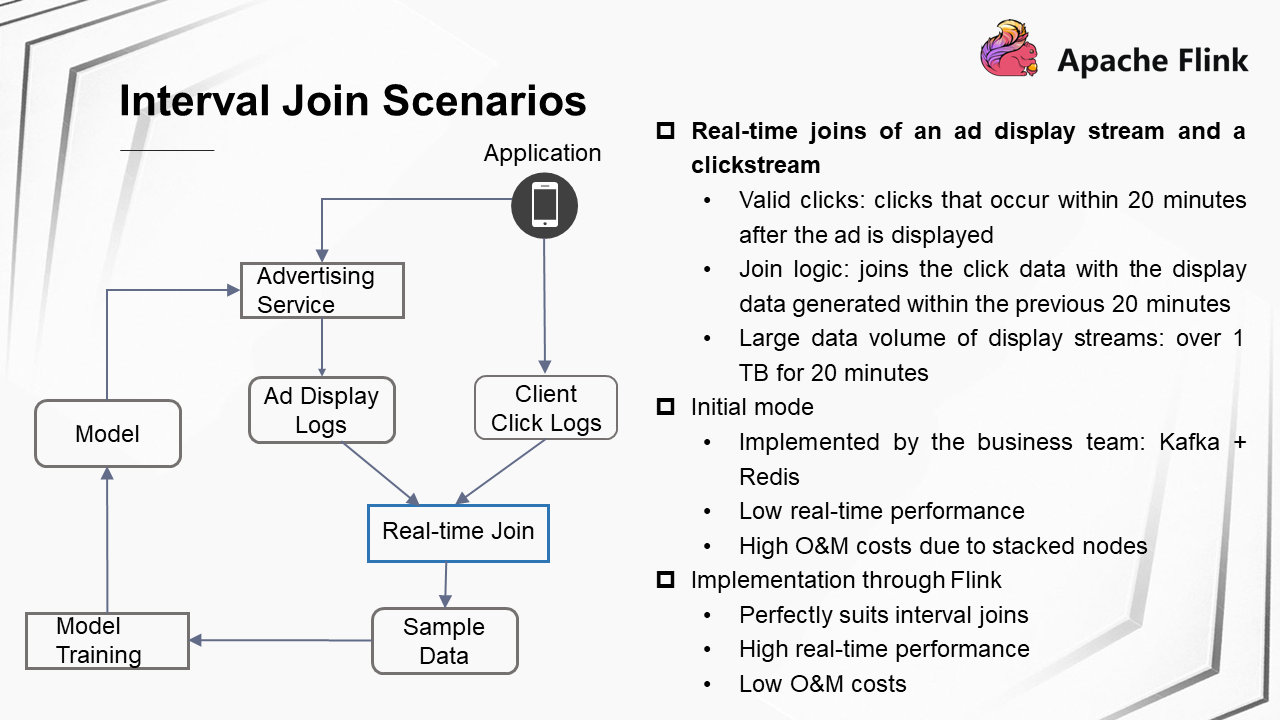
In Kuaishou, an interval join is a scenario where an ad display stream is joined with a clickstream in real time. Specifically, when you open Kuaishou, you may receive ad videos recommended by the ad service and sometimes you may click the ad videos. In this case, two data streams are generated at the backend: One is the ad display log and the other is the client click log. These two pieces of data are joined in real time, and the join result is used as sample data for model training. The trained model is subsequently pushed to the online advertising service.
In this scenario, clicks that occur within 20 minutes after the ad is displayed are considered as valid clicks. The logic of a real-time join is to join the click data with the display data generated within the previous 20 minutes. The data volumes of display streams are relatively large. The display streams generated within 20 minutes occupy more than 1 TB of memory. Initially, the real-time join process was implemented on the service side. Ad display logs were cached in Redis, and Kafka consumed client click logs after a delay to implement the join logic. This method had many disadvantages. The real-time performance was low. As business grows, more nodes are stacked, resulting in high O&M costs. Interval join based on Flink is perfectly suited to this scenario. It ensures high real-time performance by outputting join results in real time. The maintenance costs are very low because only one Flink job needs to be maintained on the service side.
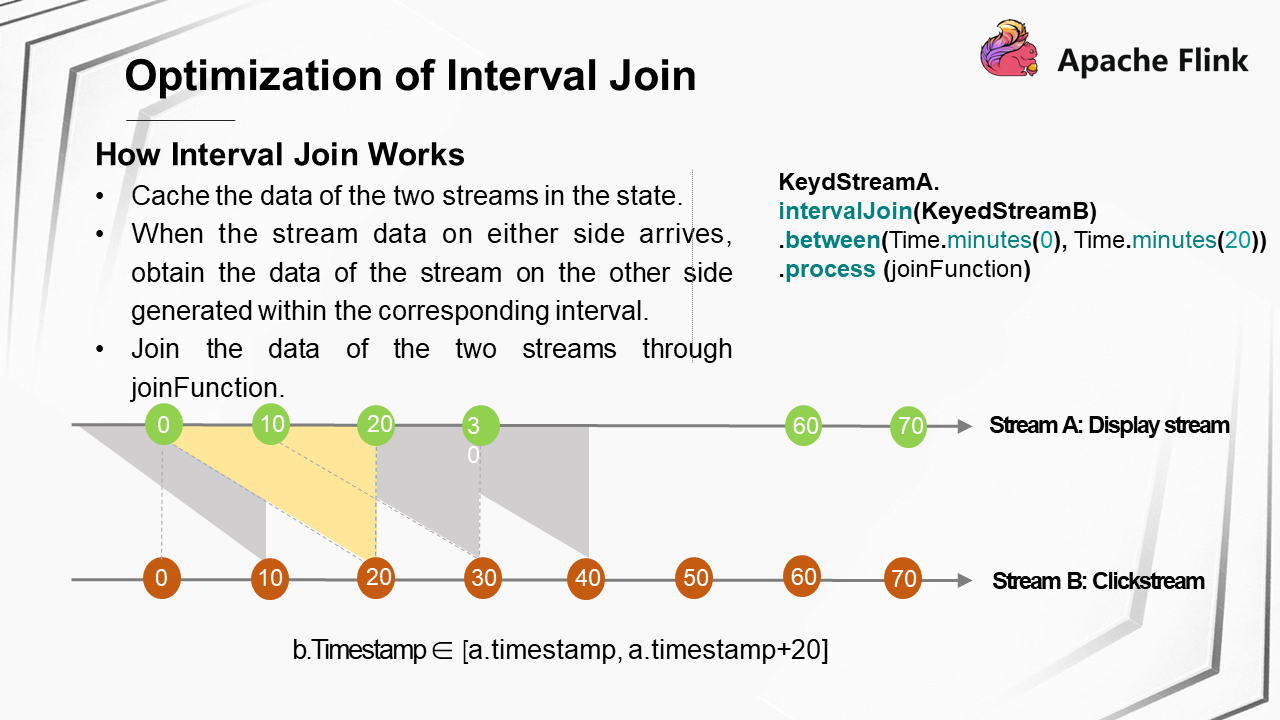
Flink implements interval join as follows: The data of two streams is cached in an internal state. When stream data from either side arrives, the data of the stream on the other side generated within the corresponding interval is obtained, and then the data of the two streams is joined through joinFunction. As time elapses, the data of the two streams generated within the corresponding interval in the state is cleared.
In the previous ad scenario, the data of two streams generated within 20 minutes is joined. Assume that the data of the two streams arrive in an orderly manner. As a display stream, every stream A generated within 20 minutes is cached. As a clickstream, every stream B is joined with stream A generated within the previous 20 minutes.
The following code shows the implementation of interval join in Flink.
KeyedStreamA.intervalJoin(KeyedStreamB)
.between(Time.minutes(0),Time.minutes(20))
.process(joinFunction)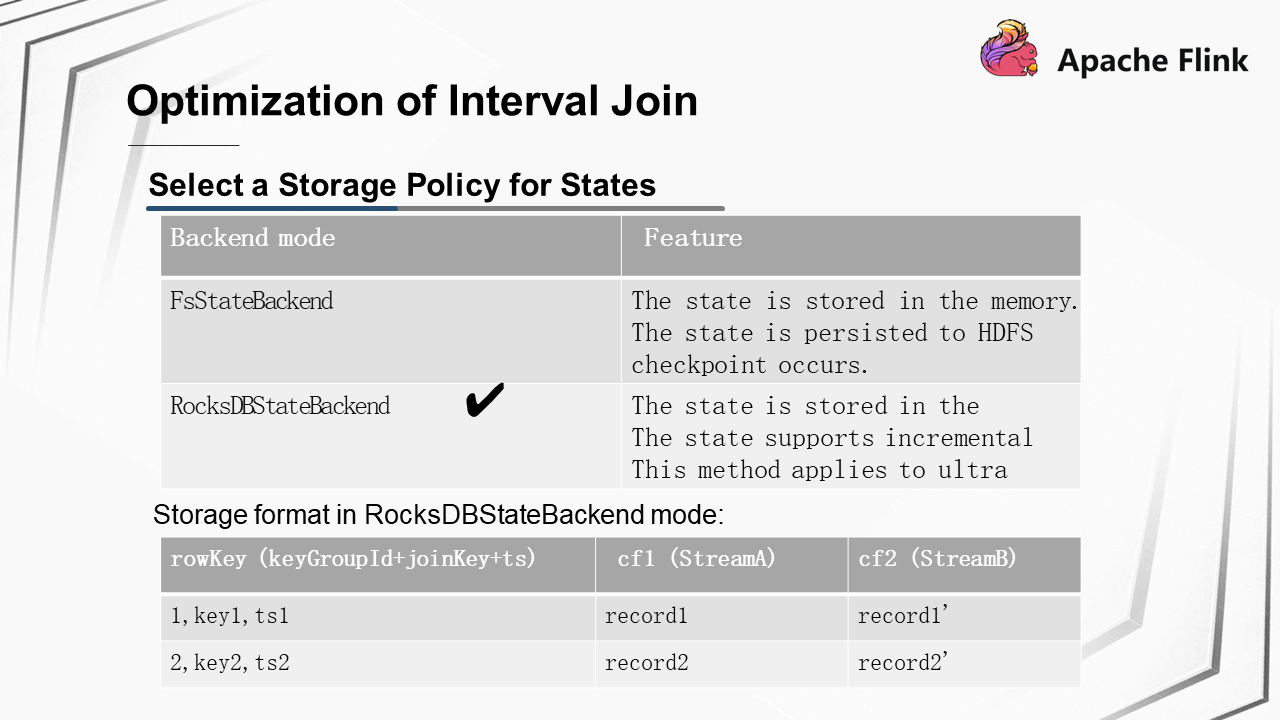
In production environments, the state backend stores states in either of the following ways:
In the ad display scenario, more than 1 TB of display stream data is generated within 20 minutes. In order to reduce memory usage, Kuaishou ultimately chose RocksDBStateBackend.
In the interval join scenario, the RocksDBStateBackend stores the data of two streams in two Column Families, where the rowKeys are organized in the form of keyGroupId,joinKey,ts.
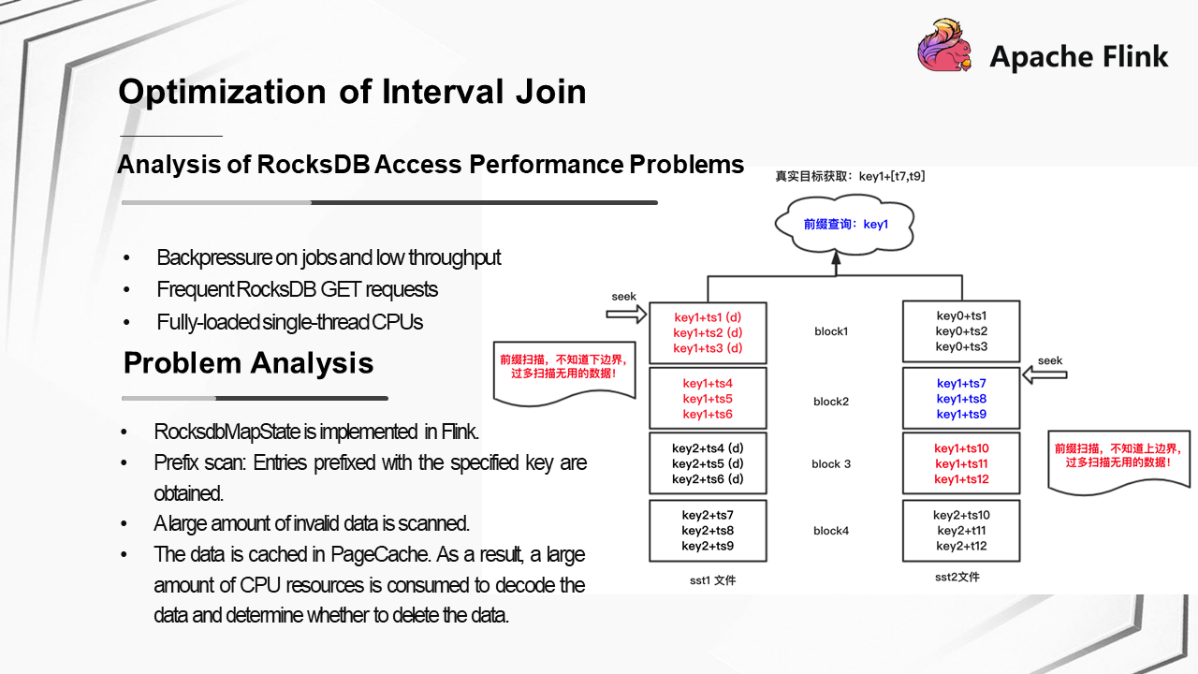
The first problem that occurred when Flink jobs went online was the RocksDB access performance problem. Specifically, the following symptoms were shown:
After further problem analysis, we found that, when the RocksDBStateBackend mode was enabled in Flink, the data with a specified join key generated within a certain interval was obtained as follows: A set of entries prefixed with the specified join key were obtained through prefix scan, and then the data generated within the interval was determined. Prefix scan caused the system to scan a large amount of invalid data, most of which was cached in PageCache. As a result, a large amount of CPU resources was consumed to decode the data and determine whether to delete the data.
Take the preceding figure as an example. The blue part is the target data, and the red part is the data outside the upper and lower bounds. Too much invalid data in the red part was scanned during prefix scan. As a result, the single-thread CPU was used up when processing such a large amount of invalid data.
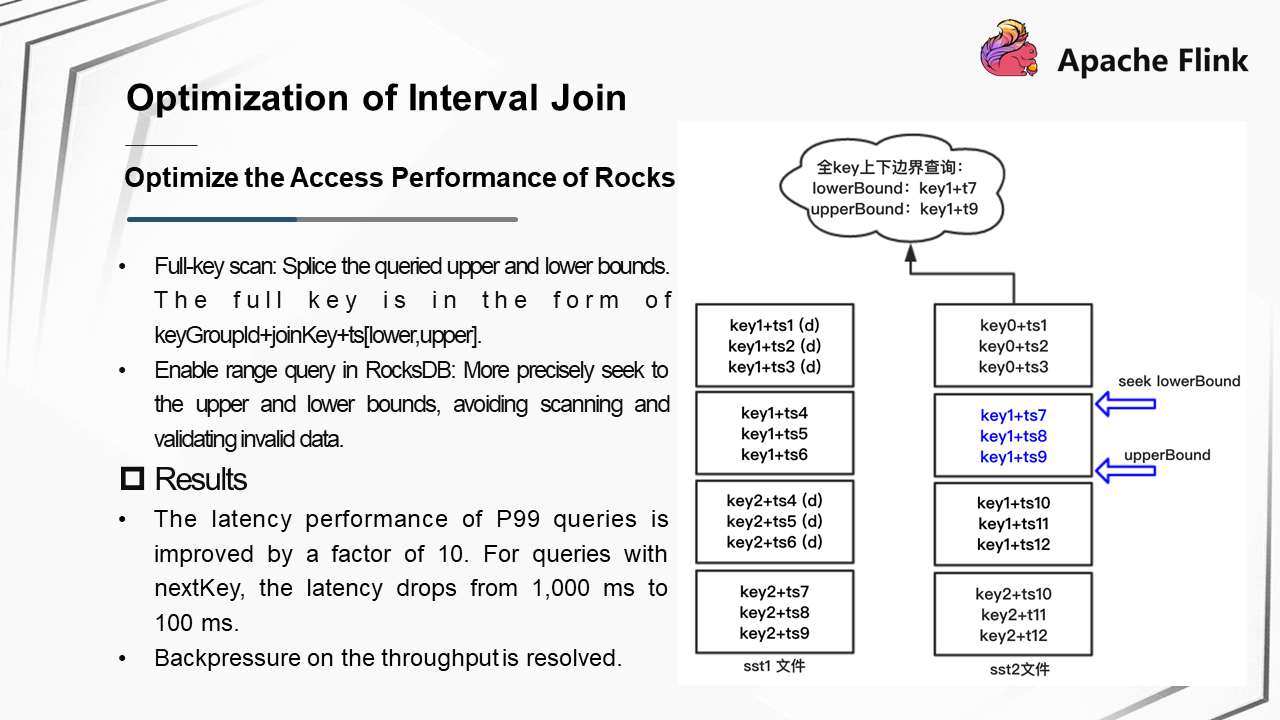
Kuaishou optimized the RocksDB access method in the interval join scenario as follows:
After optimization, the latency of a P99 query was improved by a factor of 10. That is, when a data entry is obtained from RocksDB by using nextKey, the latency of the P99 query dropped from 1,000 ms to 100 ms. Therefore, the backpressure on jobs was resolved.
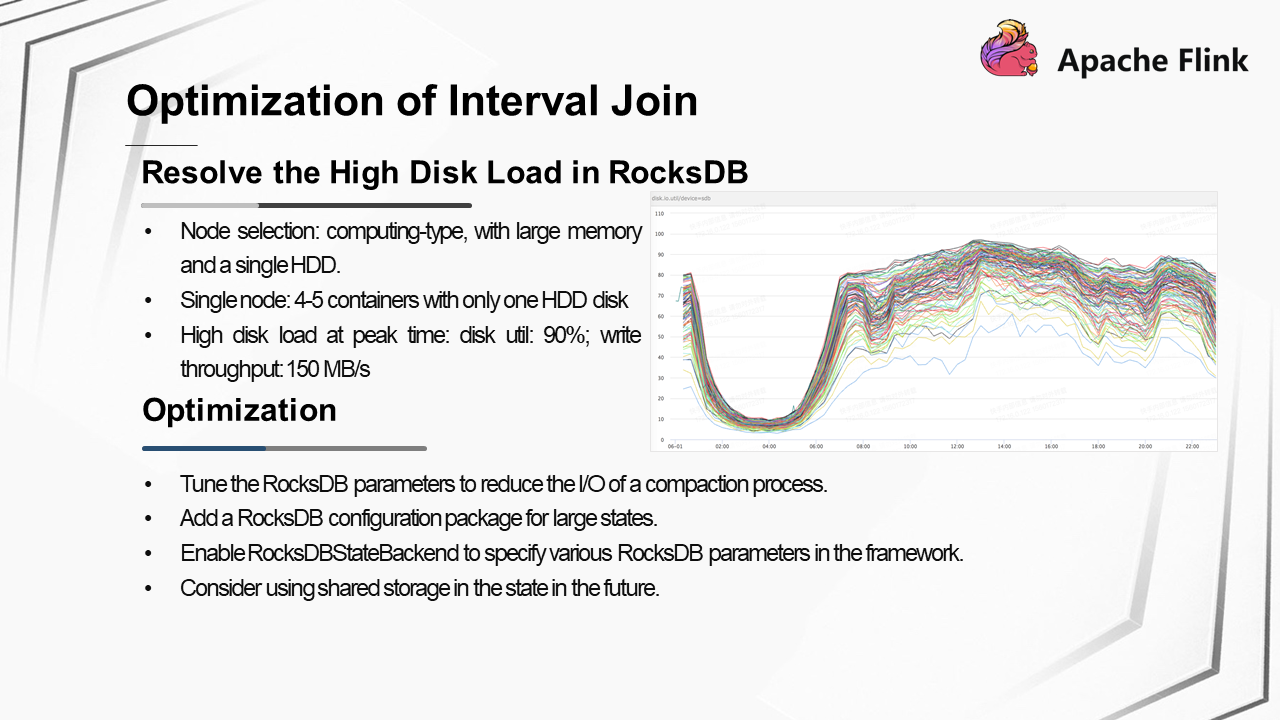
The second problem that occurred when Flink jobs went online was that, as the business grew, the disk of the RocksDB almost reached its maximum capacity. At peak times, the disk util reached 90% and the write throughput reached 150 MB/s. Detailed analysis showed that this problem was caused by the following reasons:
To address the load on the RocksDB disk, Kuaishou made the following optimizations:
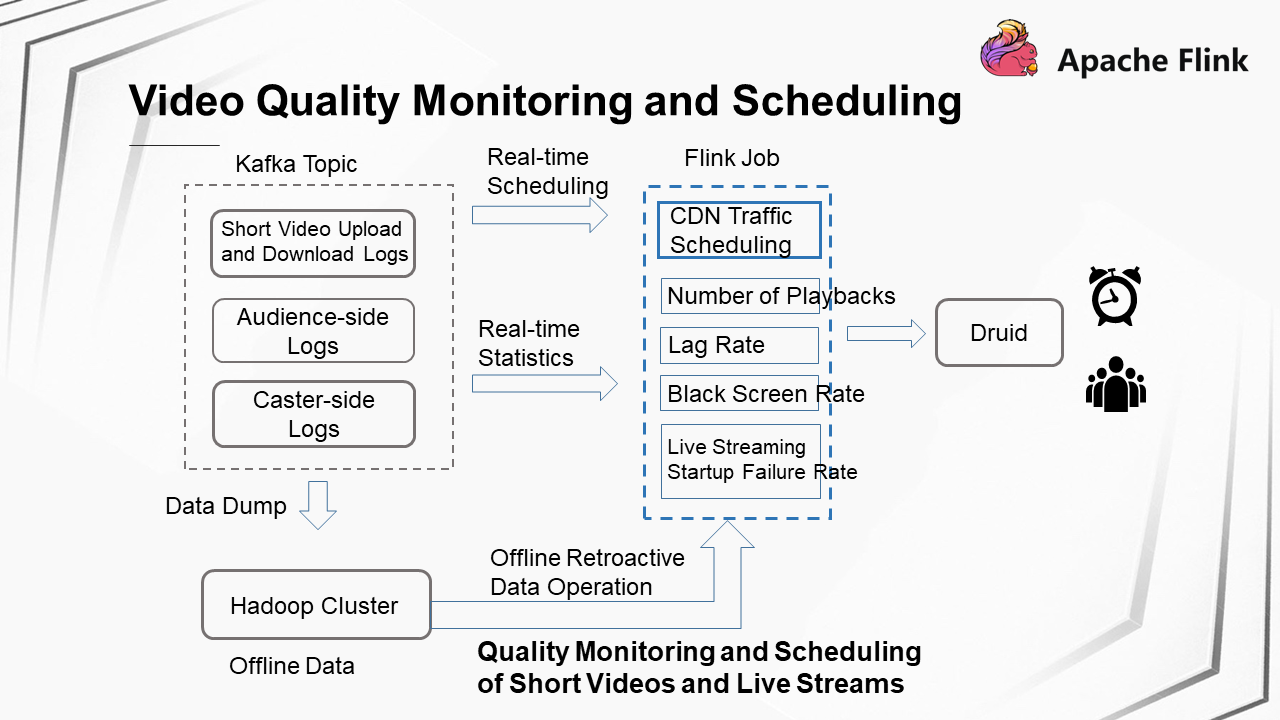
First, let's take a look at the basics of video quality monitoring and scheduling. Multiple Kafka topics are used to store quality logs related to short videos and live streaming. These logs include short video upload and download logs, logs generated on the live streaming audience side, and logs reported from the caster side. A Flink job reads the data of the corresponding topic and collects statistics on various metrics in real time. The metrics include the number of playbacks, the lag rate, the black screen rate, and the live streaming startup failure rate. Metric data is stored in Druid for subsequent alert monitoring and multidimensional metric analysis. At the same time, another stream is used to schedule the live streaming traffic for CDNs. In this process, Flink jobs are used for real-time training, and then the ratio of traffic allocated to each CDN provider is adjusted.
The data of Kafka topics is simultaneously dumped to the Hadoop cluster to perform retroactive data operations offline. The same copy of Flink code is used for real-time computing and offline retroactive data operations. Different Kafka or HDFS data is read for different data sources.
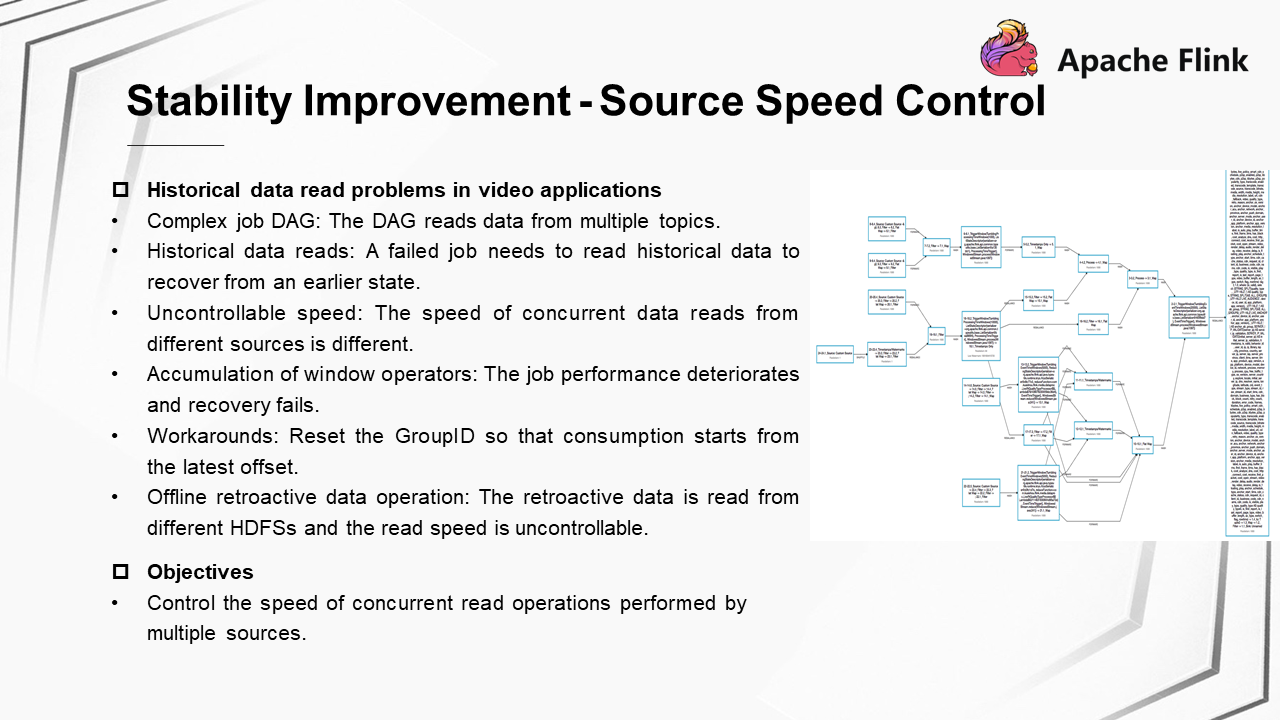
The problems that occurred in video application scenarios were as follows: The directed acyclic graph (DAG) of a job is complex because it simultaneously reads data from multiple topics. If an exception occurs in a Flink job, the job fails. To recover from an earlier state, the job needs to read part of the historical data. At this point, the speed of concurrent data reads from different sources is uncontrollable. This will lead to the accumulation of window operators in the state and deteriorate performance of the job, eventually causing job recovery to fail. In addition, when the data is read from different HDFS files during offline retroactive data operations, the data read speed is also uncontrollable. Previously, the temporary solution to real-time scenarios was to reset the GroupID to discard historical data so that consumption started from the latest offset.
To solve this problem, we determined to control the speed of concurrent read operations performed by multiple sources. Therefore, we designed a source speed control policy.
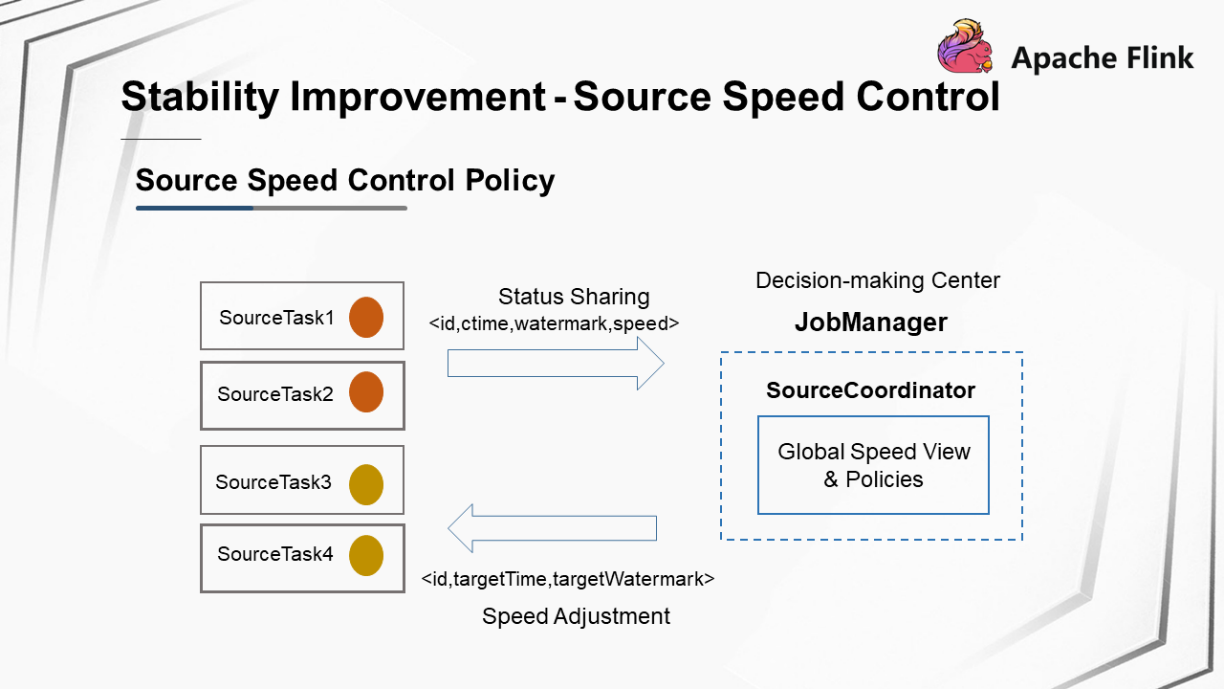
Source Speed Control Policy
The source speed control policy is as follows:
<id,ctime,watermark,speed> to JobManager.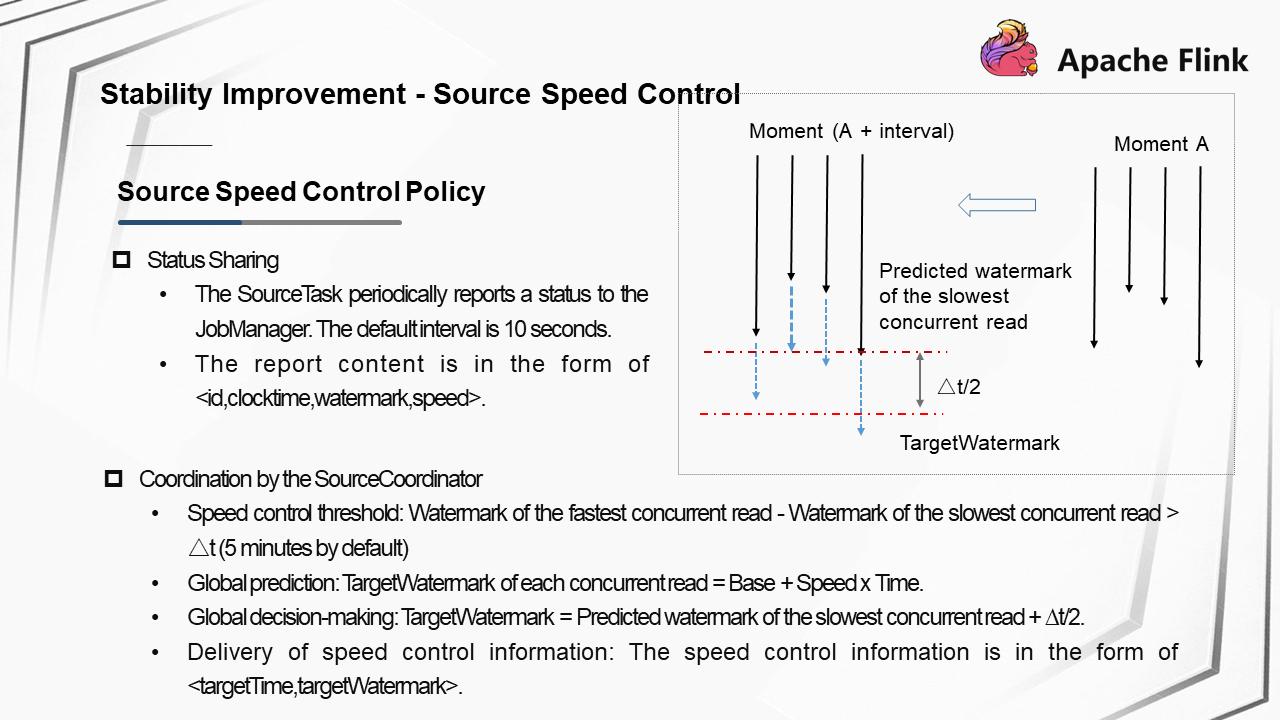
Details of the Source Speed Control Policy
The specific process by which a SourceTask shares a status to the JobManager is as follows:
<id,clocktime,watermark,speed>.Coordination is performed by SourceCoordinator as follows:
As shown in the preceding figure, at time A, four concurrent read operations arrive at the watermarks shown in the figure. Now we need to make predictions for the watermarks to be reached at the time of A + interval. The blue dotted arrows in the figure indicate the predicted watermarks to be reached by the concurrent reads. The watermark of the slowest concurrent read is selected, and the float range is the sum of the watermark and Δt/2. The lower red dotted line indicates the target watermark specified for speed control. This target watermark is sent as the global decision to the downstream task.
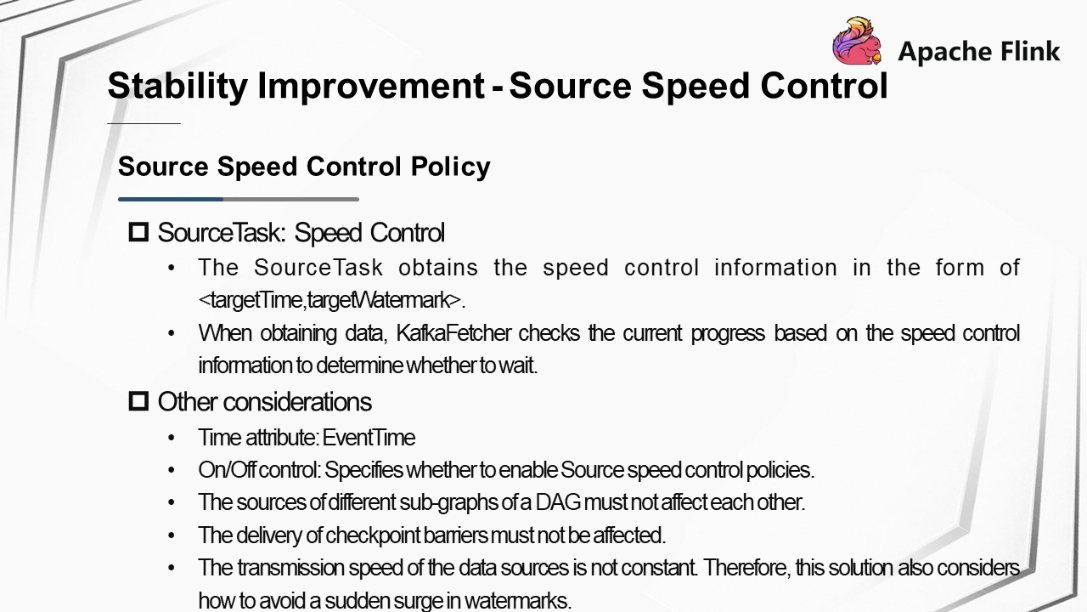
Speed control operations performed by a SourceTask:
<targetTime,targetWatermark>, the SourceTask performs speed control.Take KafkaSource as an example. When obtaining data, KafkaFetcher checks the current progress based on the speed control information to determine whether to wait, which controls the read speed. Other factors to consider in this solution are as follows:
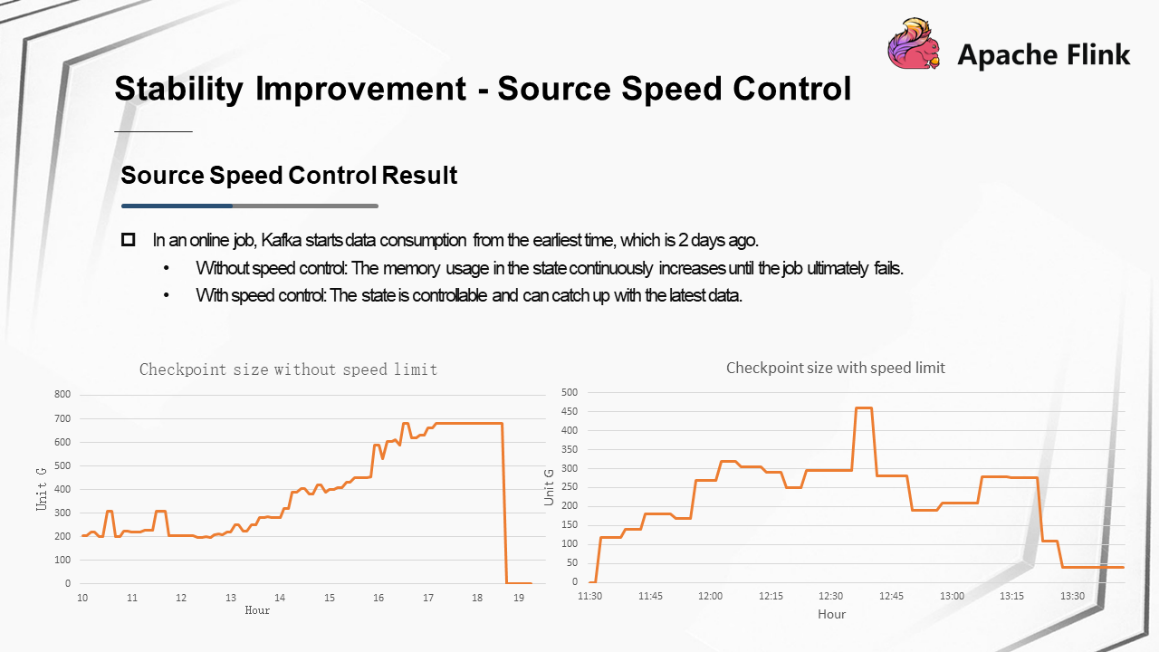
Source Speed Control Result
Take an online job as an example. Kafka starts data consumption from the earliest time, which is 2 days ago. As shown in the preceding figure, when no speed control is performed, the memory usage in the state continuously increases until the job ultimately fails. After the speed control policy is used, the memory usage in the state increases slowly at the beginning, but is controllable. In the end, the state can catch up with the latest data and maintain the memory usage at approximately 40 GB.
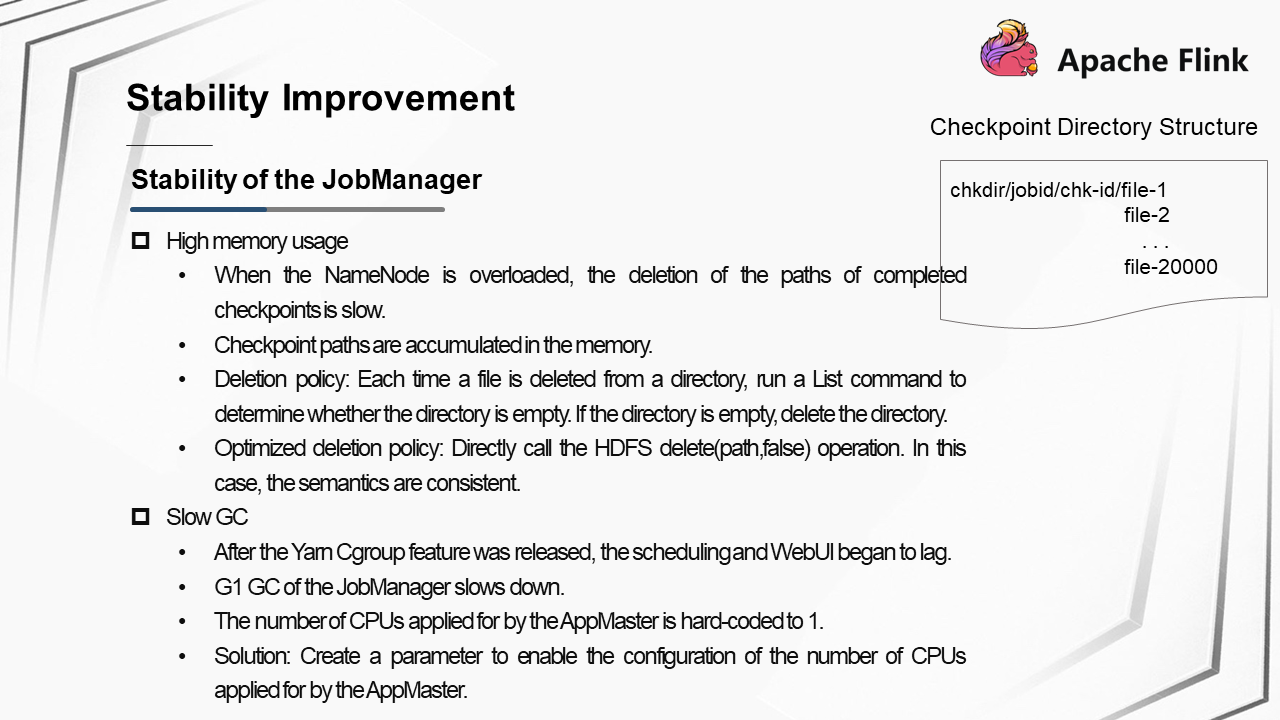
JobManager stability problems mainly occur in two scenarios, and the symptoms are similar: The WebUI of the JobManager lags when a large number of jobs are to be executed concurrently, causing job scheduling to time out. The following further analyzes the causes of the problems in the two scenarios.
Scenario 1: The memory usage in JobManager is high. The JobManager needs to control the deletion of the paths of completed checkpoints from HDFS. However, when the NameNode is overloaded, the deletion of the paths of completed checkpoints is slow, causing checkpoint paths to accumulate in the memory. According to the original policy for deleting a checkpoint path, each time a file is deleted from a directory, a List command is run to determine whether the directory is empty. If the directory is empty, the directory is deleted. However, when the checkpoint is stored in a high-level path, performing the List operation on the directory is costly. We made optimizations based on this logic to allow users to directly call the HDFS delete(path,false) operation to delete a file. In this case, the semantics are consistent, and the overhead is low.
Scenario 2: After the Yarn Cgroup feature is released, the garbage collection process performed by the garbage first garbage collector (G1 GC) of the JobManager slows down, which causes application threads to be blocked. The number of CPUs applied for by the AppMaster is hard-coded to 1. As a result, after Cgroup is used, the number of available CPU resources is limited. To solve this problem, we created a parameter to enable the configuration of the number of CPUs applied for by the AppMaster.
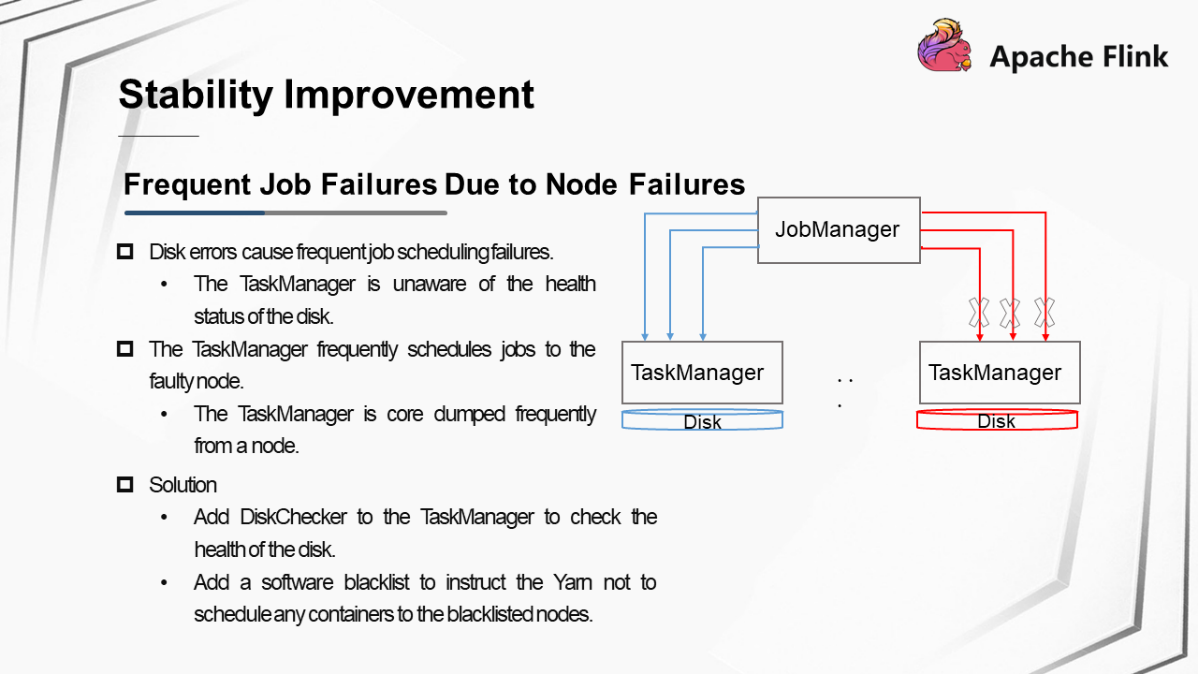
Jobs frequently failed due to node faults. This problem occurred in two specific scenarios.
Scenario 1: Disk errors cause frequent job scheduling failures. Specifically, some buffer files cannot be found when a disk error occurs. However, the TaskManager is unaware of the health status of the disk and therefore frequently schedules jobs to the TaskManager. As a result, job failures occur frequently.
Scenario 2: A problem that occurs on a node causes the TaskManager to be core dumped frequently from the node. In addition, new TaskManagers are allocated to the node successively. As a result, job failures occur frequently.
Here are our solutions to the node faults:
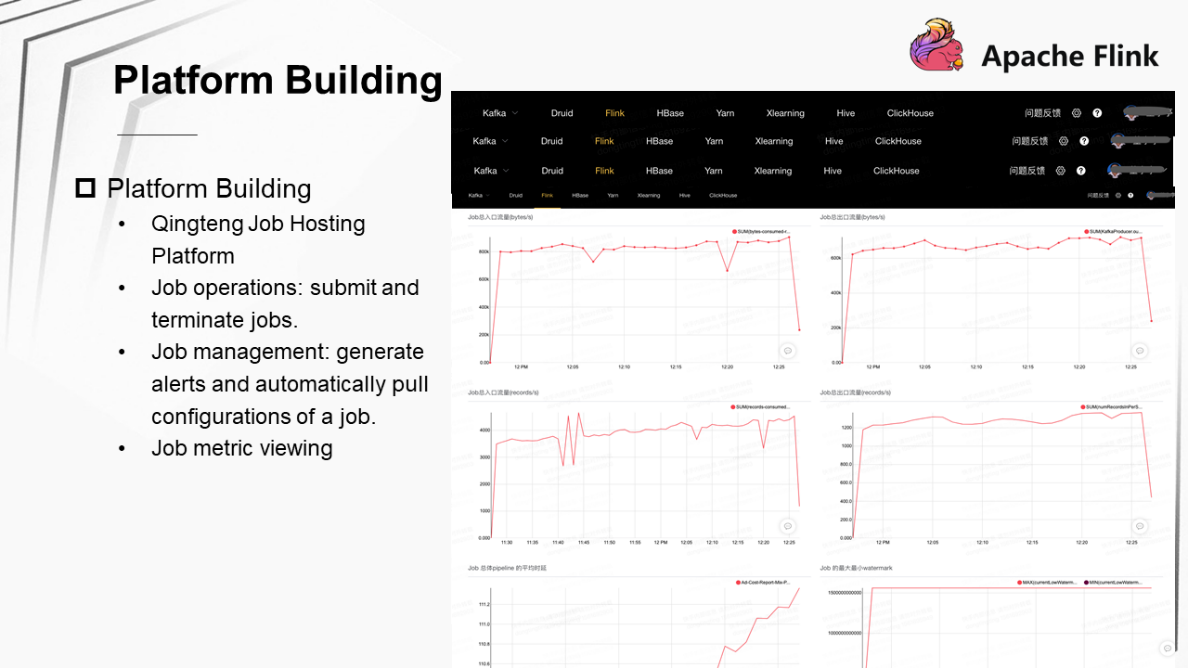
Kuaishou mainly process jobs on the Qingteng Job Hosting Platform. This platform allows you to perform job operations, manage jobs, and view job details. Job operations include submitting and terminating jobs. Job management includes managing the liveness of a job, generating performance alerts for a job, and automatically pulling a job. Job details include various metrics for a job.
The preceding figure shows the UI of the Qingteng Job Hosting Platform.
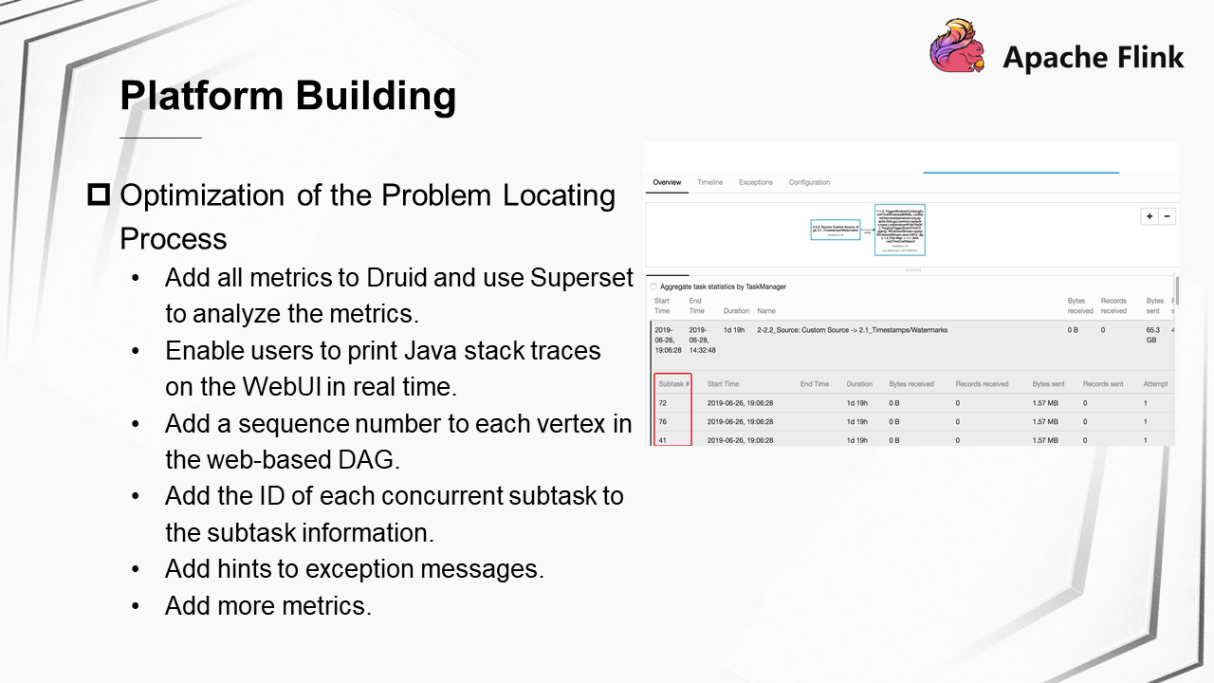
We usually need to analyze job performance for the business team to help debug some problems. This process is relatively complex. As a result, we have made great efforts to provide more information to the business team, so that they can analyze and locate problems independently.
First, we added all the metrics to Druid, allowing users to use Superset to analyze various job metrics.
Second, we made some improvements to the WebUI of Flink. Now, you can print Java stack traces on the WebUI in real time. In the web-based DAG, a sequence number is added to each vertex and the ID of each concurrent subtask is added to the subtask information.
Third, we enriched exception messages by clearly displaying hints in specific scenarios, such as machine downtime. Fourth, we added more metrics.
Kuaishou plans to accomplish two things in the future:
First, continue the ongoing development of Flink SQL. SQL can help reduce development costs for users. Currently, we are also connecting SQL to real-time data warehouses. Therefore, Flink SQL will be the most important aspect of our work in the future.
Second, we hope to optimize certain resources. At present, the business team may inaccurately estimate resource usage and concurrency when submitting a job. As a result, the system may allocate excessive resources, resulting in a waste of resources. In addition, we will explore ways to improve the overall resource utilization in the cluster.
Lyft's Large-scale Flink-based Near Real-time Data Analytics Platform

206 posts | 56 followers
FollowApache Flink Community China - January 11, 2021
Alibaba Clouder - December 2, 2020
Apache Flink Community - August 8, 2025
Apache Flink Community - August 4, 2021
Apache Flink Community - July 18, 2024
Apache Flink Community - March 20, 2025

206 posts | 56 followers
Follow Realtime Compute for Apache Flink
Realtime Compute for Apache Flink offers a highly integrated platform for real-time data processing, which optimizes the computing of Apache Flink.
Learn More Big Data Consulting for Data Technology Solution
Alibaba Cloud provides big data consulting services to help enterprises leverage advanced data technology.
Learn More MaxCompute
Conduct large-scale data warehousing with MaxCompute
Learn More Big Data Consulting Services for Retail Solution
Alibaba Cloud experts provide retailers with a lightweight and customized big data consulting service to help you assess your big data maturity and plan your big data journey.
Learn MoreMore Posts by Apache Flink Community