In our previous articles, we have demonstrated how to deploy an application in the Istio environment with an official example, as well as explored how to configure intelligent routing and distributed tracing with Istio.
This article continues to use this example to explain how to use the Istio functions of collecting, querying, and visualizing the telemetry data.
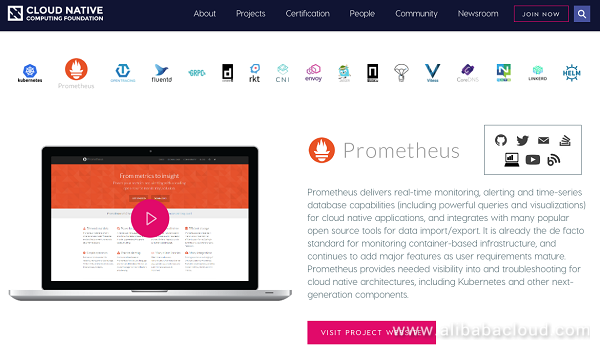
Prometheus is an open source system released by CNCF. It provides the real-time monitoring, alerting, and time series database (TSDB) functions for the cloud native applications.
First, refer to the metrics and log configurations defined in the official documentation to create a new_telemetry.yaml file.
Run the istioctl command to create the new configuration, as shown below:
istioctl create -f samples/bookinfo/new_telemetry.yaml
Created config metric/istio-system/doublerequestcount at revision 2611607
Created config prometheus/istio-system/doublehandler at revision 2611608
Created config rule/istio-system/doubleprom at revision 2611609
Created config logentry/istio-system/newlog at revision 2611610
Created config stdio/istio-system/newhandler at revision 2611611
Created config rule/istio-system/newlogstdio at revision 2611612
In the Kubernetes environment, run the following command to check that Prometheus is running properly:
kubectl -n istio-system get svc prometheus
NAME         TYPE        CLUSTER-IP    EXTERNAL-IP   PORT(S)    AGE
prometheus ClusterIP 172.21.9.66 <none> 9090/TCP 16hAfter confirming that Prometheus is running properly, open the URL of the BookInfo application in the browser: http://{EXTERNAL-IP}/productpage. Alternatively, run the following command for multiple times: curl http://{EXTERNAL-IP}/productpage
Run the following command to open the Prometheus UI:
kubectl -n istio-system port-forward $(kubectl -n istio-system get pod -l app=prometheus -o jsonpath='{.items[0].metadata.name}') 9090:9090 &Mixer has a built-in Prometheus adapter and opens a service for collecting the monitoring information.The Prometheus plugin is a Prometheus server that is preconfigured to collect metrics from Mixer.It provides a mechanism for persistent storage and querying of Istio metrics.
The configured Prometheus plugin consists of three parts:
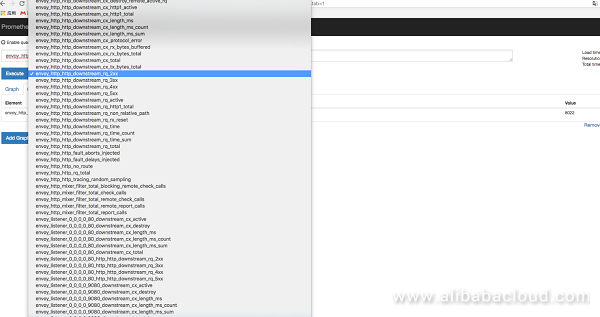
For more information about querying telemetry data using Prometheus, see the official documentation.
Prometheus comes with the Web console that allows you to conveniently perform PromQL query and debugging. For example:
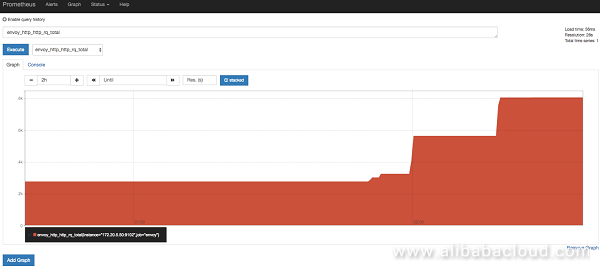
As shown in the preceding figure, the Prometheus Web interface is very simple. It facilitates timely data query and PromeQL debugging.
It does not look like a common dashboard, where data is displayed on a page as much as possible. The next section describes who to visualize the data using Grafana.
In the Kubernetes environment, run the following command to check that Grafana is running properly:
kubectl -n istio-system get svc grafana
NAME         TYPE        CLUSTER-IP    EXTERNAL-IP   PORT(S)    AGE
....
Run the following command to open the Grafana UI:
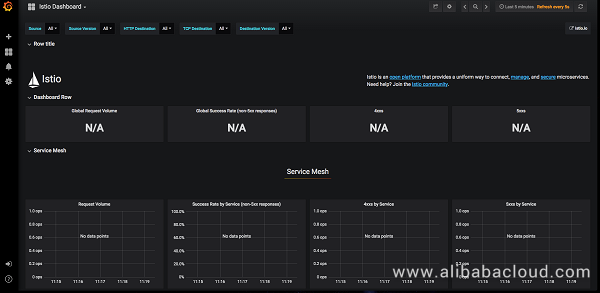
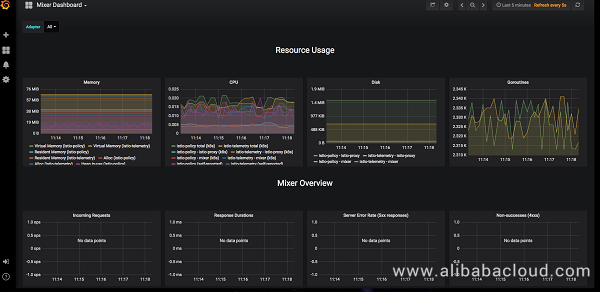
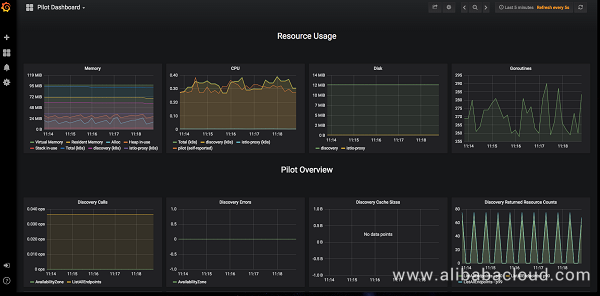
kubectl -n istio-system port-forward $(kubectl -n istio-system get pod -l app=grafana -o jsonpath='{.items[0].metadata.name}') 3000:3000 &The Grafana plugin is a preconfigured instance of Grafana. The base image (grafana/grafana:4.1.2) has been modified to start with both a Prometheus data source and the Istio Dashboard installed. In the initial installation of Istio and Mixer, a default global (used for every service) metrics is initialized.The Istio Dashboard is built to be used in conjunction with the default Istio metrics configuration and a Prometheus plugin. The following figures show the different Dashboard pages.
Istio Dashboard:
Mixer Dashboard:
Pilot Dashboard:
We can use Alibaba Cloud Container Service for Kubernetes to quickly build an Istio open platform for connecting, managing, and securing microservices, and to introduce and configure multiple relevant services for applications.Previous articles in the series use an official example to demonstrate how to deploy an application in the Istio environment and how to configure intelligent routing and distributed tracing. This article continues to use this example to explain how to use the Istio functions of collecting, querying, and visualizing the telemetry dataYou are welcome to use Alibaba Cloud Container Service for Kubernetes to quickly build an Istio open platform and integrate Istio to microservice development in your project.
This article series introduces Istio and its core components, as well as describes how to quickly build an Istio open platform for connecting, managing, and securing microservices on the basis of Alibaba Cloud Container Service for Kubernetes. These articles also use an official example to demonstrate how to deploy an application in the Istio environment; how to configure intelligent routing and distributed tracing; and how to configure Istio functions of collecting, querying, and visualizing the telemetry data.
To review these articles, see:
Distributed Tracking with Istio on Alibaba Cloud Container Service for Kubernetes
Fault Diagnosis and Detection using Istio within Alibaba Cloud Container Service for Kubernetes

56 posts | 8 followers
FollowXi Ning Wang - August 17, 2018
Xi Ning Wang - August 23, 2018
Xi Ning Wang - August 23, 2018
Xi Ning Wang - August 17, 2018
Xi Ning Wang - August 30, 2018
Alibaba Clouder - July 15, 2020

56 posts | 8 followers
Follow Container Service for Kubernetes
Alibaba Cloud Container Service for Kubernetes is a fully managed cloud container management service that supports native Kubernetes and integrates with other Alibaba Cloud products.
Learn More Container Compute Service (ACS)
A cloud computing service that provides container compute resources that comply with the container specifications of Kubernetes
Learn More ACK One
Provides a control plane to allow users to manage Kubernetes clusters that run based on different infrastructure resources
Learn More Cloud-Native Applications Management Solution
Accelerate and secure the development, deployment, and management of containerized applications cost-effectively.
Learn MoreMore Posts by Xi Ning Wang(王夕宁)