By Mu Di
CloudMetrics is a built-in on-cloud performance monitoring and analysis engine of Alibaba Cloud Elastic High Performance Computing (E-HPC) service. It supports real-time monitoring of cluster resource usage and online analysis of user job running statuses. In a heterogeneous computing scenario where a GPU is used for acceleration, CloudMetrics can monitor the usage of node host resources, as well as the usage of GPU device resources. It shows the changes to performance metrics over time, such as GPU usage, video RAM usage, and PCI-E data transmission bandwidth. This helps users better understand the running status of applications and provides guidance for optimizing applications.
Molecular Dynamics (MD) simulation is a computer simulation method for studying and analyzing the structure and properties of molecules and molecular systems using classical Newton mechanics. It is the key that can open up the world of microscopic motion. As one of the important areas of research in the HPC field, MD simulation is widely used in the development of new materials, chemical industry simulations, bio-medicine, and other fields.
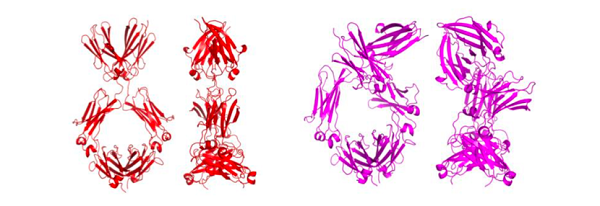
Relevant research findings have been nominated several times for the ACM Gordon Bell Prize, one of the three major engineering awards in U.S. MD simulation involves massive amounts of intermolecular interaction force computing, and the computing processes are intensive and regular. Therefore, CPU vector computing components and GPUs are suitable for the acceleration of MD simulations. GPUs can be used to accelerate the core computing processes of mainstream MD simulation software, including GROMACS, NAMD, and LAMMPS. The following figure shows the evolution of the biological macromolecule configuration obtained by using the MD simulation method.
Full utilization of GPU resources is the key to achieving optimal simulation efficiency in MD software. Using GROMACS as an example, this article uses CloudMetrics to present the runtime performance characteristics of GROMACS from different perspectives and analyze the current performance bottlenecks to optimize the software performance.
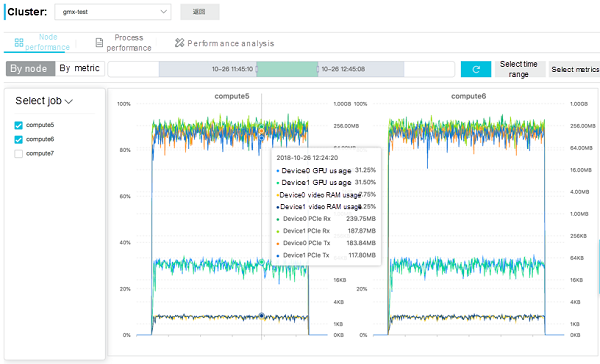
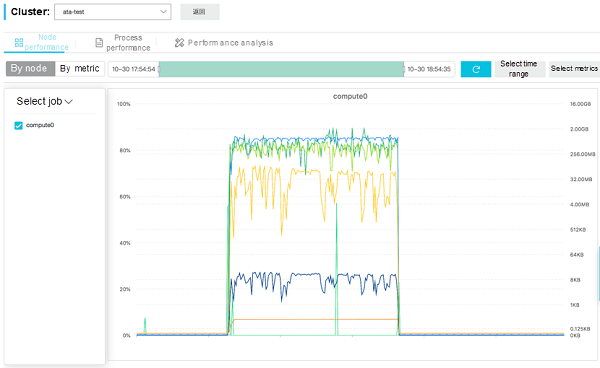
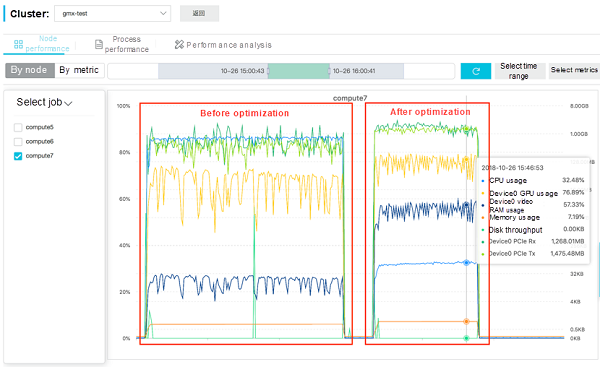
Node Dimension: CloudMetrics constructs multiple coordinate planes according to nodes selected by the user. Each coordinate plane shows the GPU resource usage of one node. Performance data of different GPUs on the same node are displayed on the same coordinate plane, with time as its x-axis. This node-based presentation mode helps users compare loads of different GPUs on the same node.
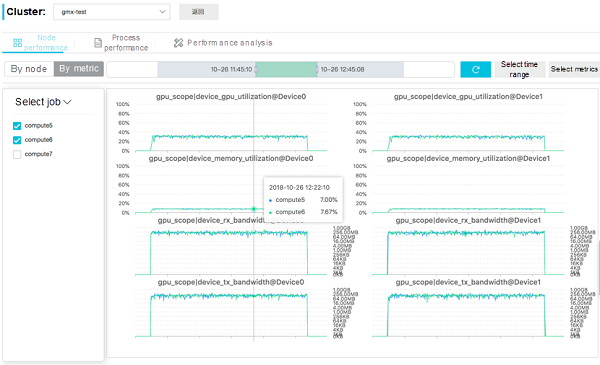
Metric Dimension: CloudMetrics constructs multiple coordinate planes based on the GPU sub-devices and performance metrics selected by the user. Each coordinate plane shows the performance of a GPU sub-device or a performance metric on different nodes. This node-based presentation mode helps users compare the GPU loads of different nodes.
In the following example, the GPU version of GROMACS runs on an ecs.gn5 instance (8 cores, 16 vCPUs, 120 GB of memory, and 2 P100s), and the system resource usage information monitored by CloudMetrics is used for optimization.
Node Dimension:
Metric Dimension:
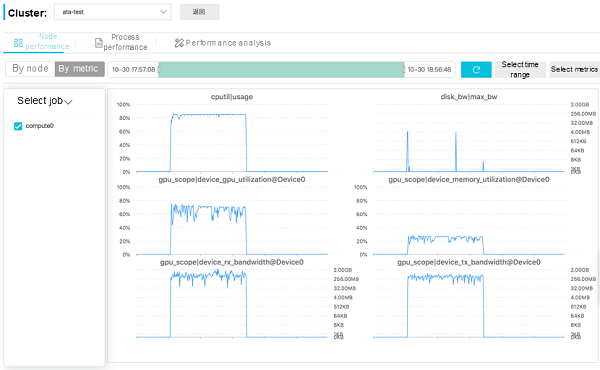
The two figures indicate that:
This indicates that the CPU computing resources are almost exhausted and the load is heavy. However, the GPU computing resources, video RAM, and PCI-E bandwidth have not reached their bottlenecks yet and can be utilized further. The GROMACS software itself uses the "CPU + GPU" active/standby collaborative computing mode.
The performance bottleneck of either the CPU or GPU will slow down the overall performance of the software. Therefore, to improve the software execution efficiency of GROMACS, you can move the load of the PME computing process from the CPU to the GPU. This method not only reduces the computing load on the CPU, but also fully utilizes the GPU computing resources, better balancing the computing load between the CPU and GPU. After completing the preceding optimization, you can use CloudMetrics again to monitor the system resource usage of GROMACS when it is running.
Node Dimension:
Metric Dimension:
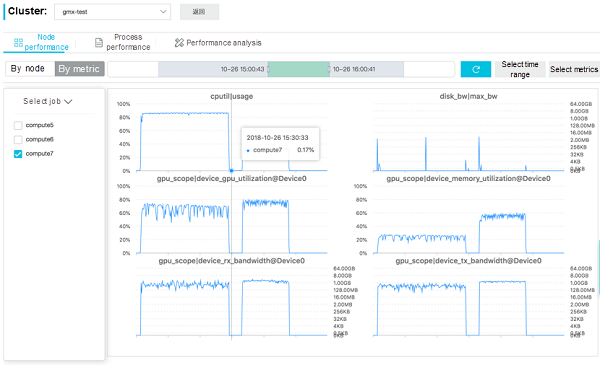
The two figures show the performance data after the PME computing process is offloaded from the CPU to the GPU:
To sum up, for software that adopts the "CPU + GPU" active/standby acceleration mode, you can balance the computing load between the CPU and GPU to greatly improve the execution efficiency of the software.
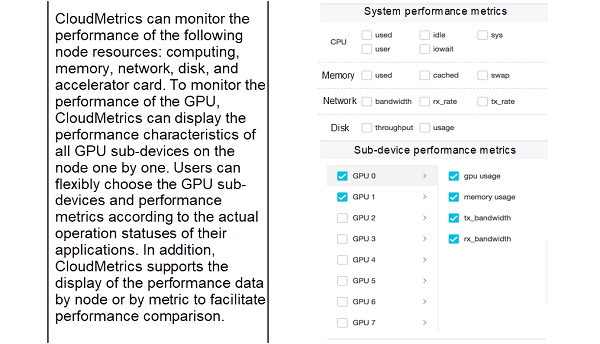
CloudMetrics can monitor the usage of cluster resources, such as computing, memory, network, disk, and accelerator card resources, and present the results to users in a systematic manner. Users can conveniently compare and analyze the performance data provided by CloudMetrics to quickly locate the performance bottlenecks and optimize their applications accordingly.
Building a High-Performance Container Solution with Super Computing Cluster and Singularity

33 posts | 12 followers
FollowAlibaba Cloud ECS - March 12, 2019
Alibaba Cloud ECS - March 12, 2019
Alibaba Clouder - November 5, 2018
Alibaba Clouder - February 12, 2020
Alibaba Clouder - April 2, 2020
Alibaba Clouder - March 24, 2020

33 posts | 12 followers
Follow Elastic High Performance Computing
A HPCaaS cloud platform providing an all-in-one high-performance public computing service
Learn More ECS(Elastic Compute Service)
Elastic and secure virtual cloud servers to cater all your cloud hosting needs.
Learn More Remote Rendering Solution
Connect your on-premises render farm to the cloud with Alibaba Cloud Elastic High Performance Computing (E-HPC) power and continue business success in a post-pandemic world
Learn More Elastic High Performance Computing Solution
High Performance Computing (HPC) and AI technology helps scientific research institutions to perform viral gene sequencing, conduct new drug research and development, and shorten the research and development cycle.
Learn MoreMore Posts by Alibaba Cloud ECS
Raja_KT March 13, 2019 at 7:49 am
Interesting... routing CPU-GPU thru PCIe :).... lots of catches