E-HPC Tune is a performance monitoring and profiling platform that lets you monitor key performance metrics, view historical data, and analyze process-level hotspots to identify performance bottlenecks.
View the ClusterView page
-
Log on to the E-HPC console.
-
In the upper-left corner, select a region.
-
In the left-side navigation pane, choose Job and Performance Management > Job > E-HPC Tune.
-
On the ClusterView page, find your cluster to view its basic information and node heatmap.
The Basic Information area of the ClusterView page shows the number of compute nodes, CPU cores, memory capacity, and GPUs. The Operation area on the right contains the Node, Process, and Profiler buttons.
In the node heatmap, each square represents a node. Hover over a square to view the node's name and its performance data.
NoteThe node heatmap can display CPU utilization, memory usage, network bandwidth, disk throughput, and disk usage. To customize the displayed metrics, click Settings in the upper-right corner of the cluster. In the dashboard settings dialog box, select the metrics to display.
View node performance
-
On the ClusterView page, find your cluster and click Node in the Operation column.
-
On the Node List page, select the nodes to view.
-
(Optional) Above the node list, click Select to view node performance for a specific job.
-
Drag the slider to adjust the time range, or click Time Range to select a different time interval.
-
Click Metrics to select the metrics that you want to view.
-
Select a viewing dimension.
-
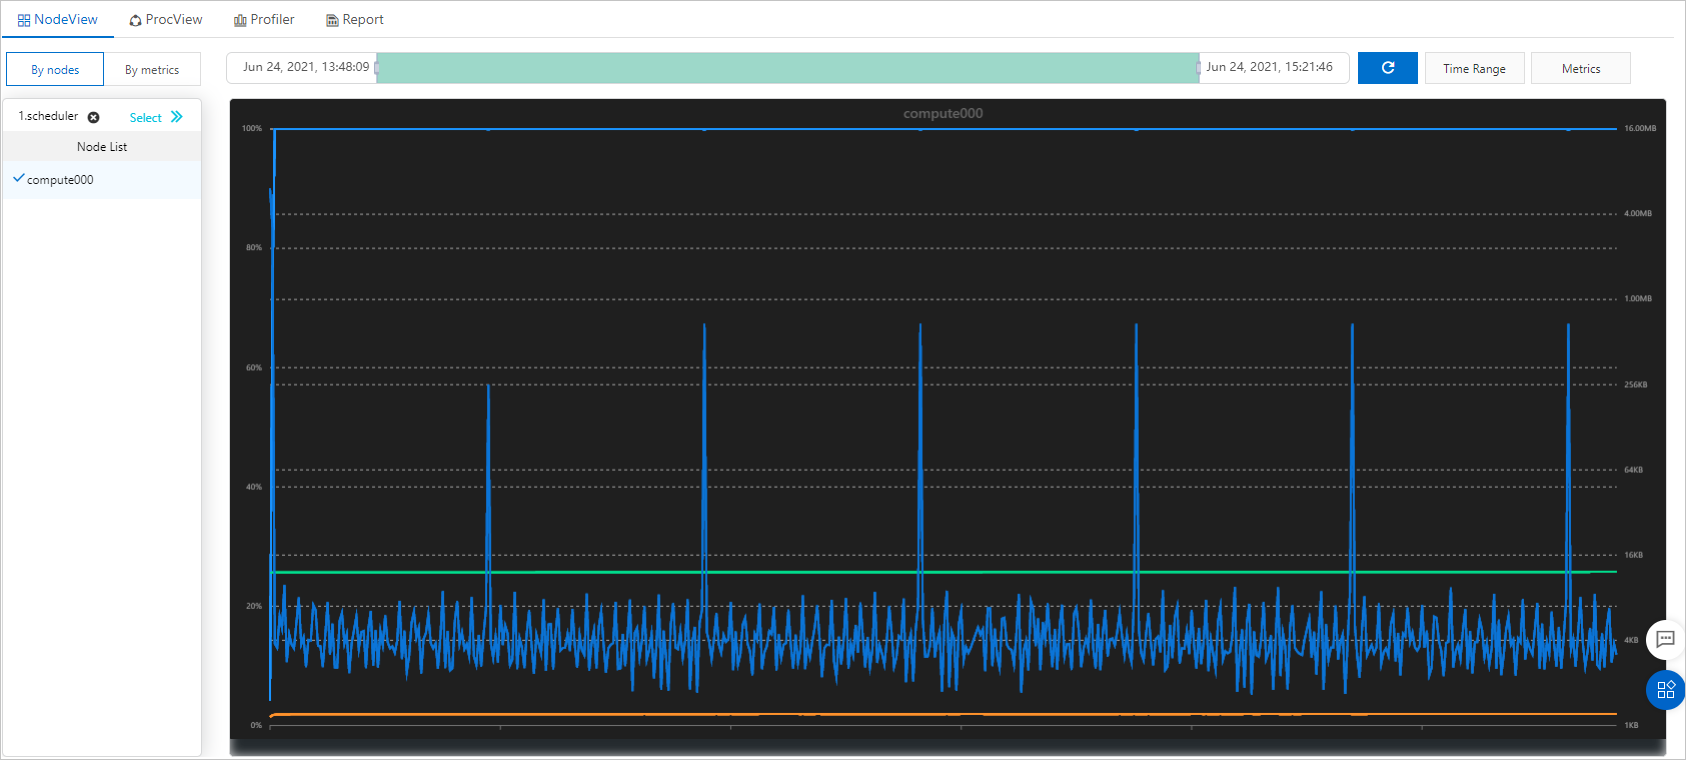
By node: Each chart displays performance data for a single node, with different lines representing different metrics.
-
By metric: Each chart displays data for a single metric, with different lines representing different nodes.
-
View process performance
-
On the ClusterView page, find the target cluster and click Process in the Operation column.
-
In the Node List, select the node that you want to view.
-
(Optional) Above the node list, click Select to view process performance for a specific job.
-
Drag the slider to adjust the time range, or click Time Range to select a different time interval.
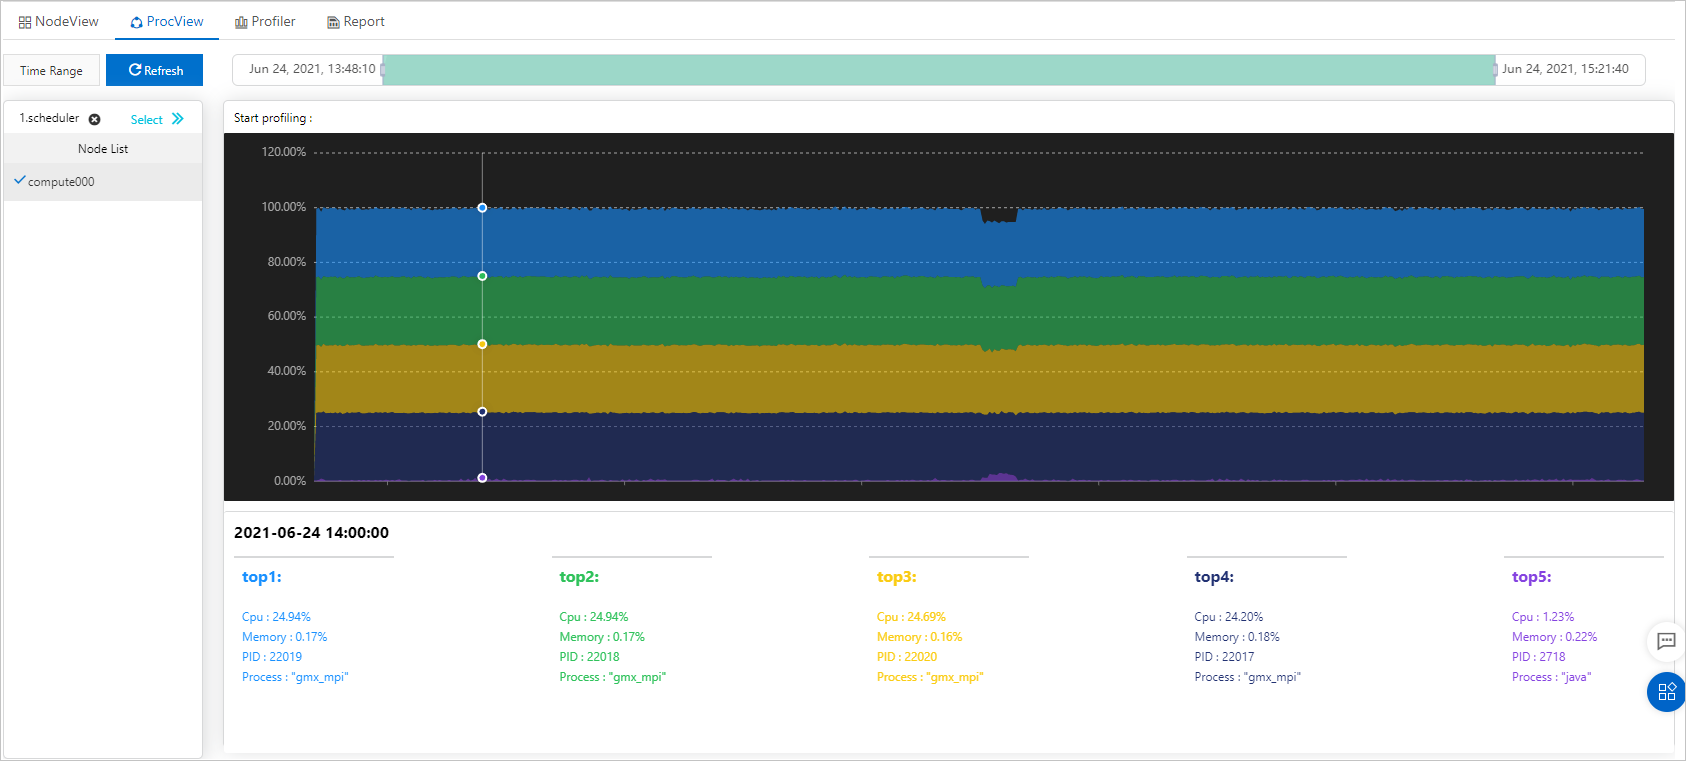
The chart displays the CPU utilization of the top five processes during the selected time range. When you hover over the chart, the area below the chart shows details of the top five processes at that specific point in time.
Profile performance
-
On the ClusterView page, find the target cluster and click Process in the Operation column.
-
On the Process Performance tab, select the process to profile.
NoteYou can profile the top five processes, ranked by CPU usage during the selected time range.
-
In the Performance Profiling Parameter Settings dialog box, set the profiling duration and sampling frequency, and then click OK.
-
On the Profiler tab, select the profiling result to view and click Show.
The right side of the page displays a flame graph for performance analysis. Use this graph to view function-level runtime information and identify high-impact functions.
Above the flame graph, you can use the Bottom-up and Top-down radio buttons to switch the view mode. The status bar at the bottom shows the name and sampling percentage of the selected function. Click the download button in the upper-right corner to export the profiling result.
-
(Optional) In the upper-right corner, click Download to save the profiling result locally.
Use this data to optimize your cluster performance.