By Tang Tang, a member of the Network R&D Department of Alibaba and the Former Postgraduate Tutor of BUPT. Tang Tang is currently involved in the R&D of network stability and has several patents related to networks and algorithms.
Released by Hologres
During the 2020 Double 11 Global Shopping Festival, Alibaba’s cloud-native real-time data warehouse was first implemented in core data scenarios in real-time for the first time. This data warehouse is built based on Hologres and Realtime Compute for Apache Flink, and has set a new record for the big data platform. This article focuses on Hologres' best practice of successfully replacing Apache Druid in the Alibaba Network Monitoring Department. Hologres also supported the real-time network monitoring screen with milliseconds response time during Double 11.
At 00:00:00 on November 11, 2020, consumers entered their shopping carts, clicked the payment button, and paid for their orders. After one minute, there was an Alipay notification for the amount spent.
Hundreds of millions of people participated in the 2020 Double 11 Global Shopping Festival simultaneously with a record peak of 580,000 transactions per second. Buyers’ shopping experiences were as smooth as silk during the entire transaction process, but this could not be achieved without Alibaba's network capabilities. With the development of technologies and the increasing prosperity of the cloud and e-commerce businesses in recent years, network infrastructures have become increasingly large and complex. How can we ensure the stability of this expanded network and provide a smooth shopping experience for users on the cloud? It is a huge challenge for network system builders and operators.
Faults are inevitable, but the ultimate goal is to locate and fix faults quickly and prevent them if possible.
The ultimate goal of stability is to expose as few faults as possible to users. In 2015, Microsoft proposed the Pingmesh system, which became a de facto industry solution. However, due to some inherent defects, the time for fault discovery is too long. Since 2017, the networking R&D department of Alibaba has been developing the world-leading Aliping detection system. The real-time Aliping system has shortened Alibaba's fault discovery time to only seconds. The shortest latency from data collection and processing to screen presenting is several seconds. The time for alerting and fault location is at the minute level. Aliping monitors Alibaba's network conditions 24/7.
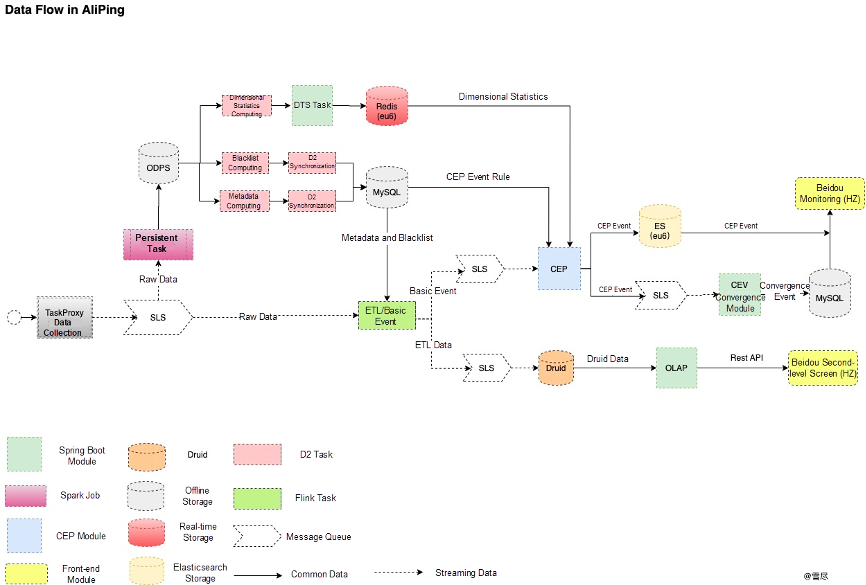
The following figure shows the core architecture of Aliping:
As the core of fault discovery, the monitoring screen plays a vital role in displaying network conditions in real-time in the entire system. Every single undulating curve may represent a damaged user business. Therefore, it is a major test for the monitoring screen to quickly display network status for timely alert and discovery of network faults, and help users address problems. The following section lists the difficulties that the monitoring personnel may encounter while using the monitoring screen:
For the monitoring screen, users’ browsing behavior are unpredictable, so the structured data cannot be computed in advance. It relies on OLAP technology to conduct real-time analysis, combine basic data, and present the results to users. The Aliping system is the application of OLAP technology, which presents fault data of different dimensions, such as IDC, region, DSW, ASW, PSW, department, and application, to users on the monitoring screen.
During the Aliping system implementation in 2017, we compared multiple OLAP databases. The section below lists several representative OLAP databases and their features:
As the business becomes more complicated, a series of problems occur during the use of Druid:
As more problems are exposed, we are also looking for a product that can replace Druid and meet the needs of real-time OLAP multi-dimensional analysis scenarios.
We learned about Hologres from the best practices accumulated by other departments in the Alibaba Group. Hologres supports high-concurrency point queries in row storage data format and real-time OLAP analysis in column storage data format. This is very suitable for the network monitoring system; therefore, Hologres is selected. The full-procedure testing and massive data verification show that Hologres can meet our scenario requirements. Therefore, we applied Hologres into the production environment.
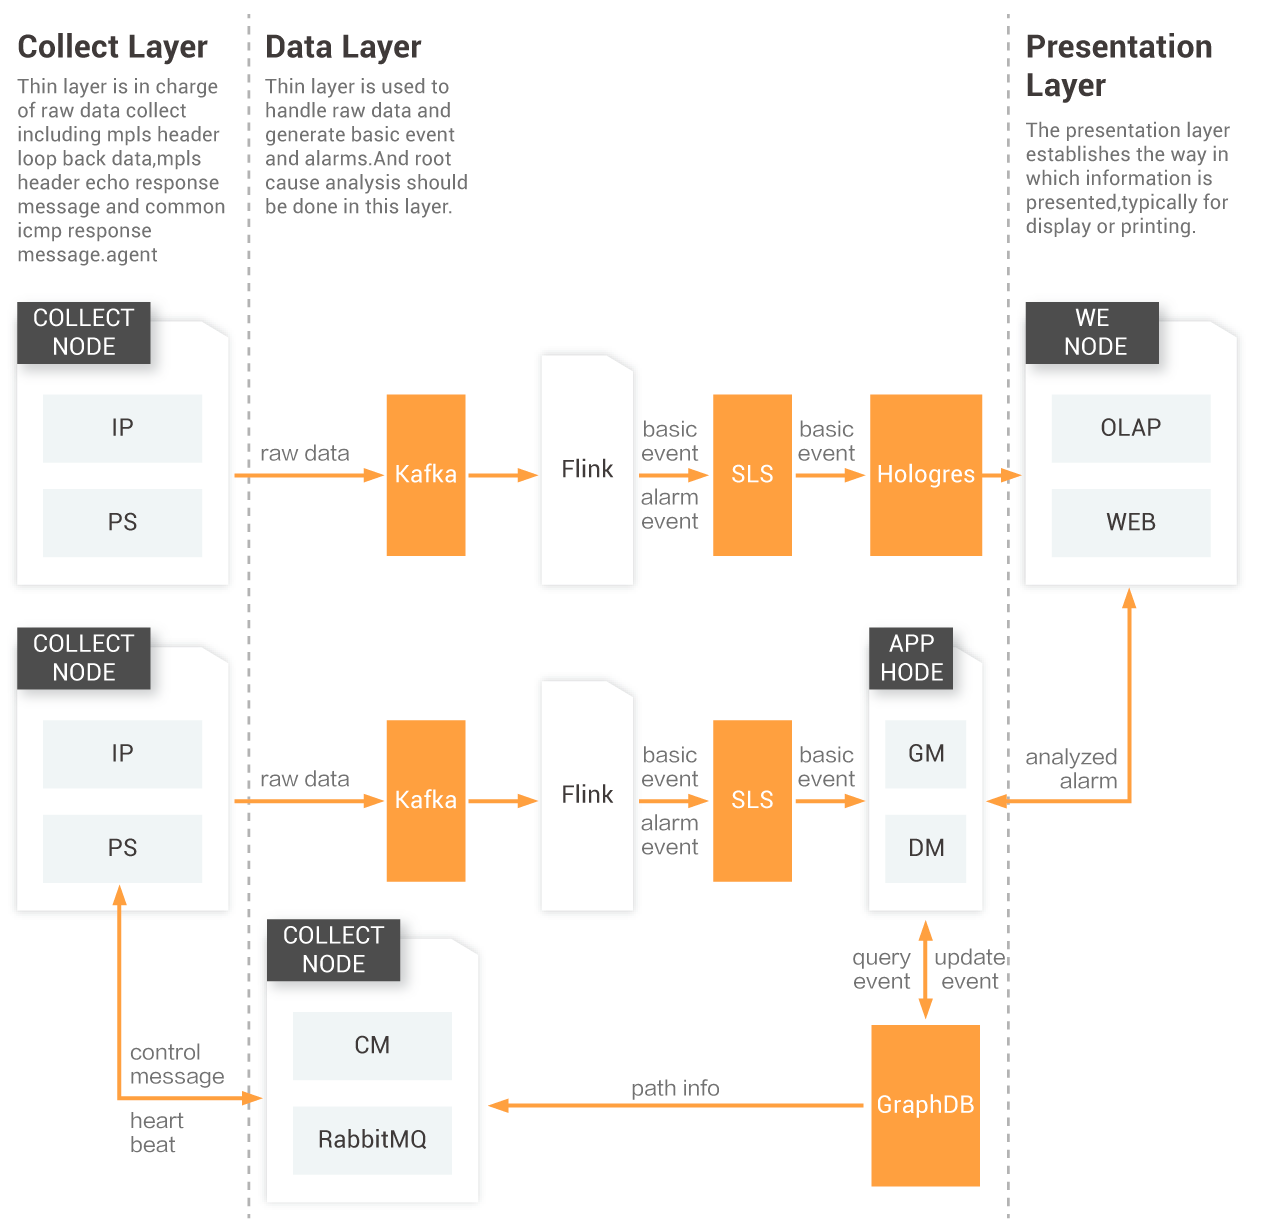
The figure below shows the data flow of the transformed OLAP system.

2020 was the first time that Hologres participated in the monitoring of AIS network faults during Double 11. The performance of Hologres met our expectations. The overall business benefits are shown in the following section:
Time is the life of real-time monitoring; the sooner the fault is detected, the faster the bleeding can be stopped. How can we filter out corresponding data among TB-size metrics based on the complex combination conditions entered by users? How can we achieve the data filtering within sub-second (milliseconds) in OLAP? These are big challenges for many systems. When properly using Hologres’ indexing function and resources allocation, Hologres perfectly meets the needs of monitoring business’ timelines.
The monitoring screen of Double 11 often needs to query historical data and make alarm predictions based on historical data. In the past, the system could only support queries from dozens of users for only nearly ten days of data. However, Hologres can support hundreds of users' large-scale parallel queries, and it still hasn’t reached the upper limit. At 00:00, during 2020 Double 11, facing hundreds of times the usual data volume, monitoring curves worked as smooth as old ones, without any delay.
Druid didn’t perform well and is prone to data congestion with hundreds of thousands of data writing per second. Hologres can solve this real-time data ingestion problem easily.
Hologres is compatible with Postgres and fully supports SQL. It is easy for new users to use without studying the syntax. Hologres is also compatible with existing BI tools. It can connect to the monitoring screen without any modifications, saving a lot of learning time.
The smooth shopping experience during 2020 Double 11 could not be achieved without Alibaba's network capabilities. The monitoring screen serves as the eyes that focus on Alibaba's network conditions. As the core of the monitoring screen, Hologres continuously empowers the monitoring screen. However, Hologres is still immature in some aspects and needs to be improved with transparent upgrades and stability. We are willing to grow together with Hologres and look forward to better performance in the 2021 Double 11 shopping festival.
Second-Level Response Time Achieved in Fliggy’s Double 11 Real-Time Data Big Screen by Hologres
AlibabaCloud_Network - November 12, 2018
Alibaba Clouder - November 25, 2020
AlibabaCloud_Network - December 19, 2018
Alibaba Clouder - April 2, 2021
Alibaba Clouder - January 22, 2020
AlibabaCloud_Network - December 3, 2019
 Black Friday Cloud Services Sale
Get started on cloud with $1. Start your cloud innovation journey here and now.
Learn More Big Data Consulting for Data Technology Solution
Alibaba Cloud provides big data consulting services to help enterprises leverage advanced data technology.
Learn More Big Data Consulting Services for Retail Solution
Alibaba Cloud experts provide retailers with a lightweight and customized big data consulting service to help you assess your big data maturity and plan your big data journey.
Learn MoreMore Posts by Hologres