By Yuming

Seeing the title, many people may wonder if it's just a clickbait, right? Let me explain in detail.
Our application code is written in Java, so the flame graph tool used is Arthas, and the following profiling is also based on this.
Official Documentation: https://arthas.aliyun.com/doc/profiler.html
$ profiler start
Started [cpu] profiling$ profiler stop --format flamegraph
profiler output file: /tmp/test/arthas-output/20211207-111550.html
OKAs shown above, an HTML flame graph file will be generated by default. For more information about the specified output format, please refer to the official documentation.
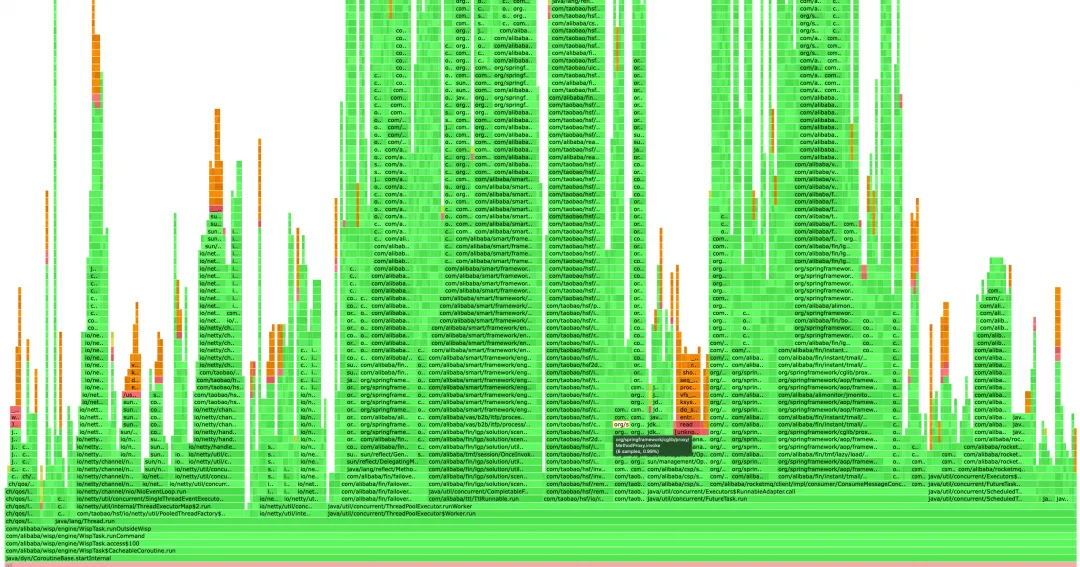
The horizontal axis of the flame graph represents the CPU usage time. The wider the horizontal axis, the more CPU usage. You can also see how much CPU this method has occupied by moving the mouse.
The vertical axis represents the call stack, with the higher flame representing a deeper call stack.
The green sections represent Java code, the yellow sections represent JVM C++ code, the orange sections represent kernel-mode C language code, and the red represents user-mode C language code.
The situation is, that business is simply to perform a series of operations after monitoring the shipping messages, which can be divided into automatic and batch operations. When large users in batch perform business operations, tens of thousands of orders even hundreds of thousands of orders will be generated at the same time, which is equivalent to the traffic during the big promotion. Therefore, CPU usage is always spiked, sometimes even up to over 80% on a single machine. Moreover, during daily traffic, the CPU usage seems somewhat high compared to the traffic data, so we decided to use a flame graph for profiling.
Below are two typical cases in the optimization process.
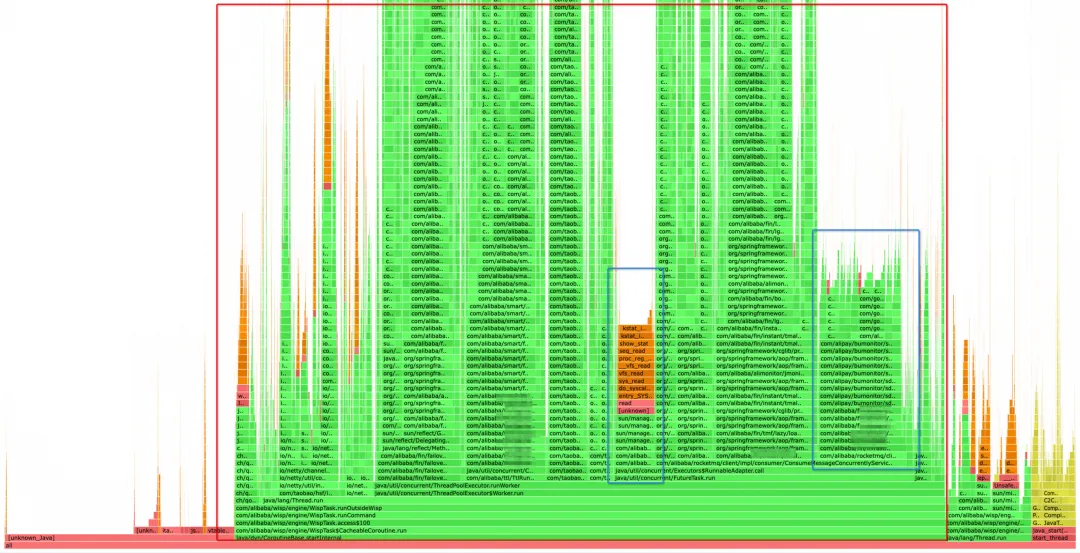
The simplest way to profile a flame graph is to find large flat tops. If a method is time-consuming and called many times, then its horizontal axis must be wider, which is reflected in the flame graph as a large flat top.
The red box in the graph shows the execution of the business code, in which the blue box is the time-consuming operation initially located. After you click on it, you can see that the left side is the CPU usage of Sentinel sampling, which occupies 3% to 4% of the total CPU. This section should not increase with the rise in traffic, so we did not focus on this one this time. The second section is executed in the MetaQ consumer code, which requires close attention. This is because our application is message-driven; it performs corresponding operations after receiving the shipping messages from TP. As the MetaQ traffic increases, the corresponding operations will likely increase.
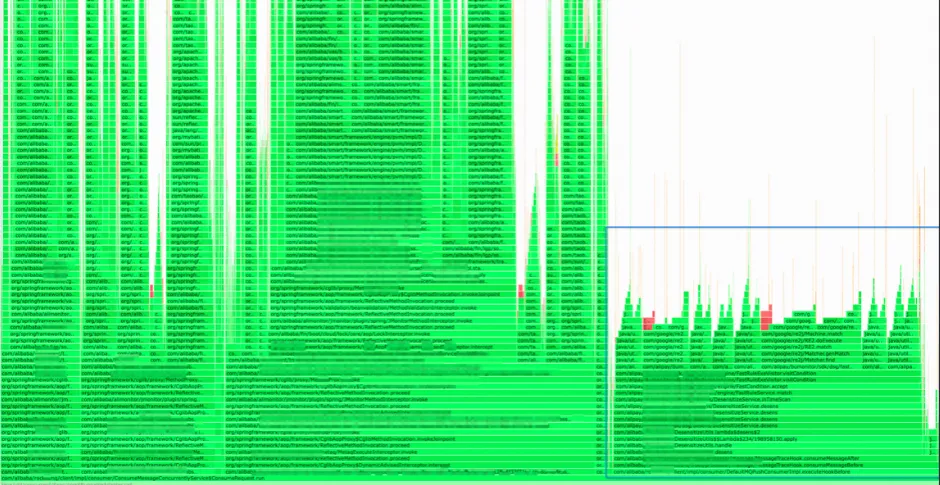
It occupies an astonishing 9.3% of the total CPU usage.
Upon clicking, it can be seen that it is a desensitization tool, whose impact on performance is almost on par with that of the shipping messages. After troubleshooting, it was found that it is a link-collection tool used within our department. When collecting MetaQ messages, it performs desensitization processing on the messages. The desensitization tool will match names, email addresses, and mobile phone numbers respectively, while the transaction messages we receive contain the entire order information. This object is very large (containing extended fields and many other information), and the workload for desensitization using regular expressions is enormous. Under normal circumstances, using this tool to collect online traffic does not have a great impact on performance, but in our scenario, the impact is a bit unexpected.
Since we usually do not pay attention to the content of messages on the link graph and mainly use it to view HSF links, we directly turn off the collection of MetaQ by DP.

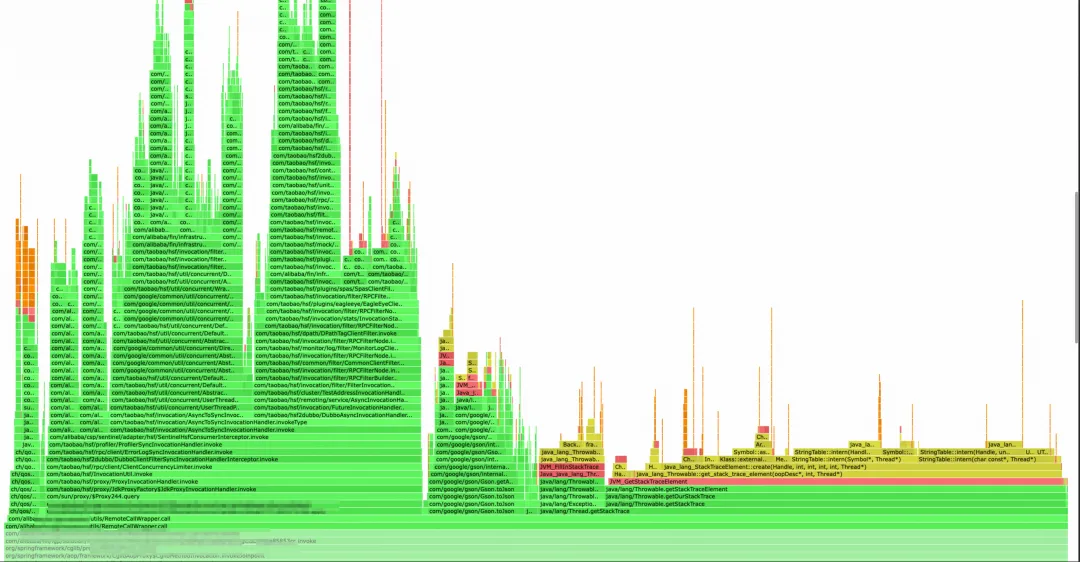
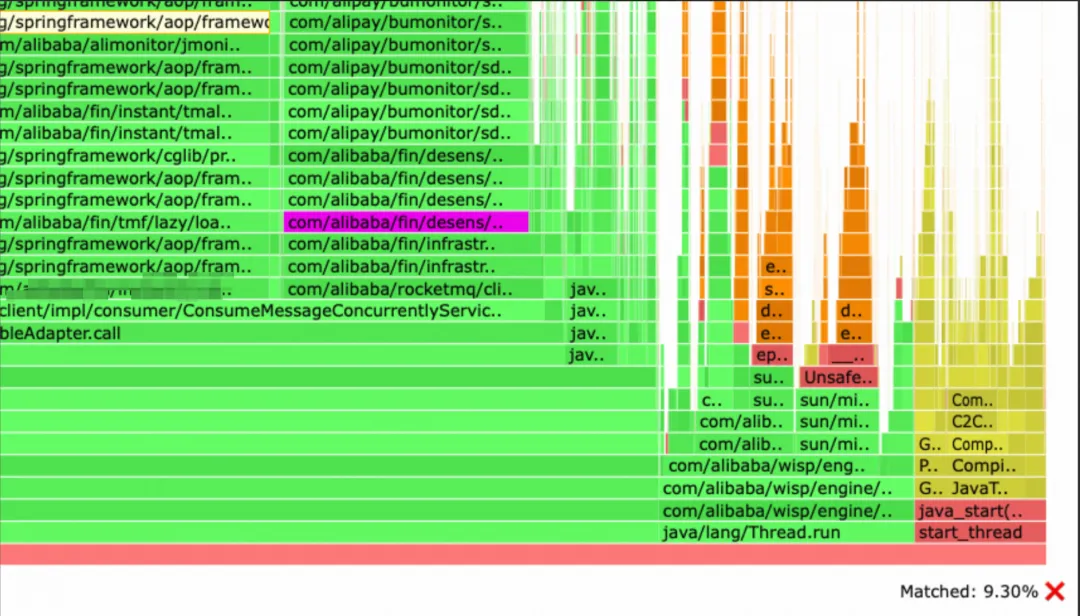
After using global search, it occupies nearly 6% of the CPU. This is a flame graph intercepted under daily traffic, and the proportion will be even larger when the system traffic increases.
Upon opening, it can be seen that during the HSF call, obtaining the Java call stack is quite time-consuming. When writing codes before, we suspected that obtaining the call stack would decrease some performance, but we did not expect that it would take more time than one HSF call itself. This section was used to obtain the call source and print it to the log for easy troubleshooting (legacy code). Later, the HSF call logs were changed to be processed through HSF Filters, eliminating the logic for obtaining the call stack.
I did not locate Case 2 by viewing from top to bottom at the beginning, because there is more than one section to call HSF, and each call does not take long. It is difficult to find Case 2 from top to bottom as a whole.
If viewing from top to bottom does not yield clear results, we can profile from the main traffic entry points of our system, clicking step by step from the bottom entry points, which can also help us identify the issue. With a skeptical attitude, we did not initially notice the problem at the top. We began by examining the message entry point and then clicked our way up to discover that this call consumed more time than HSF.
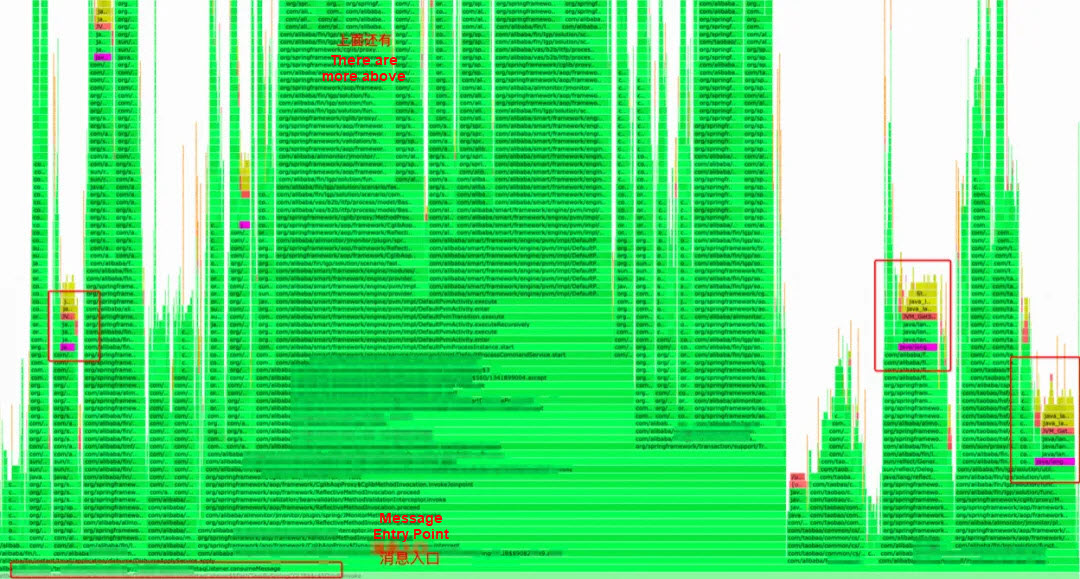
It can be seen that this call is not concentrated in one section, and there are calls in every section, so the overall impact on performance is great.
After the global search, you can see that there are calls everywhere (shown by the purple sections in the graph).
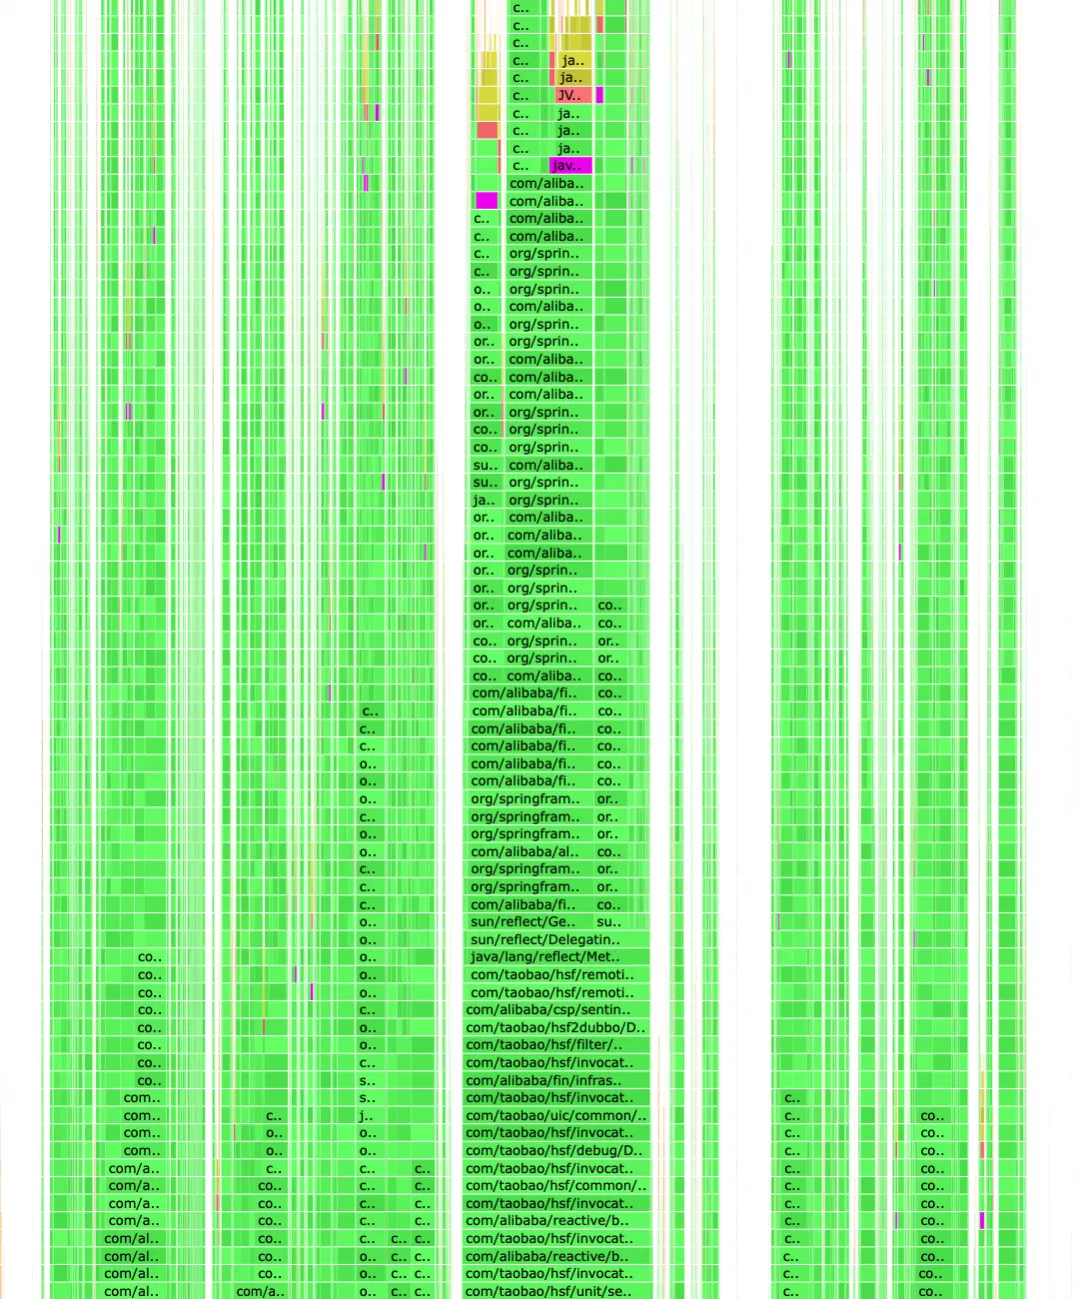
When viewing from bottom to top is more suitable for refinement, specifically profiling and optimizing a link.
Let's calculate the data.
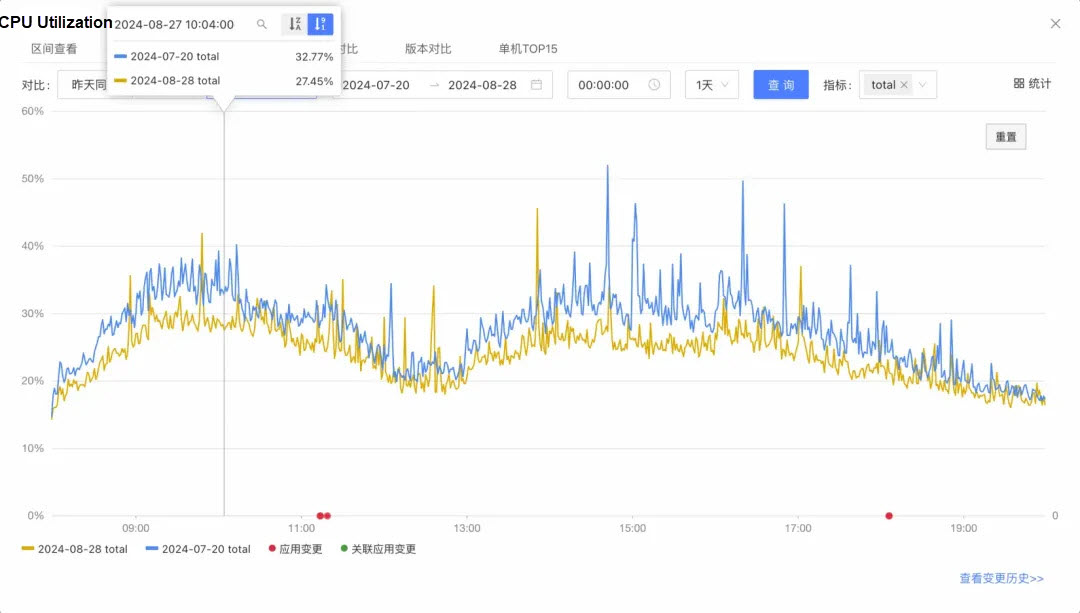
Overall, the optimization achieved is roughly 5% to 6% (in July, there were 30 machines, and in August, the number was reduced to 27). Taking 5%, the system CPU is occupied at about 6.5%. From the perspective of daily traffic, the user-mode CPU usage is reduced by 19% + from 26% to 21%. Considering the reduction in the number of machines, an optimization of around 20% is likely achieved.
Since this is the optimization result of daily traffic, the reduction in system load should be more obvious when the traffic greatly increases during the big promotion. After optimization, even with large users performing batch operations, the instantaneous traffic should not cause any machine's CPU usage to exceed 60%.
Subsequently, we will continue to focus on optimization during the Double 11 stress tests. As traffic increases, more issues may be exposed.
Disclaimer: The views expressed herein are for reference only and don't necessarily represent the official views of Alibaba Cloud.
Alibaba to Invest RMB380 billion in AI and Cloud Infrastructure Over Next Three Years

1,396 posts | 492 followers
FollowAlibaba Cloud Native - April 16, 2024
Alibaba Cloud Community - January 8, 2024
Alibaba Cloud Native - February 2, 2024
Alibaba Cloud Native Community - September 22, 2025
Alibaba Cloud Native - July 4, 2023
OpenAnolis - April 20, 2026

1,396 posts | 492 followers
Follow Web Hosting Solution
Explore Web Hosting solutions that can power your personal website or empower your online business.
Learn More YiDA Low-code Development Platform
A low-code development platform to make work easier
Learn More mPaaS
mPaaS
Help enterprises build high-quality, stable mobile apps
Learn More Web Hosting
Explore how our Web Hosting solutions help small and medium sized companies power their websites and online businesses.
Learn MoreMore Posts by Alibaba Cloud Community