By Yibo
Better application performance can provide a better user experience, reduce enterprise IT costs, and make the system more stable and reliable. Before the advent of application performance profiling, developers had to rely on various logs and monitoring to troubleshoot problems. This required embedding points in the application code in advance, which was intrusive to the application code and could not provide sufficient information due to incomplete embedding points. It was time-consuming to diagnose problems, and the cause could not be found in many cases.
With the emergence of application performance profiling technology, developers can easily identify application performance bottlenecks (such as high CPU utilization, high memory usage, etc.) to optimize. However, due to the high technical overhead of early application performance profiling, it can only be opened in the development environment but not in production for a long time. When problems occur in the production environment, they are probably not recorded. It is very difficult for developers to simulate and reproduce problems in the development environment, resulting in low efficiency in solving problems and possible inability to solve them.
In recent years, performance profiling technology has continued to develop with additional functions and significantly improve overhead, reaching the level of continuous opening of the production environment. However, there are still many obstacles to widespread popularity. The general process of performance profiling has three steps: capturing in the production environment, saving performance profiling files, and visualizing performance profiling files. When the application volume is large, each of these three steps is difficult, and a large number of computing, storage, product design, and other problems need to be solved.
ARMS Continuous Profiler [1] was created and jointly developed by the Alibaba Cloud Application Real-Time Monitoring Service [2] Team and the Dragonwell [3] Team. Based on the most mature performance profiling technology, it productizes the entire performance profiling process and is suitable for continuous opening in the generation environment. Compared with conventional performance profiling, ARMS Continuous Profiler increases the time dimension. The core features are listed below:
Let's use an example to illustrate how to use it to solve problems.
Let’s take the application of a library as an example. Its Java process takes up a lot of CPU, the interface response time reaches more than ten seconds, and the application performance is very poor.

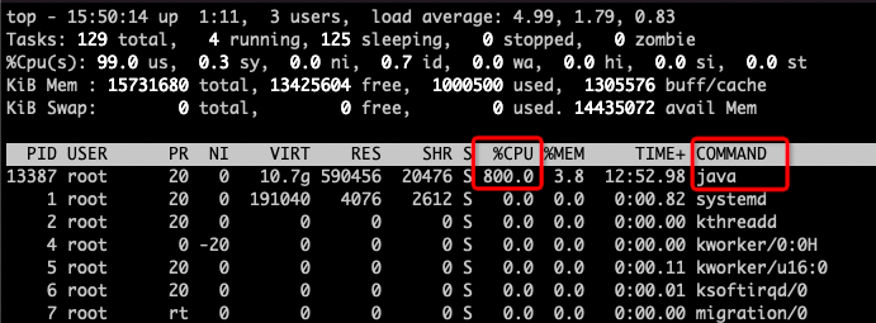

Since the current application CPU usage is very high, we directly select the CPU Time menu path in the performance analysis type: ARMS console → application home page → application diagnosis → CPU&memory diagnosis.


From the flame diagram, we can see that the java.util.LinedList.node(int) method takes up 85% of CPU, and the corresponding business code method is DemoController.countAllBookPages(List). Combined with the code, we can find that this method has poor performance for collections with many objects because it has to be traversed one by one from the beginning or the tail.
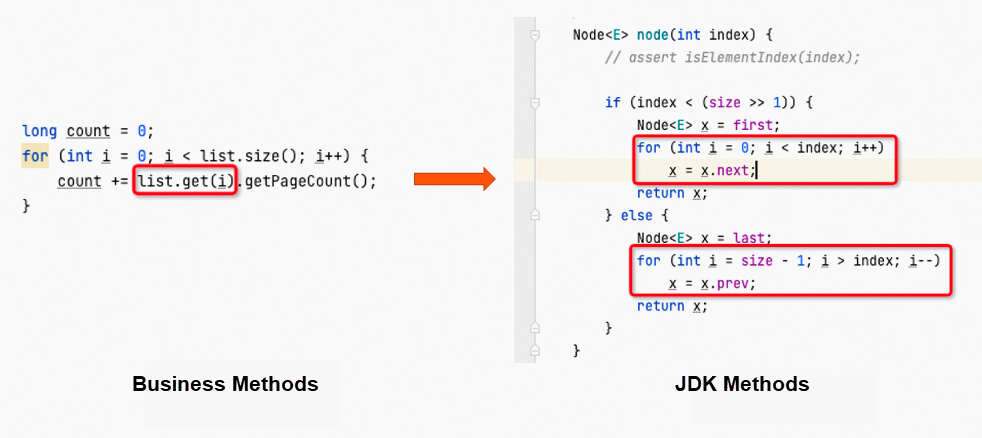
After locating the cause, we can fix it through two solutions. The first method is to change the LinkedList to an ArrayList with a more efficient subscript access method.

The second method is to change the traversal algorithm of LinkedList from a normal for loop to an enhanced for loop.

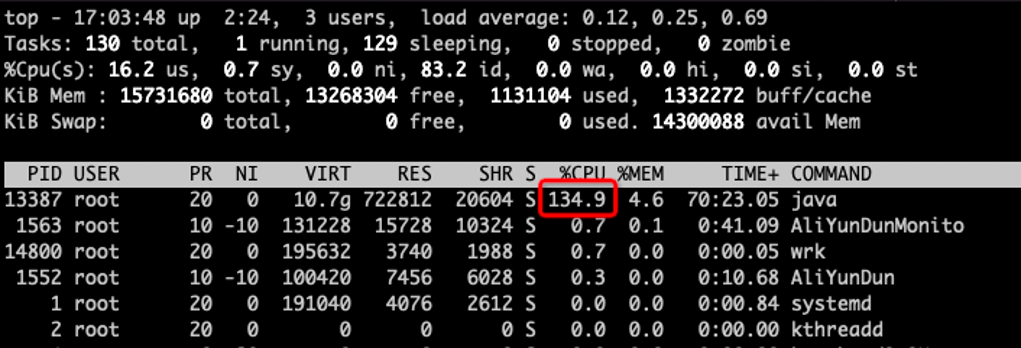
Redeploy the repaired code and stress test the two scenarios with the same pressure. You can see that the interface response time is significantly reduced, and the CPU utilization of the Java process is significantly reduced.

Let’s take the application of a library as an example. Its Java process takes up a lot of CPU, the interface response time reaches more than ten seconds, and the application performance is very poor.


Since the current application CPU usage is very high, we directly select the performance analysis type: CPU Time menu path: ARMS console → application home page → application diagnosis → CPU&memory diagnosis.


From the CPU hotspot method, we find that Java processes spend 89% of their time doing GC, indicating that the application has great memory pressure. Our next step is to select memory hotspot profiling.


The memory application hot spot flame chart in the figure above shows that the DemoController.queryAllBooks method accounts for 99% of all memory applications in the past period. Further inspection shows that the business code has created 20,000 large objects and saved them to List.
Note: This method should have read 20,000 books from the database. It is simplified here, but the effect is the same. It creates a List in the heap that takes up a lot of memory.

This interface was originally intended to query the list of books by page, but due to an implementation error, all books were found out by mistake, and only the specified page part was returned in the end. Then, it can be queried directly from the database by page, thus avoiding a large amount of Java memory occupation.

Redeploy the repaired code and perform stress testing under the same pressure. You can see that the response time of the interface is significantly reduced, and the CPU utilization of the Java process is significantly reduced.


The product is divided into three parts. The first part is responsible for collecting performance profiling data on the application side, the second part is used to transmit and store profiling result files, and the third part is used to query and display.
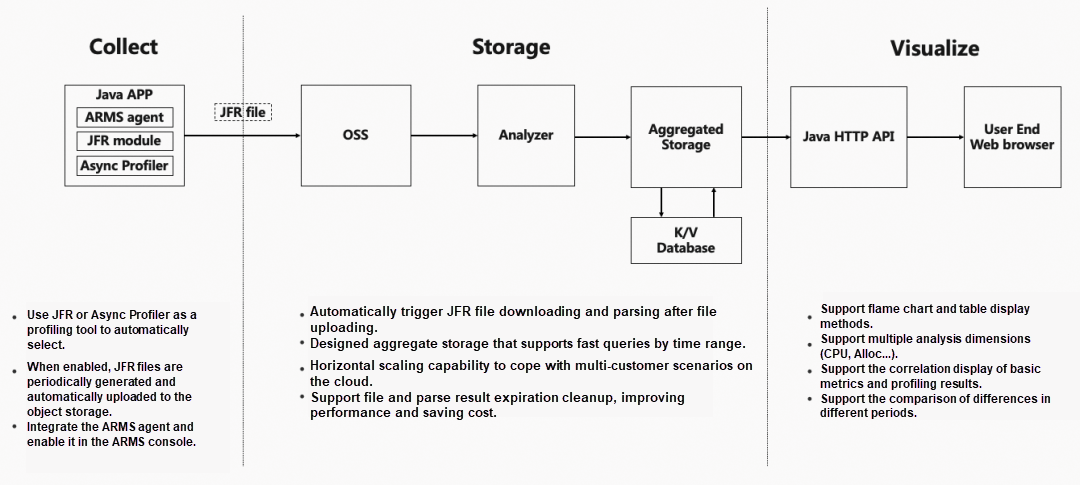
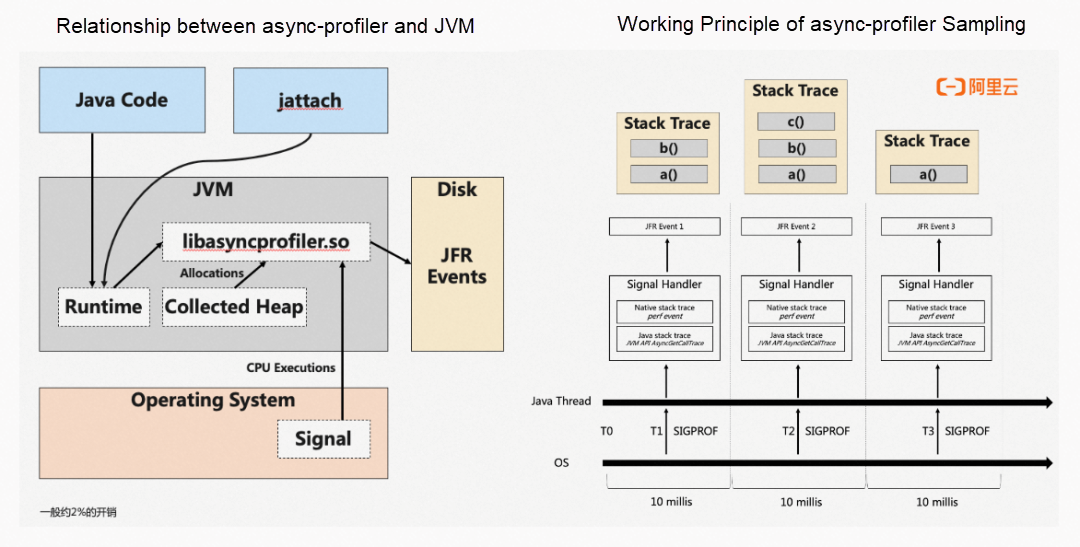
The first part mainly uses Java Flight Recorder [4] and async-profiler [5]. We will automatically select one according to the Java version. Its core function is to sample the application periodically and will not cause inaccurate results due to security point problems. The following figure shows an example of sampling a thread six times. You can see the call stack at the moment of each sampling. The final file is saved in JFR format.

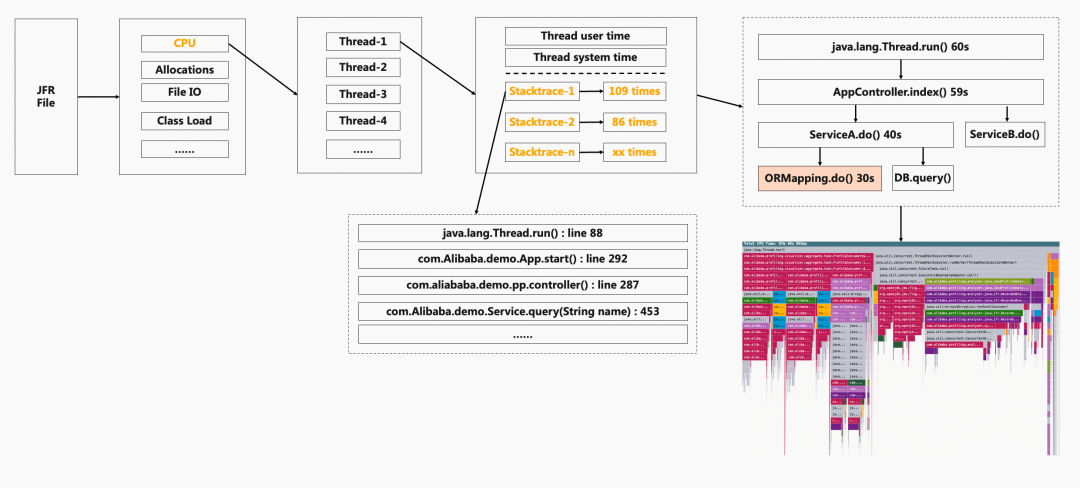
The second and more important part is JFR Analyzer, whose core function is to read JFR files, parse, compute, and aggregate them and finally generate intermediate results that are easy to query and display. The core function of the third part is to display the analysis results as a table or flame chart, which also supports the ability to compare.
JFR is a low-overhead monitoring and performance profiling tool built into OpenJDK that is deeply integrated in every corner of the virtual machine. When Oracle open-sourced JDK Flight Recorder on OpenJDK 11, Alibaba was also a major contributor, working with community contributors (such as RedHat) to port JFR to OpenJDK 8.
JFR consists of two parts. The first part is distributed on each critical path of the virtual machine and is responsible for capturing information. The second part is a separate module in the virtual machine, which is responsible for receiving and storing the data generated by the first part, which is often called an event.
JFR contains more than 160 events, and JFR events contain a lot of useful context information and timestamps – for example, the method execution call stack, file access, the occurrence of a specific GC phase, or the duration of a specific GC phase.

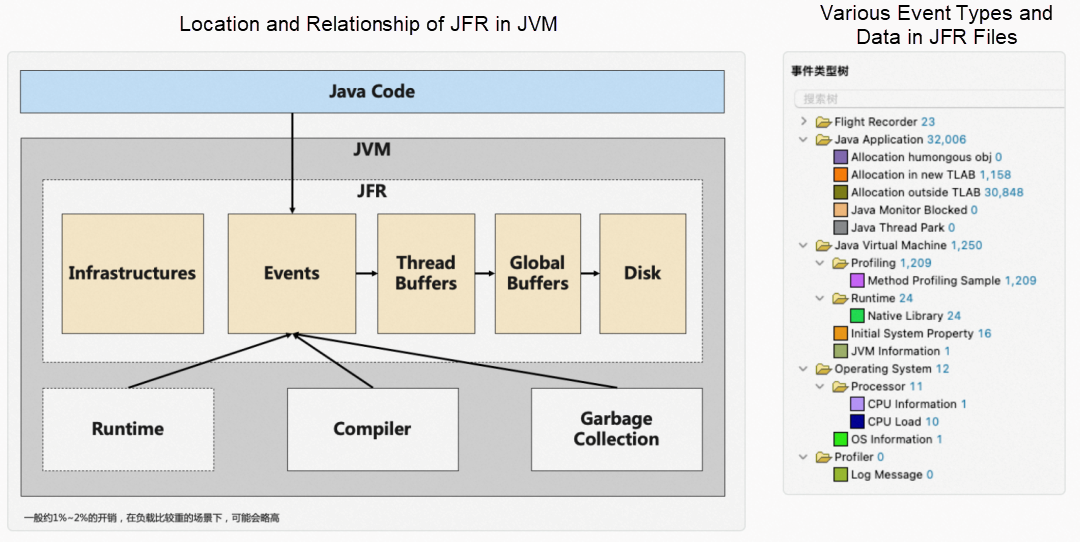
async-profiler is a low-overhead Java performance profiling tool that relies on JVM-specific APIs for profiling CPU and memory applications.
Since the JFR functionality on OracleJDK 8 is a commercial feature, we use an async-profiler as a replacement technology on OracleJDK 8 to achieve the same profiling capabilities. For OpenJDK8, due to the large performance overhead of the memory application hotspot profiling function, we also use the async-profiler as an alternative technology.
async-profiler is developed in C++, loaded into the JVM process in a dynamic library, and supports the generation of JFR format files. No matter whether we use JFR or async-profiler, since the file format is the same, the analysis and storage schemes can be reused.
The input to the JFR File Analyzer is the JFR file, and the output is a tree structure that supports efficient queries by time range. A JFR file can contain data from multiple aspects (such as CPU hotspots and memory application hotspots). Each aspect has corresponding parsing and storage implementation.
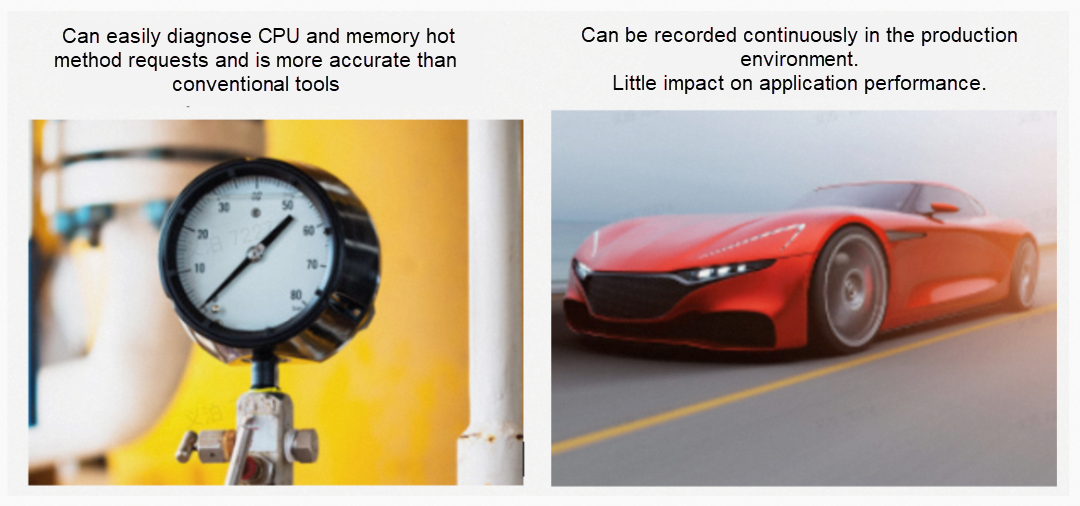
This article introduces the background of continuous performance profiling, demonstrates the actual use of the ARMS Continuous Profiler through two examples, and introduces the design and core modules of the ARMS Continuous Profiler. The main features of which are as follows.

[1] ARMS Continuous Profiler (Currently only available in Chinese)
https://help.aliyun.com/document_detail/473143.html
Application monitoring console function:
https://www.alibabacloud.com/help/en/application-real-time-monitoring-service/latest/application-monitoring-console-functions
[2] Application Real-Time Monitoring Service
https://www.alibabacloud.com/help/en/application-real-time-monitoring-service
[3] Dragonwell
https://dragonwell-jdk.io/#/index
[4] Java Flight Recorder
https://docs.oracle.com/javacomponents/jmc-5-4/jfr-runtime-guide/about.htm
[5] async-profiler
https://github.com/async-profiler/async-profiler
Alibaba Cloud Was Named a Leader in the Forrester Wave™: FaaS, Q2 2023
The Practices and Exploration of Alibaba Cloud ApsaraMQ for Kafka Ecosystem Integration

212 posts | 13 followers
FollowAlibaba Cloud Native Community - May 9, 2023
Alibaba Cloud Native Community - September 22, 2025
Alibaba Cloud Native - April 16, 2024
Alibaba Cloud Native - February 2, 2024
Alibaba Cloud Community - July 7, 2023
OpenAnolis - April 7, 2023

212 posts | 13 followers
Follow Application Real-Time Monitoring Service
Build business monitoring capabilities with real time response based on frontend monitoring, application monitoring, and custom business monitoring capabilities
Learn More Real-Time Livestreaming Solutions
Stream sports and events on the Internet smoothly to worldwide audiences concurrently
Learn More Managed Service for Prometheus
Multi-source metrics are aggregated to monitor the status of your business and services in real time.
Learn More CloudMonitor
Automate performance monitoring of all your web resources and applications in real-time
Learn MoreMore Posts by Alibaba Cloud Native