By Jing Yang from Alibaba's Xianyu technical team.
The production and deployment environments propping up Alibaba's second-hand exchange platform of Xianyu are becoming increasingly complex as the platform grows in popularity. This increase in complexity can be seen both in terms of the horizontal and vertical scaling of all of the inner workings of Xianyu's IT infrastructure. However, with this growth in popularity and complexity, of course, comes great challenges for the technical support team at Xianyu.
Just consider this. It is quite a challenge to locate the root cause of service issues in a timely manner, when there's millions upon ten millions of data records being pushing through the system at any given time. Well, when using the conventional methods, it would easily take something over 10 minutes to locate the causes of service problems given the massive size of the system. To tackle on this challenge head on, the technical team behind Xianyu has created a fast and automatic diagnosis system. The system to support all of this is a high-performance and real-time data processing system.
This real-time data processing system is equipped with the following capabilities:
In this article, we will look at how these capabilities allow for the system to handle tens of millions of data records every second in real time.
To gain a better grasp of the system and how it works, it's important to clarify first what exactly are the system inputs and outputs.
First, the system's inputs include the following: First there's request logs, including the traceID, timestamp, client IP address, server IP address, consumed time, return code, service name, and method name. Then, there's also the environment monitoring data, which includes the indicator name, IP address, timestamp, and indicator value, which may be (for example, the CPU, number of Java Virtual Machine (JVM) garbage-collections (GCs), JVM consumed time (GC), and database indicators).
Now, let's discuss the system outputs: Outputs include the root causes of service errors within a time period. A directed acyclic graph (DAG) is used to display the error analysis result of each service error. The root node is the analyzed error node, while the left nodes are the error root cause nodes. A leaf node may be an externally dependent service error or a Java Virtual Machine (JVM) exception.
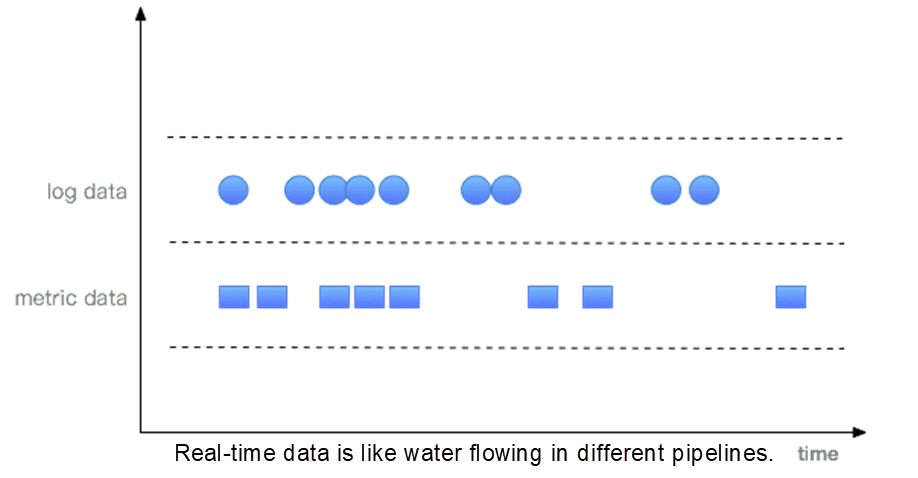
Now let's dive into the architecture design of the system. When the system is up and running, logs and monitoring data are constantly generated every minute and second. Each data record has its own timestamp. The real-time transmission of such data in a lot of ways can be understood as being like water flowing in different pipelines.

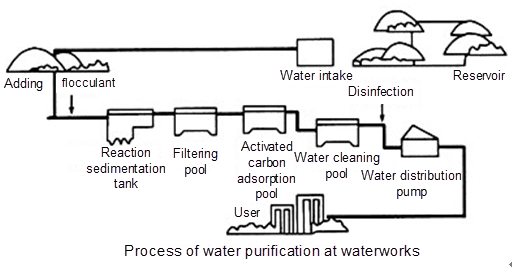
If the continuous flow of real-time data is compared to pipelining, data processing is similar to tap water production. Consider the following graphic:

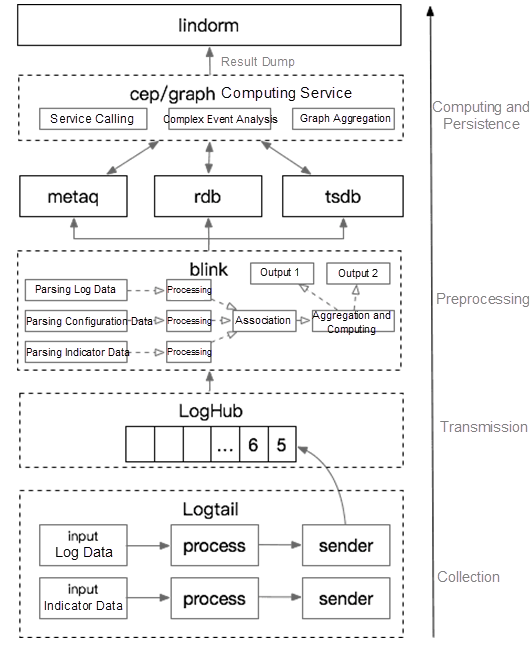
We can classify real-time data processing into the phases of collection, transmission, preprocessing, computing, and storage.
The following figure shows the overall system architecture design.

For the collection phase and processes, Xianyu's technical architecture uses Alibaba Cloud's Log Service, which includes the Logtail and LogHub components. Xianyu selects Logtail as its collection client because Logtail features the benefits of high performance, high reliability, as well as the flexible plug-in extension mechanism. Xianyu can customize its own collection plug-ins to collect various data in a timely manner.
LogHub can be regarded as a data release and subscription component and has similar functions to Kafka. However, LogHub is a more stable and secure data transmission channel than Kafka.
For the preprocessing part, Blink, that is a processing component of Alibaba Cloud's StreamCompute, which works to preprocess real-time data. It is Alibaba Cloud's enhanced version of Flink which is open source. Some other open-source StreamCompute products include JStorm, SparkStream, and Blink. Of these, Blink is the most appropriate for this process as it has an excellent status management mechanism to ensure real-time computing and provides complete SQL statements to ensure easier stream computing.
After data is preprocessed, call link aggregation logs and host monitoring data are generated. Then, all of this host monitoring data is stored in a time series database (TSDB) for subsequent statistical analysis. Because of the special storage structure design of this kind of database for time indicator data, the TSDB is specifically suitable for storing and querying time series data. The call link aggregation logs are provided to the complex event processing (CEP) or graph service to analyze the diagnosis model. The CEP or graph service is a Xianyu in-house developed and designed application for analyzing models, processing complex data and exchanging with external services. In addition, it uses a relational database to aggregate graph data in a timely manner.
The CEP or graph service analysis results are used as the graph data and dumped in Lindorm for online query. Lindorm is the enhanced HBase that is used for persistent storage in the system.
Logtail collects logs and indicator data. The following figure shows the overall collection process.

Logtail provides a flexible plug-in mechanism. There are four types of plug-ins:
The system must call the service interface on the local computer to obtain indicator data, such as CPU, memory, and JVM indicators. Therefore, the number of requests must be minimized for optimization purposes. In Logtail, an input occupies a goroutine. Xianyu customizes input and processor plug-ins to include indicator data (such as CPU, memory, and JVM indicators) into one input plug-in and obtain the data through one service request. The basic monitoring team provides the indicator acquisition interface. Then, Xianyu converts the obtained data into a JSON array object and splits it into multiple data records in the processor plug-in to reduce the number of I/O operations and improve the performance.
The transmission process is as follows: LogHub transmits data. Then, Logtail writes data, and Blink uses the data. For the entire process to work, you only need to set a proper number of partitions; the number of partitions must be greater than or equal to the number of concurrent tasks that Blink reads to prevent tasks that are running but not processing any data in Blink.
For the preprocessing part of the process, Blink is used for data preprocessing. Its design and optimizations are a bit more complicated. Let's discuss it in detail. Its design and optimizations can be broken up into five parts.
Blink is a stateful StreamCompute framework that is suitable for real-time aggregation, joining, and other operations.
When the application is runningh, you only need to pay attention to the calling of relevant service links in requests with errors. The entire log processing is classified into the following flows:

As shown in the preceding figure, the output is the complete link data with request errors after the two flows are joined.
When joining flows, Blink caches intermediate data based on the state and then matches data. If the state lifecycle is too long, the data can be large and the performance will be affected. If the state lifecycle is too short, delayed data may fail to be associated. Therefore, you always need to set a proper state lifecyle. The real-time data processing system allows a maximum data latency of one minute.
Use Niagara as the state backend and set the state lifecycle, in milliseconds.
state.backend.type=niagara
state.backend.niagara.ttl.ms=60000MicroBatch and MiniBatch are micro batch processing methods with different triggering mechanisms. In principle, they first cache data and then trigger data processing to reduce state accesses, improve the throughput, and compress the size of output data.
Enable joining.
blink.miniBatch.join.enabled=true
Retain the following minibatch configurations when MicroBatch is used.
blink.miniBatch.allowLatencyMs=5000
Set the maximum number of data records cached in each batch to prevent the out of memory (OOM) problem.
blink.miniBatch.size=20000When Blink runs tasks, some computing nodes may fail to be executed. To ensure dynamic data rebalancing, Blink writes data to subpartitions with a light load based on the number of buffers in each subpartition to implement dynamic load balancing. Compared with the static rebalancing policy, dynamic rebalancing enhances load balancing among different tasks and improves job performance when the computing capabilities of downstream tasks are unbalanced.
Enable dynamic rebalancing.
task.dynamic.rebalance.enabled=trueAfter data is associated, data on the request link needs to be sent to downstream graph analysis nodes as one data packet. In the past, the messaging service is used to transmit data. However, the messaging service has the following disadvantages:
1) Its throughput is about an order of magnitude smaller than in-memory databases, as are relational databases.
2) Data needs to be associated based on the traceID at the receiving end.
We use a custom a plug-in to write data to a relational database asynchronously and set the data expiration time. Data is stored in RDB as the data structure. When data is written to relational database, only the traceID is included in the message sent to the downstream computing service through the Metamorphosis (MetaQ), which greatly reduces the data transmission load of the MetaQ.
After receiving a notification from MetaQ, the complex event processing (CEP) or graph computing service node generates the real-time diagnosis result based on the requested link data and dependent environment monitoring data. The following figure shows the simplified diagnosis result:

The request is triggered by the full thread pool of the downstream JVM. However, a single call is not the root cause of service unavailability. Graph data needs to be aggregated in real time to analyze the error.
To illustrate the concept behind all of it, the aggregation design is simplified as follows:
(1) The Redis Zrank interface is used to allocate a globally unique sequence number for each node based on the service name or IP address.
(2) A graph node code is generated for each node in the preceding figure. The code format is as follows:
For the head node: Head node number|Normalization timestamp|Node code
For the common node: |Normalization timestamp|Node code
(3) Because each node has a unique key in a time period, the node code is used as the key and use Redis to count each node. The concurrent read/write problem is also resolved.
(4) The Redis is used to set overlay graph edges.
(5) The root node is recorded to restore the aggregated graph structure through traversal.
The following figure shows the aggregation result:

Through this process, the general cause of service unavailability is generated, and the root cause can be sorted by counting the number of leaf nodes.
After the system goes online, the whole real-time data processing link has a latency of less than three seconds. Now, the Xianyu server takes less than five seconds to locate a problem, greatly improving the problem location efficiency.
Currently, this newly implemented system enables Xianyu to process tens of millions of data records per second. In the future, the automatic problem location service will be applied to more business scenarios within Alibaba. Also, the data volume will be multiplied, which imposes higher requirements on efficiency and cost.
Moreover, in the future, we may make the following improvements:
Unified Application Framework for Larger-scale Apps: Alibaba's Fish Redux Moves to Open Source
How Xianyu Doubled Its CTR through a Non-Invasive and Scalable IFTTT System

56 posts | 4 followers
Followdigoal - May 28, 2019
Alibaba Cloud MaxCompute - December 6, 2021
Alibaba Clouder - November 19, 2019
Alibaba Clouder - November 20, 2019
Alibaba Cloud Native Community - August 7, 2025
Alibaba Cloud MaxCompute - September 12, 2018

56 posts | 4 followers
Follow Storage Capacity Unit
Plan and optimize your storage budget with flexible storage services
Learn More Simple Log Service
An all-in-one service for log-type data
Learn More Hybrid Cloud Storage
A cost-effective, efficient and easy-to-manage hybrid cloud storage solution.
Learn More Hybrid Cloud Distributed Storage
Provides scalable, distributed, and high-performance block storage and object storage services in a software-defined manner.
Learn MoreMore Posts by XianYu Tech