Bolster the growth and digital transformation of your business amid the outbreak through the Anti COVID-19 SME Enablement Program. Get a $300 coupon package for all new SME customers or a $500 coupon for paying customers.
By Lingsheng from Alibaba Cloud Storage
In early February this year, Alibaba Cloud Log Service (SLS) launched an application that dynamically displays and analyzes coronavirus disease (COVID-19) statistics in mainland China. At present, this application is fully open to governments, communities, third-party platforms, and developers for widespread use free of charge.
If you want to learn more about the COVID-19 pandemic analysis application, please visit the following article: Alibaba Cloud documentation of the COVID-19 pandemic analysis application
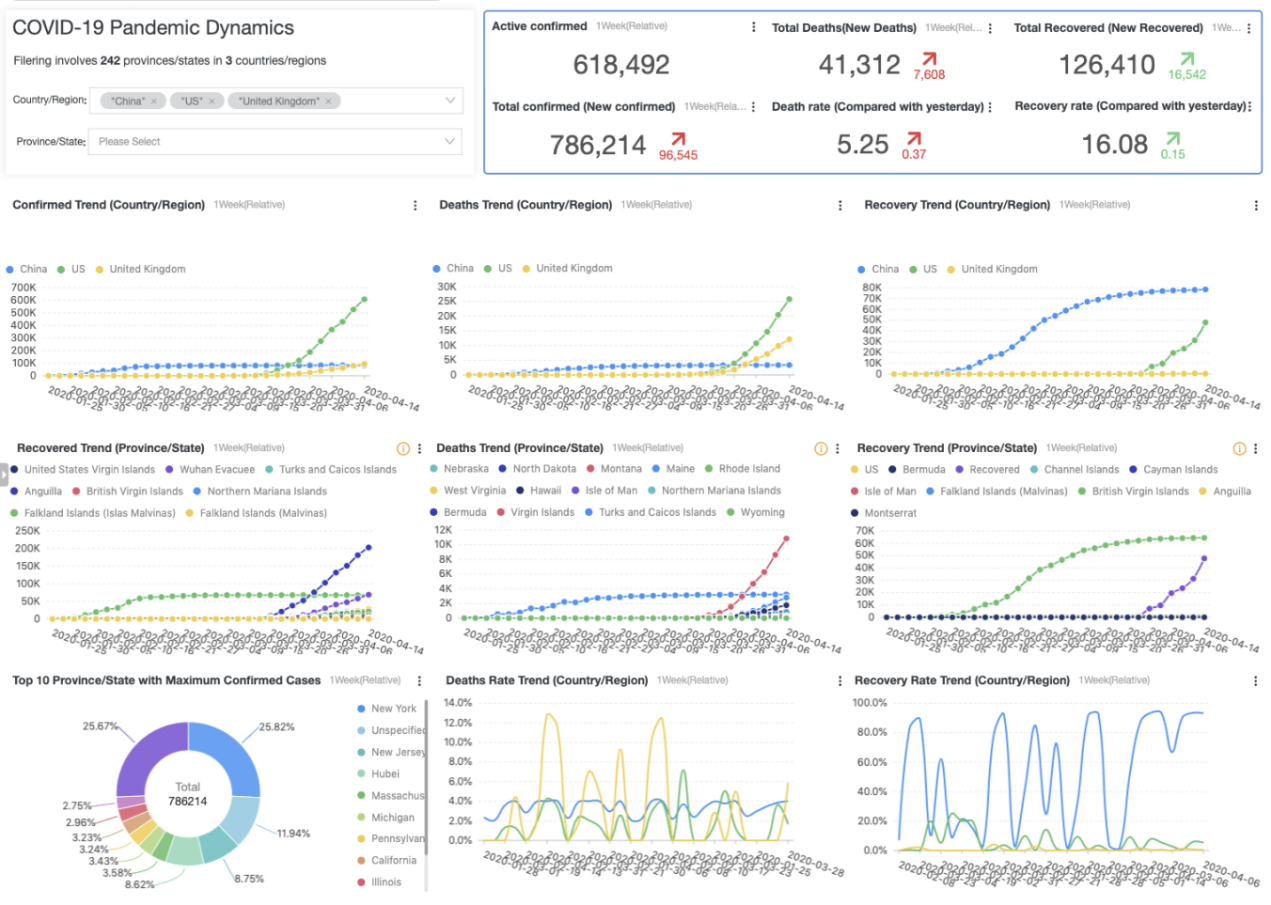
With the outbreak of COVID-19 around the world, SLS recently released a new feature that tracks and analyzes the pandemic outbreak situation around the globe through a dashboard. Compared with the dashboard that displays the pandemic statistics in mainland China with data sources from CCTV News, People's Daily, and the announcements of the provincial and municipal health committees of China, the global pandemic analysis dashboard tracks and focuses on the outbreak situation around the world. The data used by the global dashboard comes from the open-source data sets provided by the Center for Systems Science and Engineering (CSSE) of Johns Hopkins University, which is widely referenced all over the world.
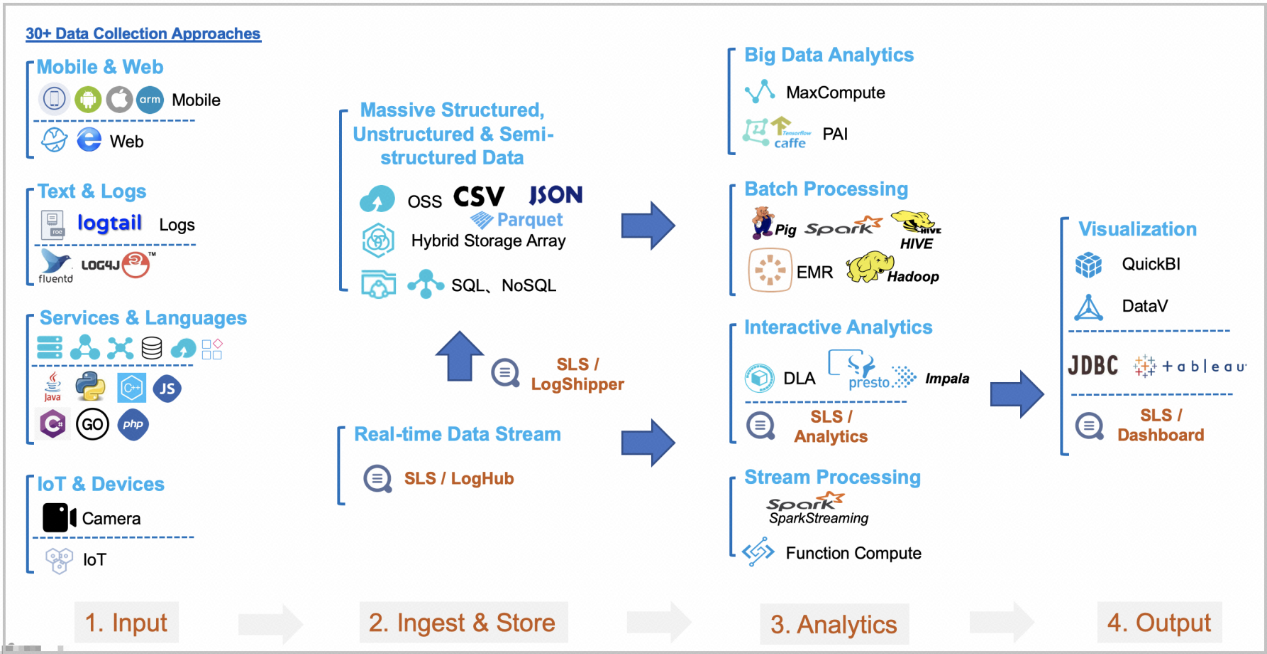
As a comprehensive logging service provided by Alibaba Cloud, SLS is designed to process log data. This service allows you to conveniently collect, consume, ship, query, and analyze large amounts of log data without the need for extra code resources. It helps improve your operation and maintenance (O&M) efficiency. SLS provides features such as real-time data collection, consumption, shipping, query, and analysis. It facilitates real-time monitoring, and is applicable to development, O&M, operations, and the security control of data warehouses and other systems.
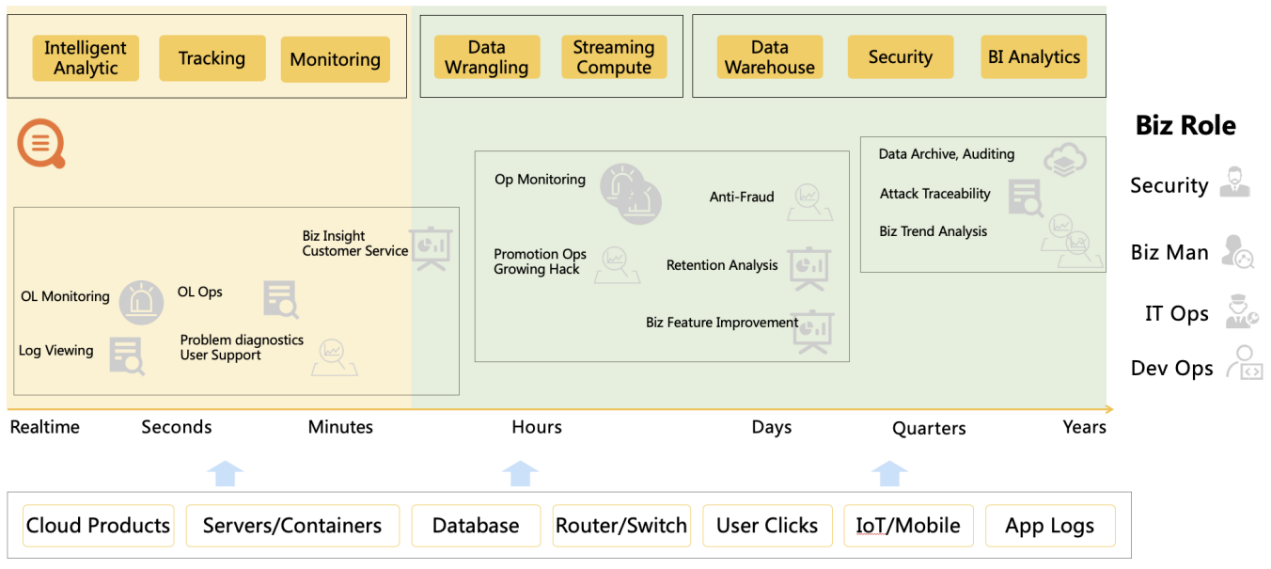
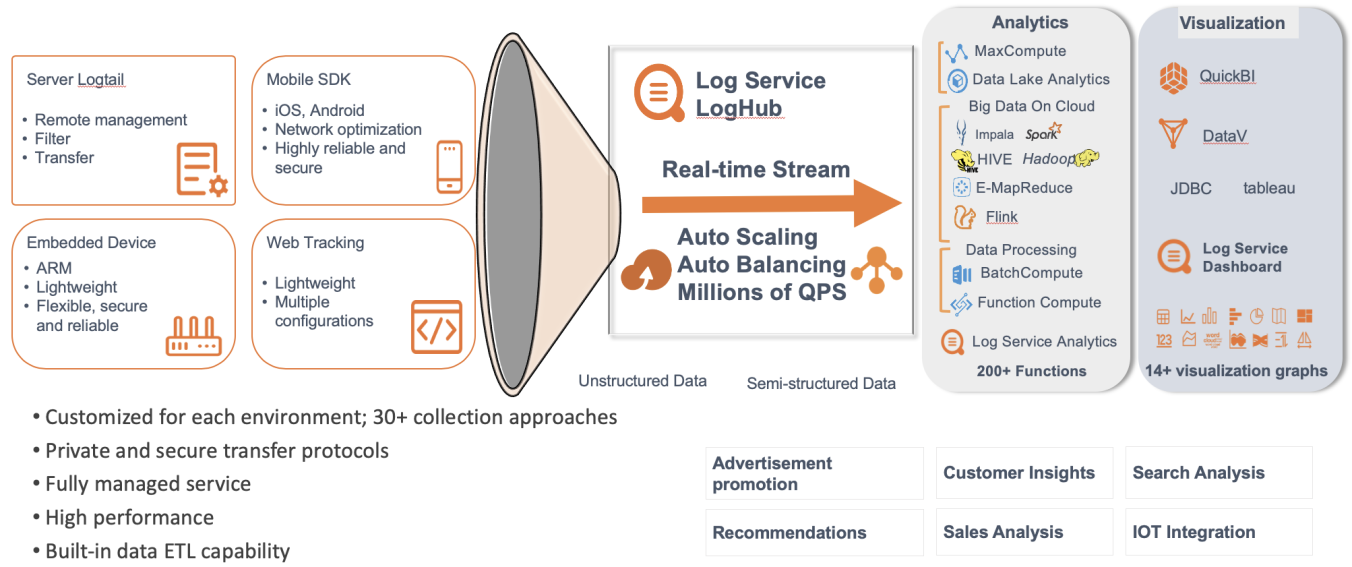
As the log analysis mid-end, SLS provides an all-in-one service that supports data collection, processing, query, analysis, artificial intelligence (AI)-based computing, and visualization. It can also be integrated with other services.
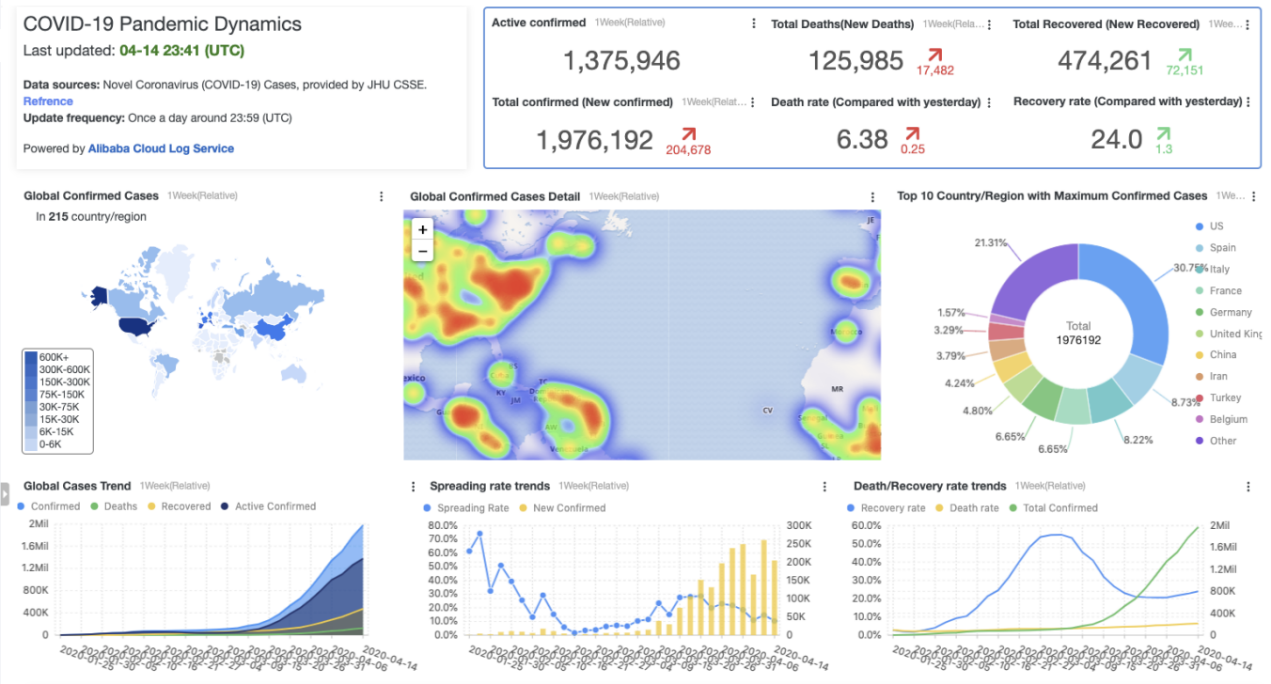
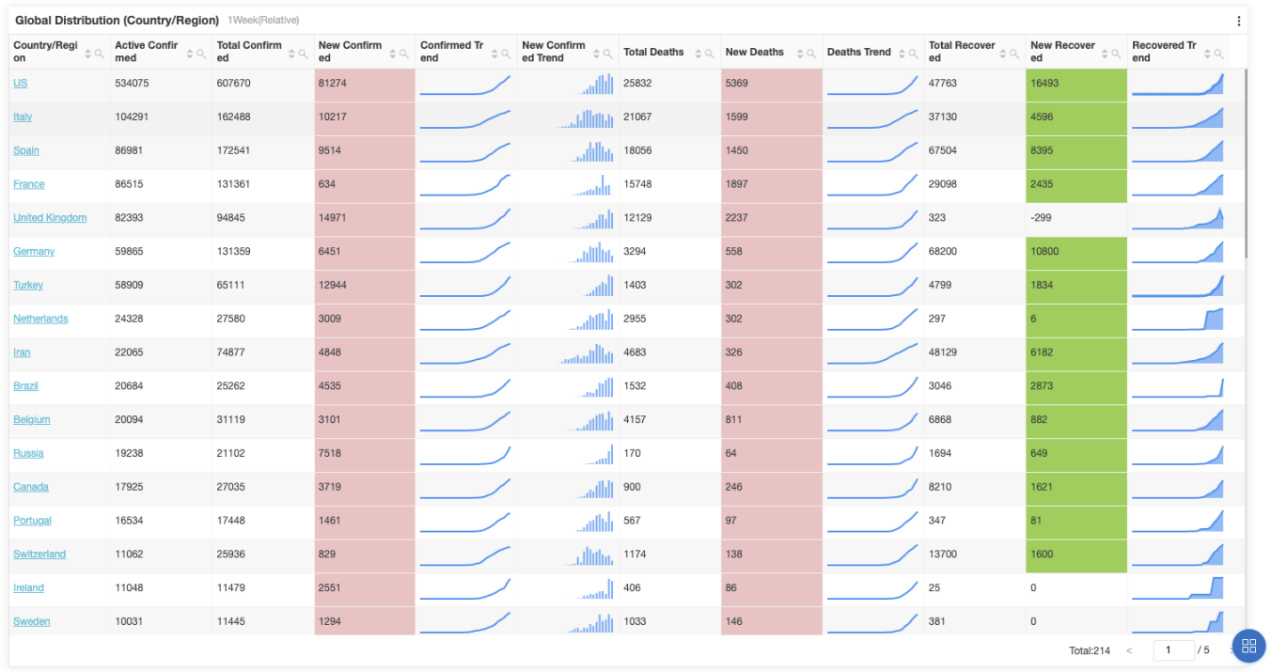
SLS collects and standardizes pandemic-related data, and regularly updates the data every day. It covers the statistics of all affected countries, regions, provinces, and states, and displays the statistics in a visualized way. With SLS, you only need to focus on data analysis and display, while SLS handles other tedious tasks for you.
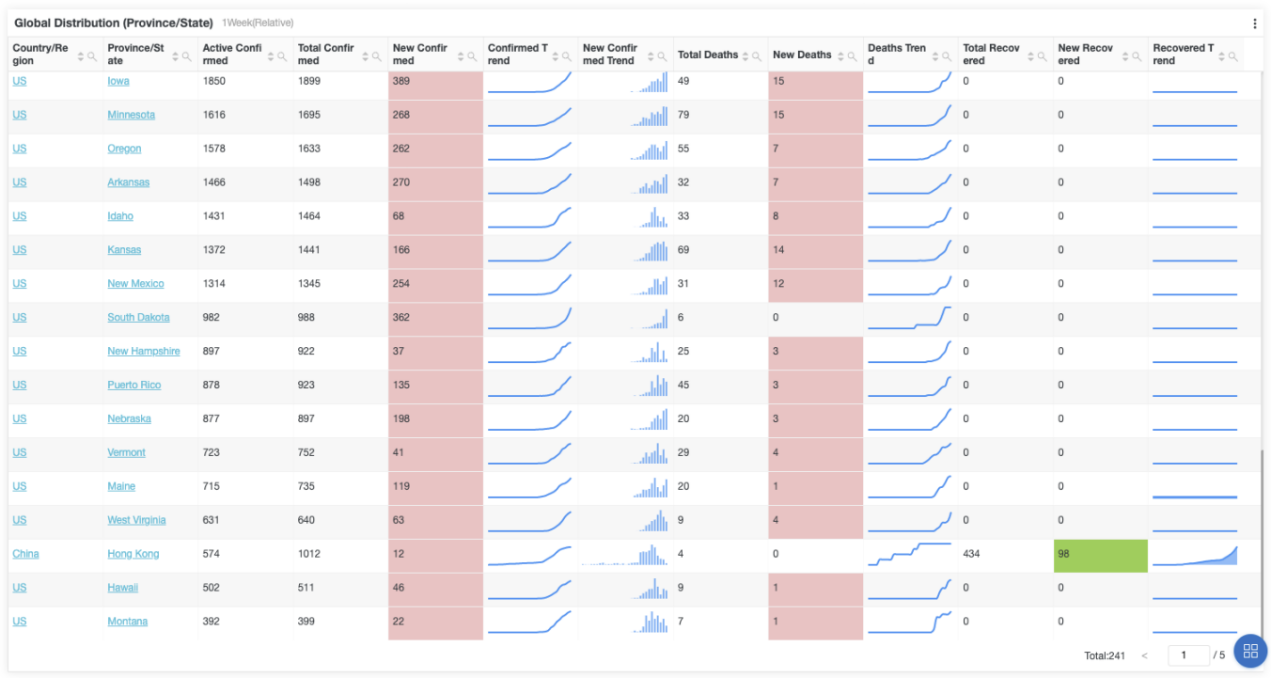
The global dashboard provides multiple types of charts and allows you to customize the display of the countries, regions, provinces, or states of which the pandemic trends you want to know. You can also perform interactive queries and analysis, and configure drill-down or drill-up events and alerts.
SLS can be integrated with other systems, third-party applications, and open-source platforms in different environments. It provides data analysis, storage, and visualization features that are extensible. For example, SLS can collect data from DataV, Blink, Object Storage Service (OSS), Realtime Compute, Grafana, and Secure Operations Center (SOC).
Pandemic-related services, applications, and data provided by SLS are completely free, including dashboards and alerts.
Some people may want to try analyzing the COVID-19 pandemic data by themselves, but do not know much about how to obtain data from various data sources and process it. Or, maybe they are not very familiar with how to run SQL statements with SLS. To help these people analyze the pandemic data in a convenient and easy way, SLS collects and standardizes the data, and regularly updates it every day. With SLS, you only need to focus on data analysis and display, while SLS handles other tedious tasks for you.
type:  Country/Region Cases
version:  v2020-04-17T11:55:36
Last Update:  2020-04-09 01:12:20
Country/Region:  China
Country/Region (ch): 中国
LatLng:  35.000074,104.999927
Confirmed:  83798
Confirmed Hist:  [644, 923, 1409, 2079, 2882]
Confirmed Trend:  {"2020-01-23": 644, "2020-01-24": 923, "2020-01-25": 1409, "2020-01-26": 2079, "2020-01-27": 2882}
New Confirmed Hist:  [95, 279, 486, 670, 803]
New Confirmed Trend:  {"2020-01-23": 95, "2020-01-24": 279, "2020-01-25": 486, "2020-01-26": 670, "2020-01-27": 803}
Deaths:  3352
Deaths Hist:  [18, 26, 42, 56, 82]
Deaths Trend:  {"2020-01-23": 18, "2020-01-24": 26, "2020-01-25": 42, "2020-01-26": 56, "2020-01-27": 82}
Recovered:  78556
Recovered Hist:  [30, 36, 39, 49, 58]
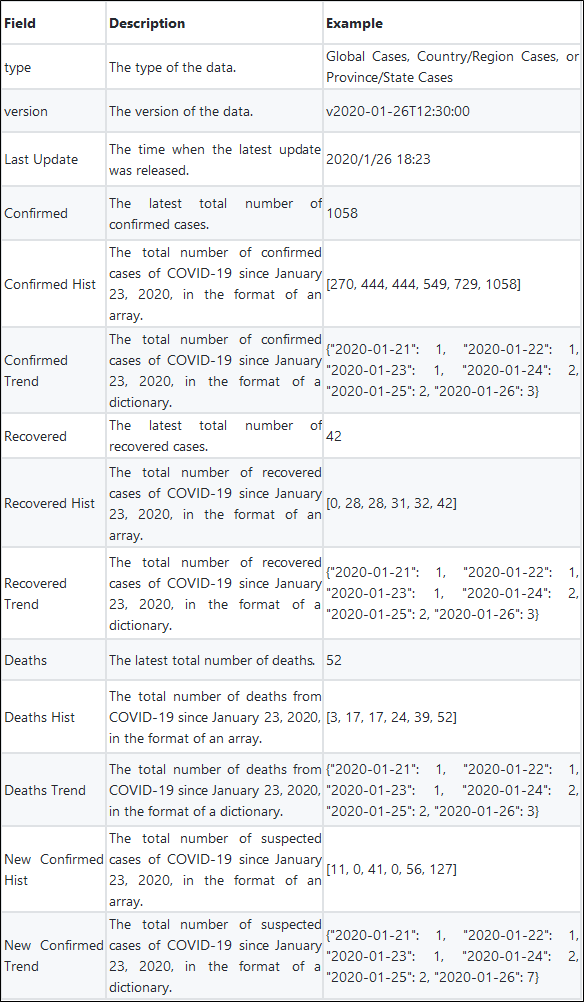
Recovered Trend: {"2020-01-23": 30, "2020-01-24": 36, "2020-01-25": 39, "2020-01-26": 49, "2020-01-27": 58}The pandemic data is stored in the ncp Logstore. Different types of data are identified based on the type field values, including Global Cases, Country/Region Cases, and Province/State Cases. Data versions are identified by the version field. Each version contains complete data, which can be used for data corrections.
The following table lists the data fields.
SLS provides the capabilities of searching and analyzing massive logs in real time, which have the following advantages:
As mentioned above, SLS uses the version field to mark the version of the COVID-19 pandemic data. To query the data of the latest version, you can run the following SQL statement:
type : "Province/State Cases" | select .... from log l right join (select max(version) as version from log) r on l.version = r.versionIn the predefined charts, each chart corresponds to a SQL query result. Take the chart named Global Cases Trend, which displays global COVID-19 cases, as an example. You can run the following SQL statement to query the globally confirmed cases, deaths, recoveries, and the trend of existing cases, and save the result as a chart in the dashboard, which is convenient and quick.
type : "Global Cases" | select date_format(date_parse(l.a, '%Y-%m-%d'), '%b %e') as "Date", l.b as "Confirmed", l.b - r2.b - r6.b as "Active Confirmed", r2.b as "Deaths", r6.b as "Recovered" from (select a,b from log l right join (select max(version) as version from log) r on l.version = r.version, unnest( cast( json_parse("Confirmed Trend") as map(varchar, bigint) ) ) as t(a,b)) l left join (select a,b from log l right join (select max(version) as version from log) r on l.version = r.version, unnest( cast( json_parse("New Confirmed Trend") as map(varchar, bigint) ) ) as t(a,b)) r on l.a = r.a left join (select a, b from log l right join (select max(version) as version from log) r on l.version = r.version, unnest( cast( json_parse("Deaths Trend") as map(varchar, bigint) ) ) as t(a, b)) r2 on l.a = r2.a left join (select a, b from log l right join (select max(version) as version from log) r on l.version = r.version, unnest( cast( json_parse("Recovered Trend") as map(varchar, bigint) ) ) as t(a, b)) r6 on l.a = r6.a order by l.aLog on to the Alibaba Cloud Log Service (SLS) console and find the application of COVID-19 pandemic analysis in the Log Application section.
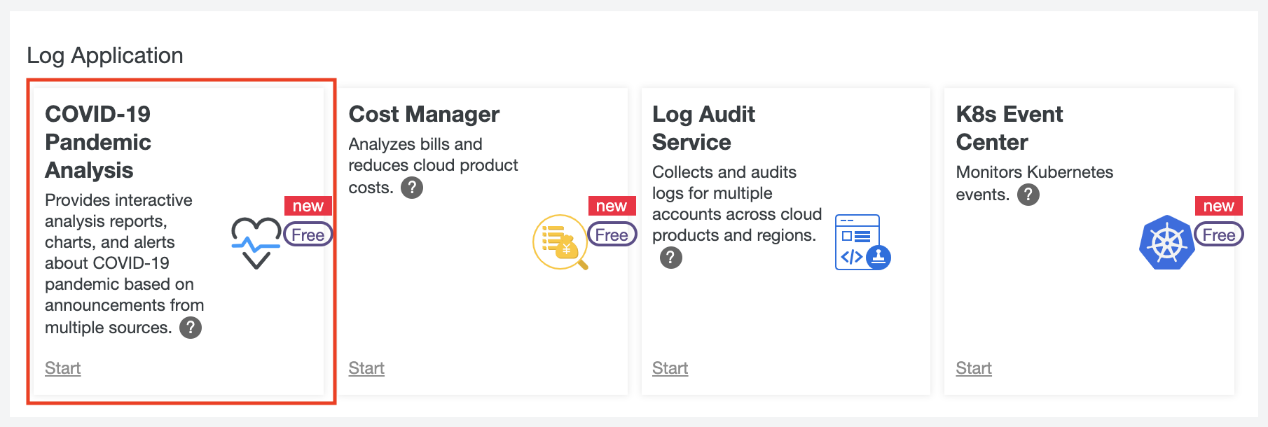
Click the application and configure it. You only need to configure the application once, and data will be automatically synchronized after the configuration. After you complete the configuration, the multiple types of charts provided by SLS as well as the features of interactive analysis and visualization become available for you.
While continuing to wage war against the worldwide outbreak, Alibaba Cloud will play its part and will do all it can to help others in their battles with the coronavirus. Learn how we can support your business continuity at https://www.alibabacloud.com/campaign/fight-coronavirus-covid-19
Alibaba Achieves Largest 3Q19-4Q19 Revenue Change in Application Delivery Controllers Worldwide

2,593 posts | 794 followers
FollowAlibaba Cloud Project Hub - November 16, 2021
Alibaba Clouder - April 3, 2020
Alibaba Clouder - April 23, 2020
Alibaba Clouder - April 16, 2020
Alibaba Clouder - July 15, 2020
Alibaba Clouder - June 17, 2021

2,593 posts | 794 followers
Follow Simple Log Service
An all-in-one service for log-type data
Learn More Data Lake Storage Solution
Build a Data Lake with Alibaba Cloud Object Storage Service (OSS) with 99.9999999999% (12 9s) availability, 99.995% SLA, and high scalability
Learn More Quick BI
A new generation of business Intelligence services on the cloud
Learn More Storage Capacity Unit
Plan and optimize your storage budget with flexible storage services
Learn MoreMore Posts by Alibaba Clouder