With the booming development of mobile smart devices, a mobile multi-terminal development framework has become a general trend. Download the Flutter Analysis and Practice: Evolution and Innovation of Xianyu Technologies eBook for step-by-step analyses based on real-life problems, as well as clear explanations of the important concepts of Flutter.
Flutter pages of Xianyu have served hundreds of millions of users, and it is essential to ensure the user experience of Flutter pages. Improving the Flutter performance and stability monitoring system helps detect online performance problems as early as possible and improve user experience. How is the performance of Flutter? Is it as smooth as it claims? Can the native performance metrics be used to detect Flutter pages? We will share the Flutter performance stability monitoring solution summarized from the practices of Xianyu.
Excessive frame dropping may result in visual lags and jerky sliding operations. It takes a long time to load the page and the operation process may be interrupted. Upon some exceptions in Flutter, the logic after the exception code is not implemented, causing a logical bug or a white screen. These problems can easily cause impatience and dissatisfaction for users.
Therefore, Xianyu has formulated the following three metrics as the performance stability criteria for online Flutter:
All of these metrics are designed to improve the Flutter user experience.
The CPU first converts UI objects into information that can be recognized by the GPU and stores the information in the displaylist. The GPU then runs the rendering command to extract the corresponding element information from the displaylist for grid rendering and display on the screen. This cyclical process is called screen rendering.
In the native-Flutter hybrid solution adopted by the Xianyu client, the high-availability solution of Alibaba Group is used for FPS monitoring of native pages. Can this solution be directly used for Flutter pages?
In the general FPS detection solution, the Android client uses Choreographer.FrameCallBack and the iOS client uses the callback registered by CADisplayLink. The principles are similar. Each time the VSync signal is sent, the CPU starts computing. When the corresponding callback is executed, the screen starts to refresh. The number of screen renderings in a fixed period of time is the FPS. This method can only detect CPU lagging but not GPU lagging. Both methods detect problems in the main thread. The Flutter screen rendering is performed in the UI TaskRunner, whereas the real rendering operation is performed in the GPU TaskRunner.
This means that the native FPS detection method is not suitable for Flutter.
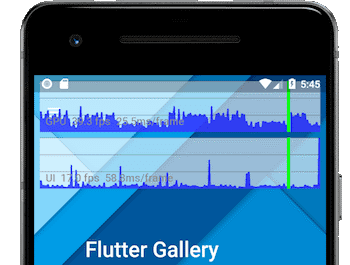
Flutter officially provides Performance Overlay as a frame rate detection tool, as shown in Figure 4-6.

Figure 4-6
Figure 4-6 shows the frame rate statistics in Performance Overlay mode. Flutter calculates the frame rates by GPU TaskRunner and UI TaskRunner separately. The UI TaskRunner is used by the Flutter Engine to execute Dart root isolate code, and the GPU TaskRunner is used to execute GPU-related calls. According to the analysis of the Flutter Engine source code, the UI frame time indicates the total time spent in executing window.onBeginFrame, while the GPU frame time indicates the time spent in converting CPU commands into GPU commands and sending them to GPUs.
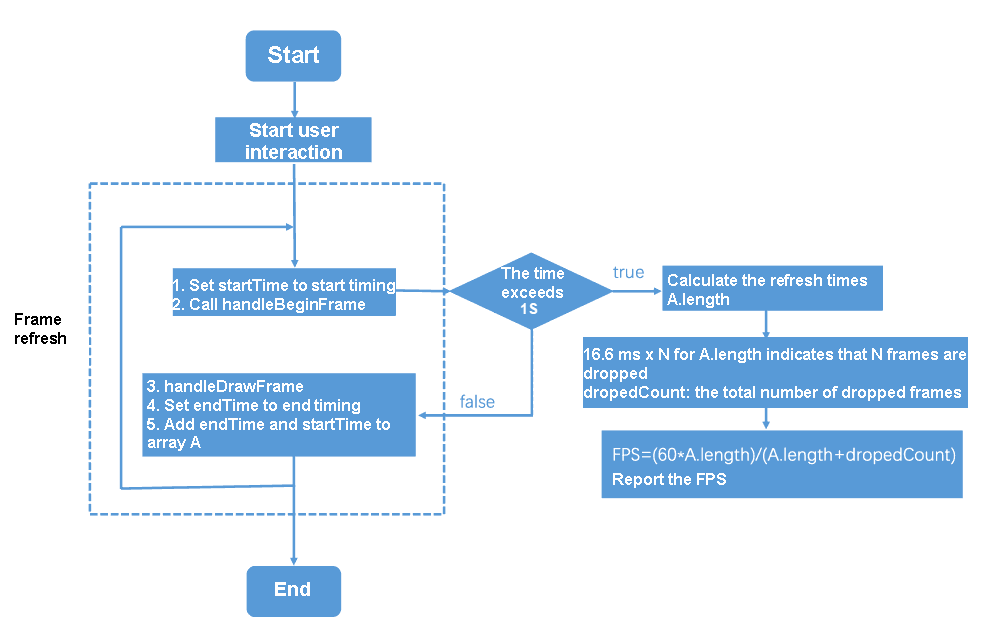
This method can be enabled only in Debug and Profile modes and cannot be used for online FPS statistics. However, you can call back handleBeginFrame() and handleDrawFrame() through the Flutter listening page to calculate the actual FPS.
Register the WidgetsFlutterBinding listening page, and call back handleBeginFrame() and handleDrawFrame().
handleBeginFrame: Called by the engine to prepare the framework to produce a new frame.
handleDrawFrame: Called by the engine to produce a new frame.
Calculate the frame rate according to the time interval between handleBeginFrame and handleDrawFrame, as shown in Figure 4-7.

Figure 4-7
Here, we have completed the statistics of the page frame rate in Flutter. This method collects statistics on the CPU operation time in the UI TaskRunner. Since GPU lagging does not occur in most of our scenarios, the problems are mainly in the CPU. Therefore, the statistics can reflect most of the problems. According to online data, Flutter runs smoothly in Release mode. The average FPS remains above 50 on major iOS pages, while it is slightly lower on Android pages. Note that the average FPS of the frame rate is affected by repeated sliding. As a result, some lag problems are not exposed. Therefore, in addition to the average FPS, the frame dropping range, lagging seconds, and sliding duration are required to reflect the smoothness.
The high-availability solution of Alibaba Group is used to collect statistics on the loading time of native pages, as shown in Figure 4-8. Through container initialization, the timer is started to check the screen rendering level and calculate the screen coverage rate of visible components during the container layout. As long as the horizontal coverage rate exceeds 60% and the vertical coverage rate exceeds 80%, the page filling level is reached. Then, the heartbeat of the main thread is checked to determine whether page loading is complete.

Figure 4-8
Figure 4-9 shows the Weex page loading process and definitions of statistics.

Figure 4-9
The page refresh stabilization time of Weex is the time required for the view rendering to complete and the view tree to become stable, as shown in Figure 4-10.
The add or remove operation of the view on the screen may be considered as an interaction point and data is recorded until the operation does not take place again.

Figure 4-10
The first meaningful paint and the interaction times have different meanings in Weex and Flutter. Flutter starts to calculate the duration from route redirection because this calculation method is closer to the user experience, and more information about the issues, such as the route redirection time, can be obtained.
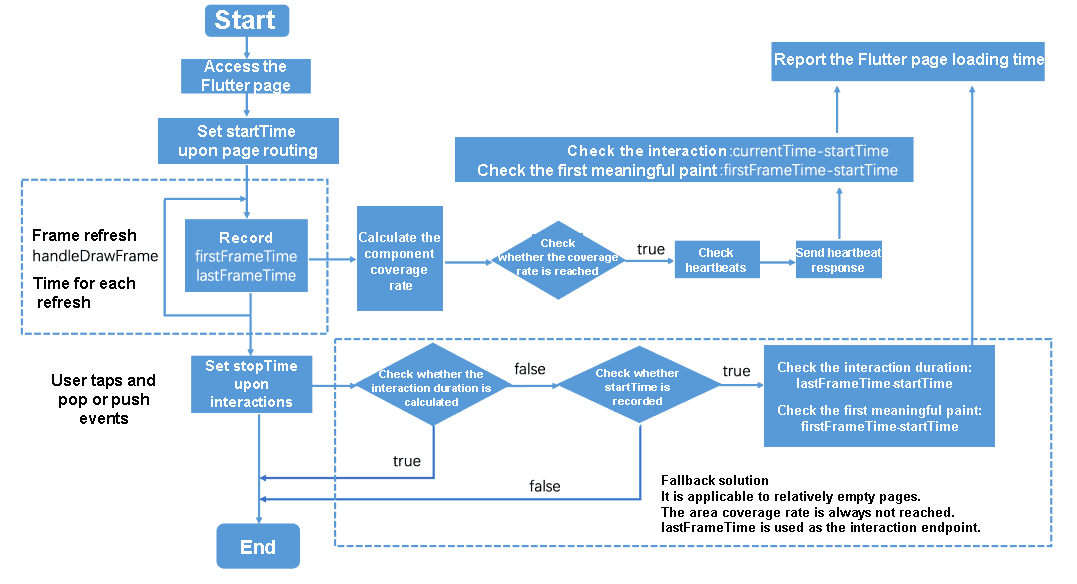
Flutter uses the same method to calculate the endpoint of the interaction duration as Native. Therefore, tasks are interactive when the components reach the page fill level and complete the heartbeat check. In addition, for some relatively empty pages, the horizontal coverage rate cannot exceed 60%, and the vertical coverage rate cannot exceed 80%, due to the small component area. Therefore, the last frame refresh time before the interaction is used as the endpoint.
Figure 4-11 shows the specific process.
Figure 4-11
JIT compilation is used in Debug mode. Therefore, the loading time in Debug mode is longer. However, in Release mode, the AOT compilation time is much shorter, and the overall page loading time is shorter than Weex.
Exceptions or errors in Flutter may cause the failure to run the subsequent code logic, resulting in page or logic problems. Therefore, the exception rate of Flutter is used as a stability metric.
Flutter exception rate = Number of exceptions/Flutter PV
Regarding the number of exceptions (with the whitelist filtered out), upon Flutter's internal assert, try-catch, and some exception logic, FlutterError.onError is called to monitor the number of exceptions by redirecting FlutterError.onError to corresponding methods, and report the exception information.
The Flutter PV is implemented:
Future<Null> main() async {
  FlutterError.onError = (FlutterErrorDetails details) async {
    Zone.current.handleUncaughtError(details.exception, details.stack);
  };

  runZoned<Future<Null>>(() async {
    runApp(new HomeApp());
  }, onError: (error, stackTrace) async {
    await _reportError(error, stackTrace);
  });
}
FlutterError.onError only captures the errors and exceptions at the Flutter framework layer. Officially, we recommend that you customize this method based on your requirements for capturing and reporting exceptions. In practice, many exceptions that have no impact on user experience are frequently triggered. You can add these exceptions to the whitelist to avoid reporting.
Online exception monitoring helps detect risks as early as possible and obtain problematic stack information, which facilitates problem locating and improves the overall stability.
Here, we have collected the Flutter page sliding smoothness, page loading time, and exception rate, which provide specific criteria for Flutter performance measurement, as well as a basis for user experience improvement and performance problem locating. Currently, the product details page and the main publishing page of the Xianyu client have been fully based on Flutter. You are free to experience the performance differences between the two pages and other pages.
Flutter Analysis and Practice: Design of the Statistical Framework
Flutter Analysis and Practice: Design and Practices of the High-Availability Framework

56 posts | 4 followers
FollowXianYu Tech - September 10, 2020
XianYu Tech - September 8, 2020
Alibaba Clouder - September 21, 2020
XianYu Tech - September 11, 2020
XianYu Tech - September 9, 2020
Alibaba Tech - April 24, 2020

56 posts | 4 followers
Follow mPaaS
mPaaS
Help enterprises build high-quality, stable mobile apps
Learn More Mobile Testing
Provides comprehensive quality assurance for the release of your apps.
Learn More Alibaba Cloud Flow
An enterprise-level continuous delivery tool.
Learn More DevOps Solution
Accelerate software development and delivery by integrating DevOps with the cloud
Learn MoreMore Posts by XianYu Tech