This article is taken from the Practices of Flink in iQiyi's Advertising Business by Han Honggen, Technical Manager of iQiyi, at Flink Meetup (Beijing) on May 22. The article includes the following sections:
GitHub address: https://github.com/apache/flink
Your support is truly appreciated.
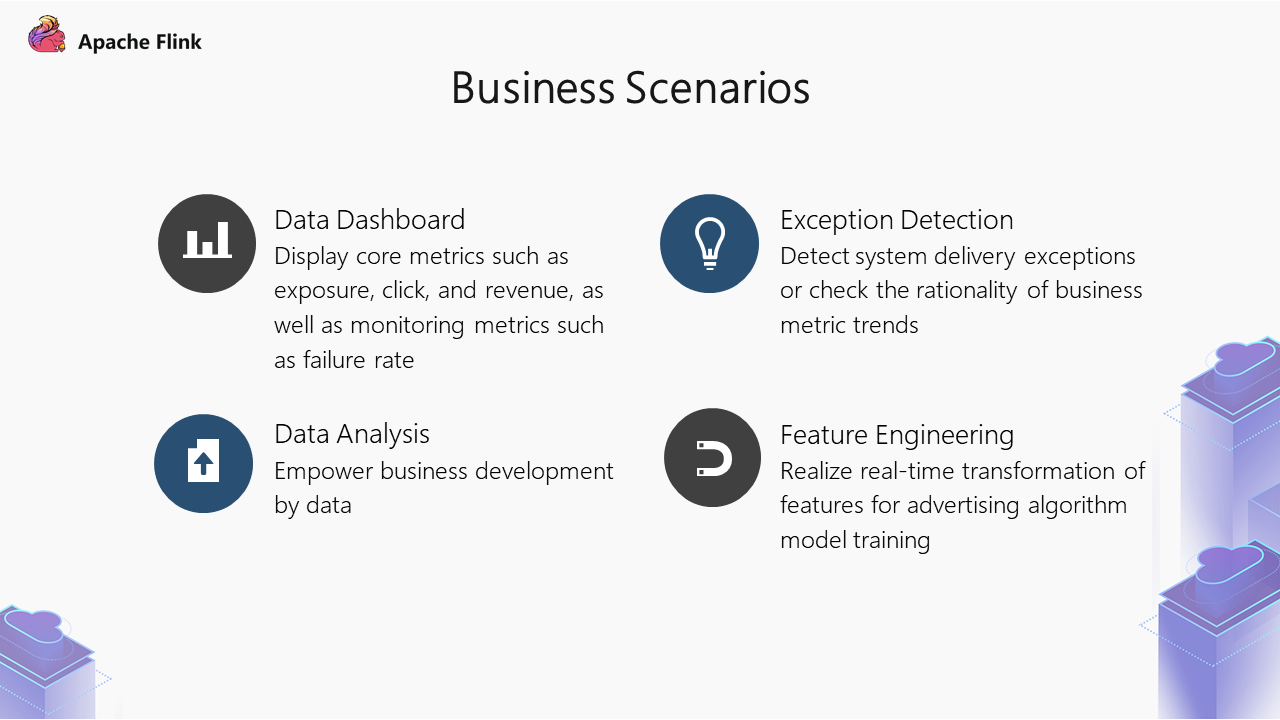
The use of real-time data in the advertising business can be divided into four main areas:
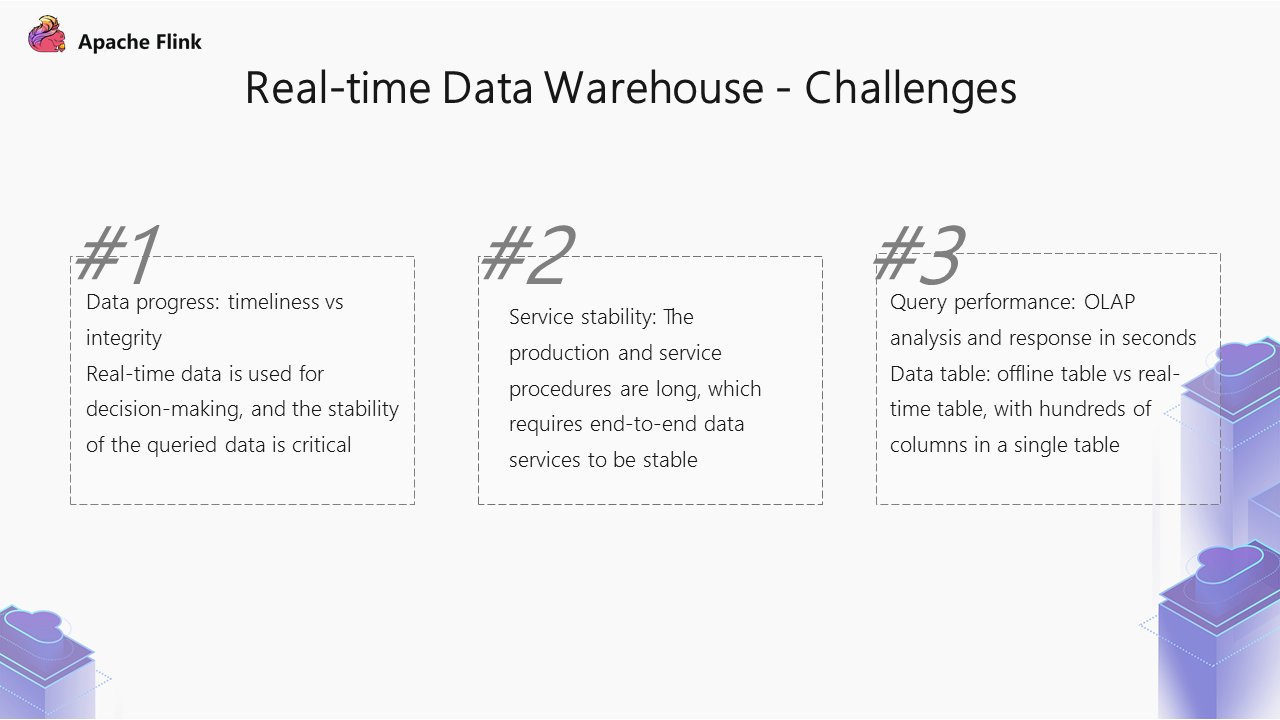
Business practices are mainly divided into two categories. The first is real-time data warehouses, and the second is feature engineering.
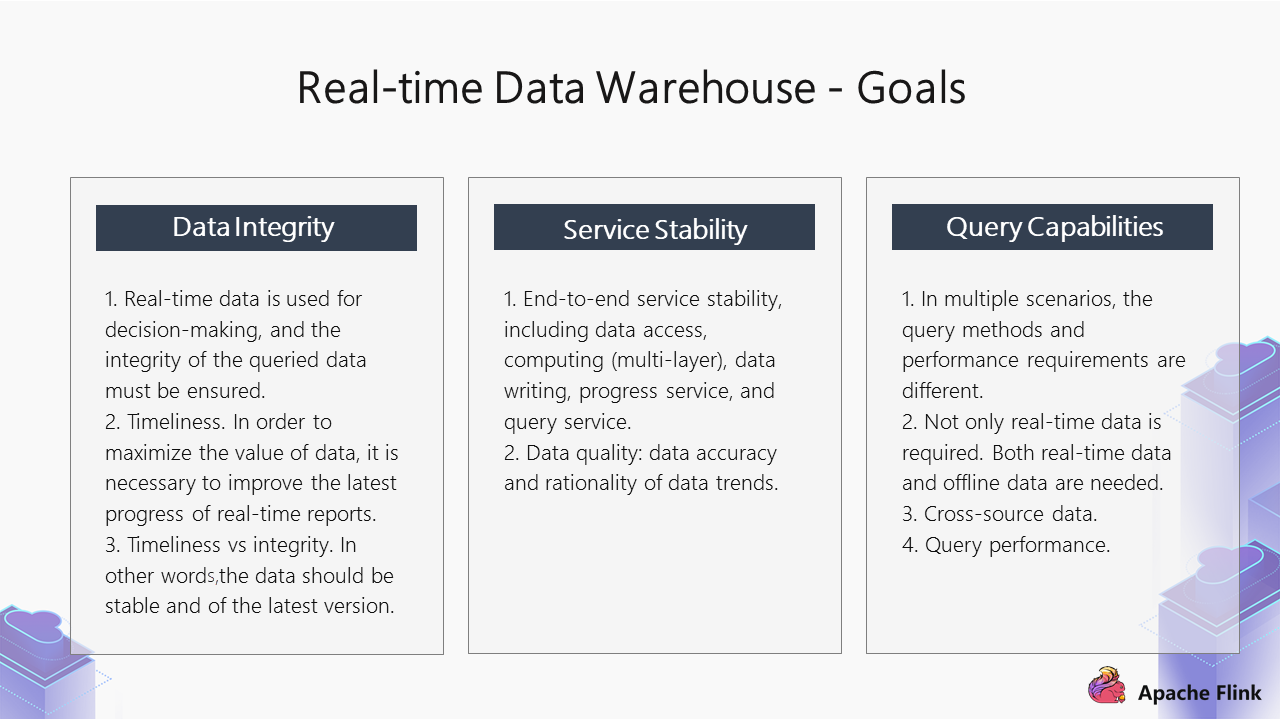
The goals of real-time data warehouses include data integrity, service stability, and query capabilities.
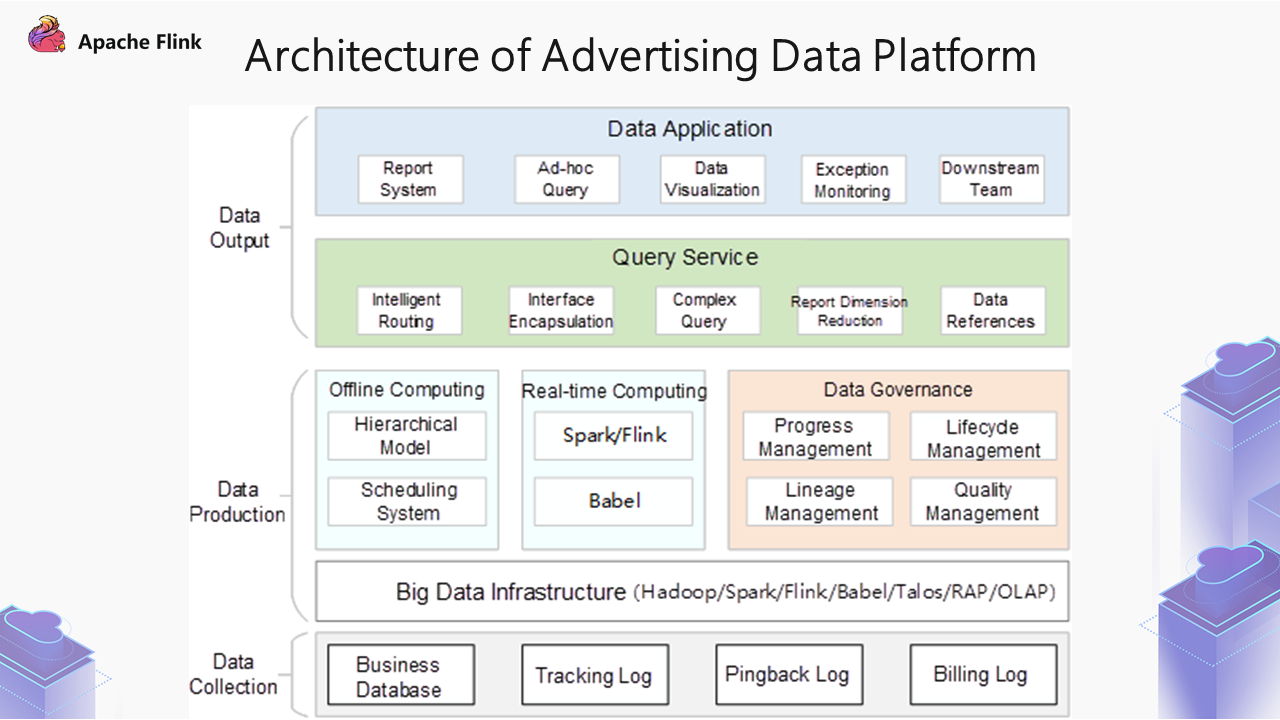
The figure above is the basic architecture diagram of the advertising data platform, which is viewed from bottom to top:
The advertising team uses services from the middle layer of data production, such as typical offline computing and real-time computing in production.
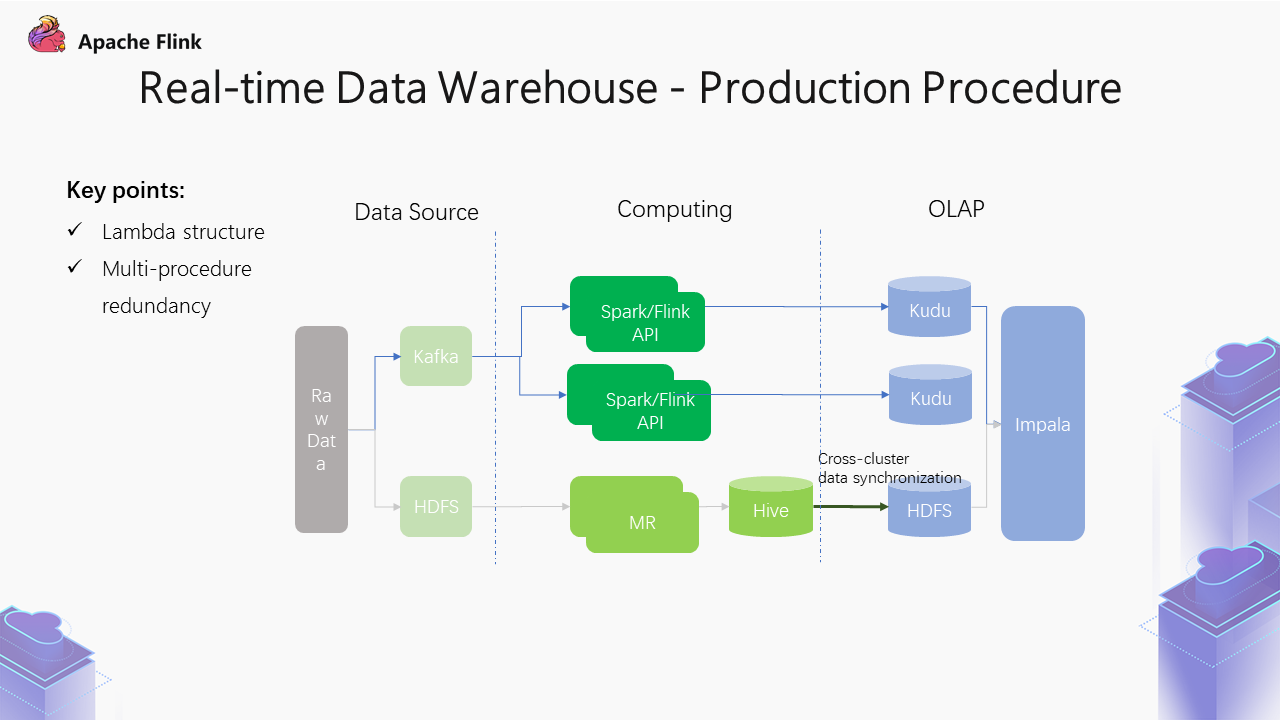
The data production procedure is based on time granularity. In the beginning, we used the offline data warehouse procedure. At the bottom layer, as the real-time demand advances, a real-time procedure is generated. Generally, it is a typical Lambda architecture.
In addition, we use the multi-procedure redundancy mode for some of our core metrics, such as billing metrics, because its stability is more critical to the downstream. First, the source logs are generated. Then, complete redundancy is made in the computing layer and the downstream storage layer. Lastly, unified processing is done in the subsequent queries. This process describes multi-procedure redundancy.
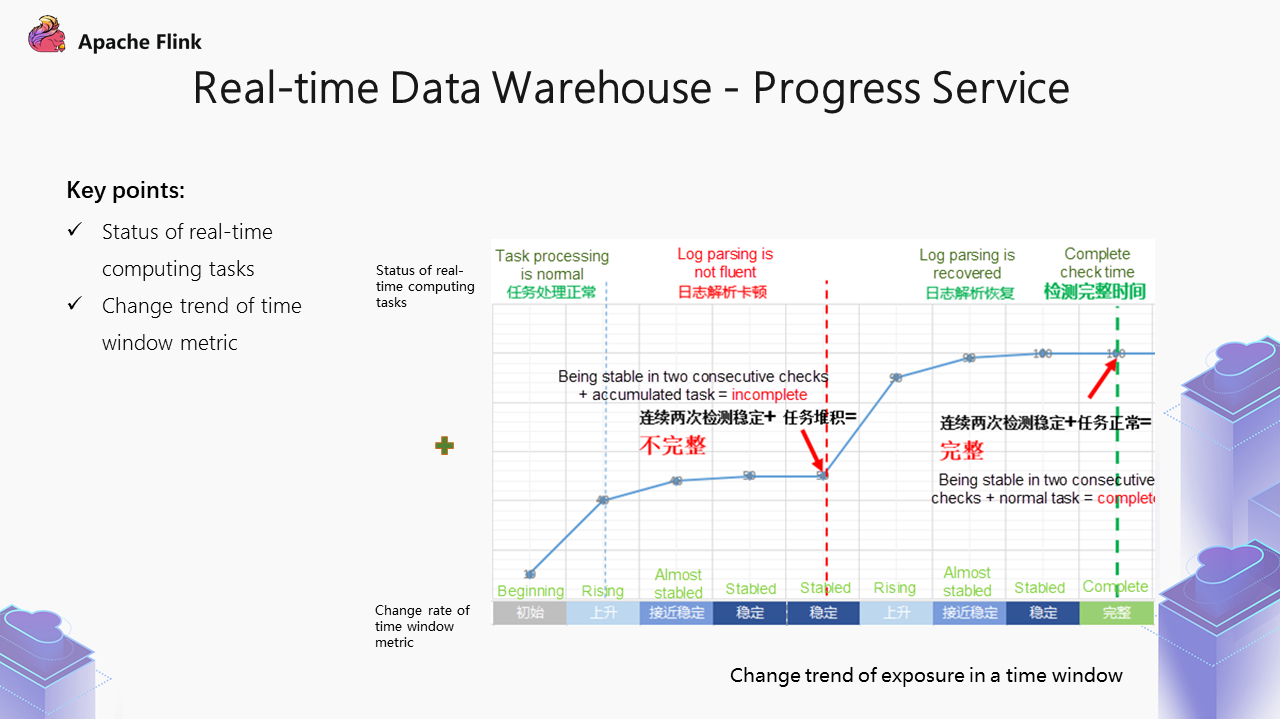
The preceding part describes how the metrics of the real-time data provided externally are stable and unchanging. The core point of the progress service implementation includes the changing trend of the metrics in the time window and the status of the real-time computing task. In the real-time data warehouse, many metrics are aggregated and computed based on the time window.
For example, we set a value of three minutes for a real-time metric. The metric at the time point of 4:00 includes the data from 4:00 to 4:03, and 4:03 includes the data from 4:03 to 4:06. It refers to the data in a time window that is visible to the public. In real-time computing, data keeps coming in, the data output in the time window of 4:00 starts from 4:00, and metric results have already begun to be generated. Over time, the metric result rises and finally stabilizes. We determine whether it stabilizes based on the rate of change of the time window metric.
However, if we determine only based on this, it still has certain drawbacks.
The computing procedure of this result table depends on many calculation tasks. If there is a problem with any task on this procedure, the current metric may not be complete, even though the trend has stabilized. Therefore, on this basis, we have introduced task status for real-time computing. When the metric tends to be stable, we can also see whether these computing tasks on the production procedure are normal. If so, the metric at the time point of the task itself has been stable and can provide services to the outside world.
If the computing task is stuck, piled up, or restarted due to exceptions, we need to wait for iteration processing.
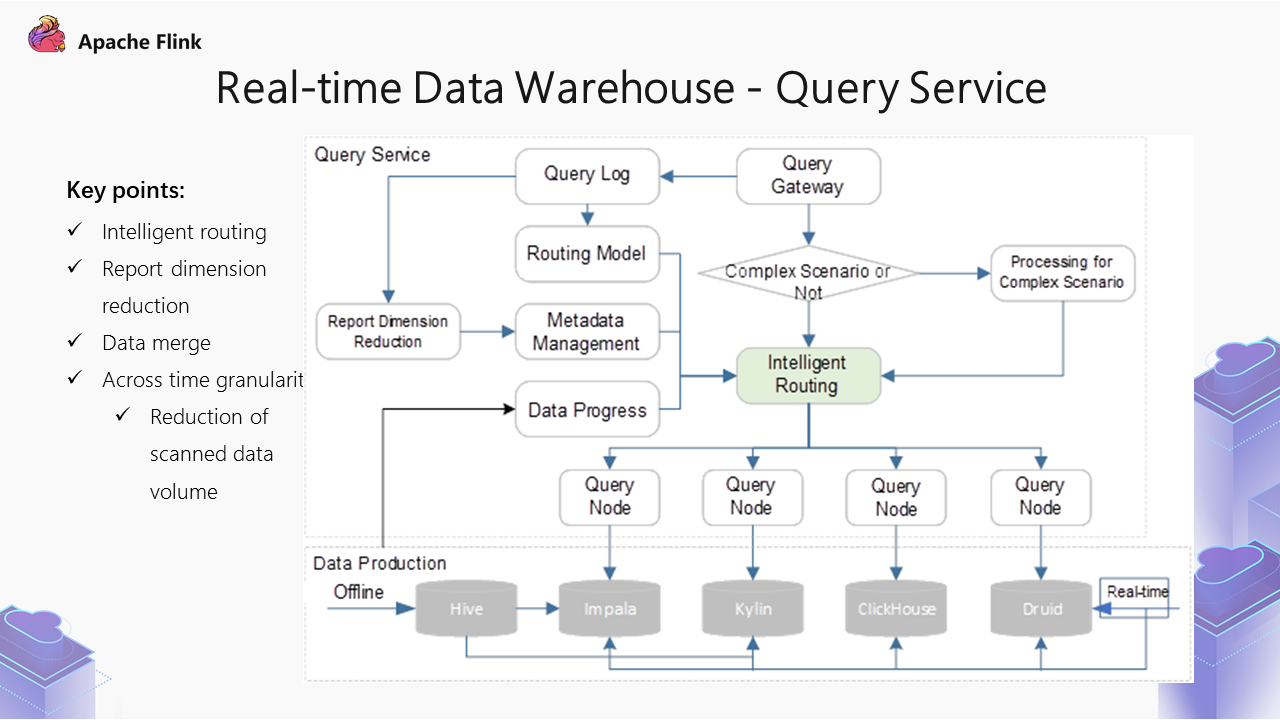
The preceding figure shows the diagram of query service architecture.
At the bottom is the data layer, which contains real-time storage engines, including Druid. For offline computing, the data is stored in Hive, but the data will be synchronized to OLAP during queries. Two engines are used here. The data will be synchronized to the OLAP engine, and then Impala will be used for queries to perform Union queries with Kudu. In addition, for more fixed scenarios, you can import the data to Kylin and then perform data analysis.
Based on these data, there will be multiple query nodes. An intelligent routing layer is at the top of the data layer. When a query request comes in, the query gateway at the top determines whether it is a complex scene. For example, for a query, if its duration spans offline and real-time computing, offline tables and real-time tables will be used here.
Moreover, there are more complex table selection logics for the offline table, such as hour level and day level. After complex scene analysis, the final table will be roughly determined. We will only refer to some basic services on the left for intelligent routing, such as metadata management and progress management.
For the optimization of query performance, the amount of data scanned at the bottom has a huge impact on the final performance. Therefore, there will be a report with reduced dimensions for analysis based on historical queries, including dimensions included in a table with reduced dimensions and the number of queries that can be covered.
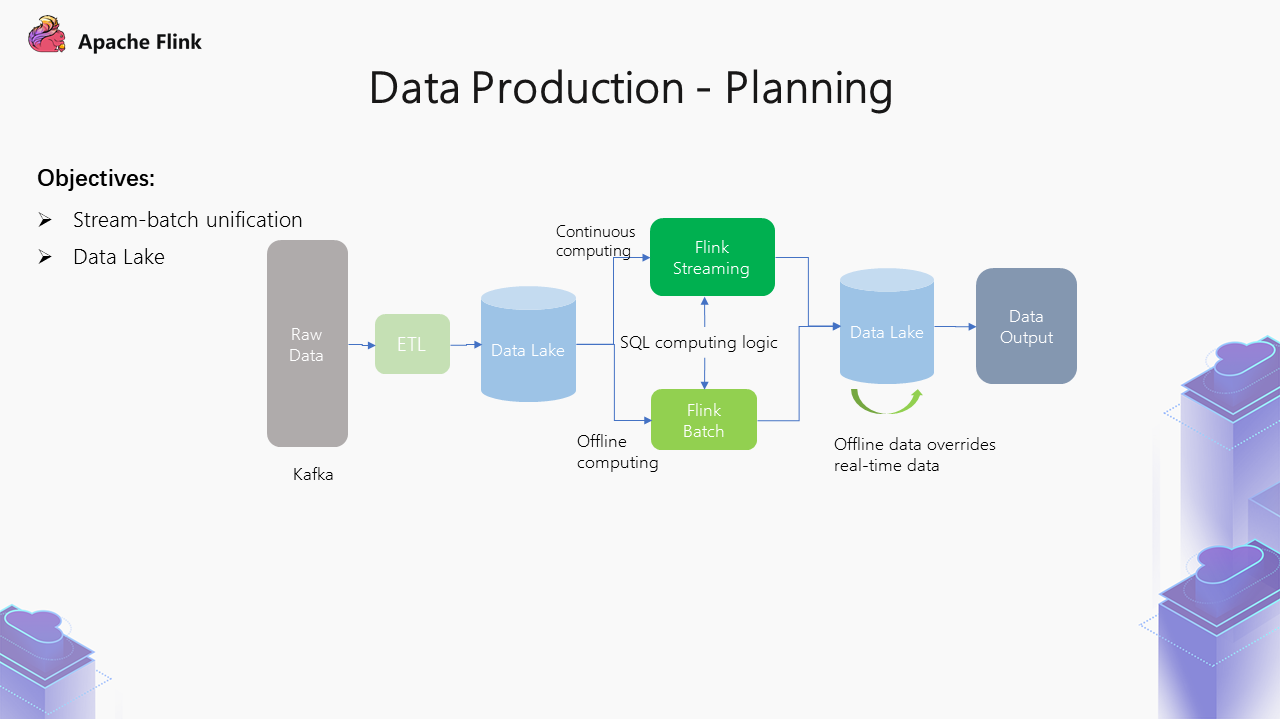
As mentioned earlier in the production of real-time data reports, it is mainly implemented based on API. There is a problem with the Lambda architecture. The real-time and offline computing teams are needed to develop at the same time for the same requirement, which will cause several problems.
Therefore, our demand is to unify stream processing and batch processing. We want to know whether one logic can be used to represent the same business requirement at the computing layer. For example, we can use the computing engines of stream processing and batch processing at the same time to achieve the computing effect.
In this procedure, the original data is accessed through Kafka under the unified ETL logic and then placed in the data lake. The data lake itself can support stream and batch reading and writing and consume data in real-time. So, it can conduct real-time computing and offline computing and then write data back to the data lake uniformly.
As mentioned earlier, offline and real-time integration will be used when conducting queries. Therefore, writing the same table in the data lake can save a lot of work at the storage level and save storage space.
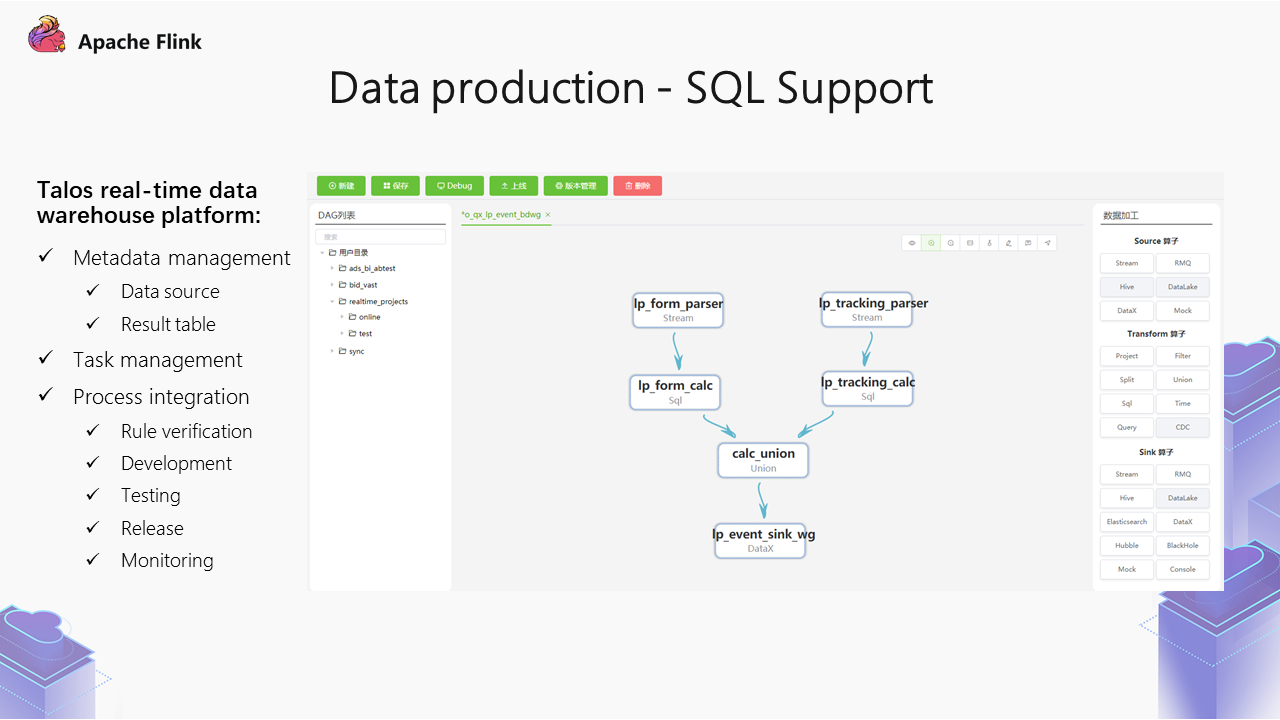
SQL support is a capability provided by the real-time data warehouse platform of Talos.
It includes several functions on the page, with project management on the left and Source, Transform, and Sink on the right.
For example, you can import a Kafka data source to filter the data. Then, you can import a Filter operator to filter the logic. Next, you can conduct some project or union computing and finally output to a certain place.
For those with slightly stronger ability, they can do some higher-level computing. We can also achieve the purpose of real-time data warehouses here. Create some data sources, express the logic through SQL statements, and output the data to a certain storage medium.
The solution above is at the development level. It provides some other functions at the system level, such as rule verification, development, testing, and release, which can be managed uniformly. In addition, there is monitoring. There are many real-time metrics for online real-time tasks. You can check these metrics to determine whether the current task is in a normal state.
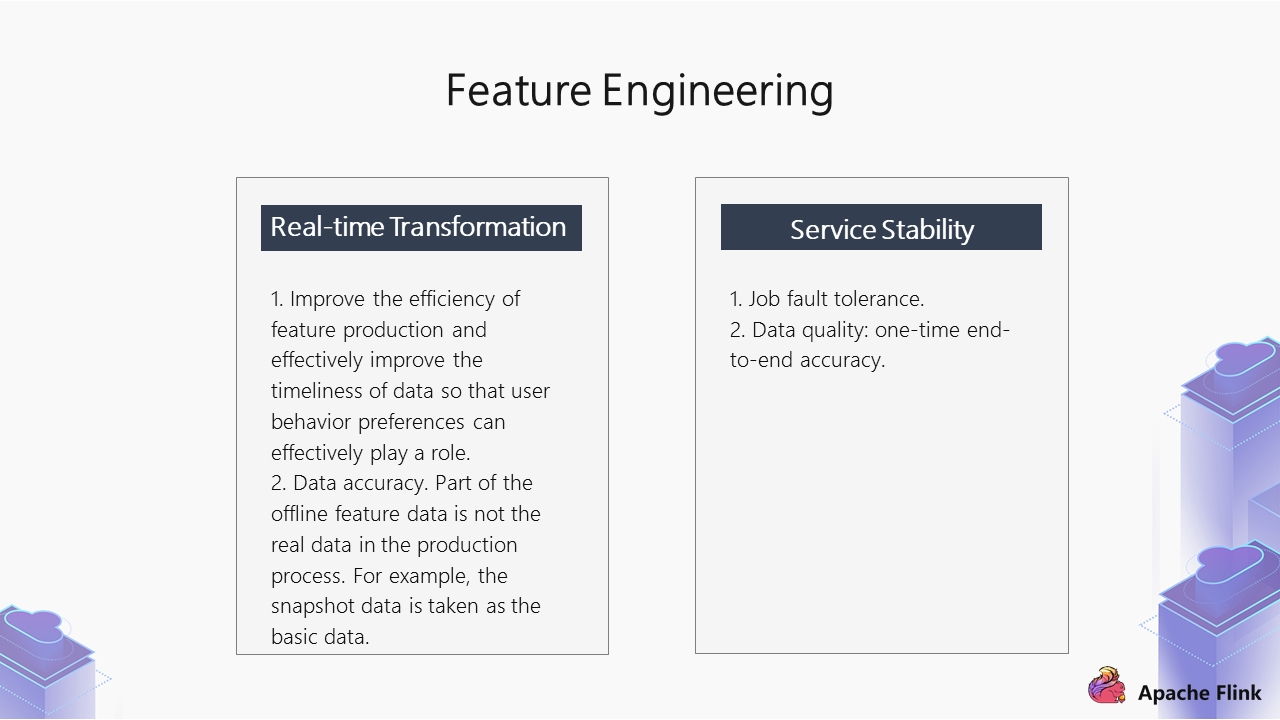
Feature engineering has two requirements:
1. The first requirement is the real-time principle because the value of data will become lower over time. For example, if a user likes to watch children's content, the platform will recommend children-related advertisements. In addition, users will have some positive/negative feedback when watching advertisements. If these data are iterated into features in real-time, the subsequent conversion effect can be improved.
2. The second requirement of feature engineering is service stability.
The following part is the practice of real-time features. The first one is the demand for click-through rate (CTR) estimation.
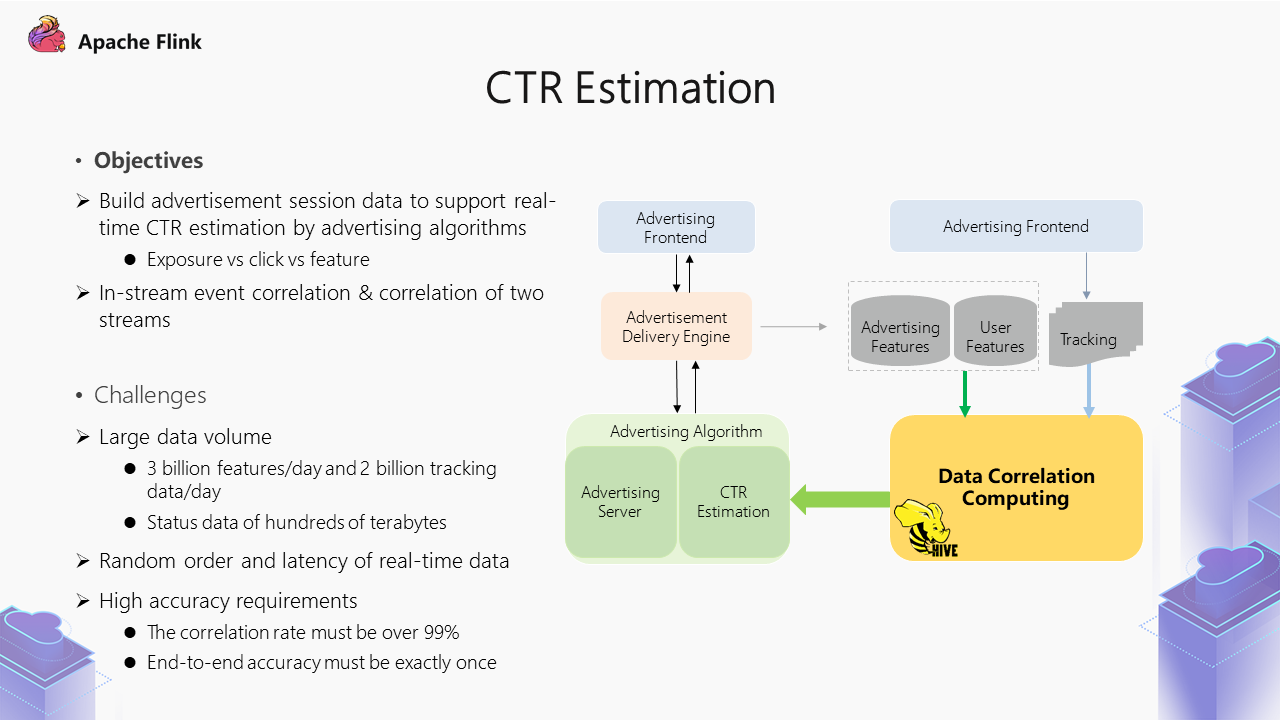
The background of the CTR estimation case is shown above. From the delivery procedure aspect, when users at the advertisement frontend have viewing behavior, the frontend will request the advertisement from the advertisement engine. Then, the advertisement engine will get the user features and advertisement characteristics when making rough/fine arrangements for advertisement recall. After the advertisement is returned to the frontend, users may produce behavioral events, such as exposure and click. When making CTR estimation, it is necessary to associate the characteristics of the previous request stage with the exposure and click in the subsequent user behavior stream to form the Session data. This is our data requirement.
Two aspects are included in real-world practices:
What are the challenges in practices?
In terms of time series, the feature is earlier than Tracking. However, how long does this feature need to be retained when the successful correlation rate of two streams is above 99%? In the advertising business, users can download content offline, and the advertisement request and return have been completed during downloading. However, if the user watches it without an Internet connection, the event will not return immediately. Only when the connection is restored will subsequent exposure and click events be returned.
At this time, the retention periods of feature stream and tracking are very long. After offline data analysis, if the correlation rate of the two streams is above 99%, then the feature data needs to be retained for a relatively long time. Currently, it is retained for seven days, which is still relatively long.
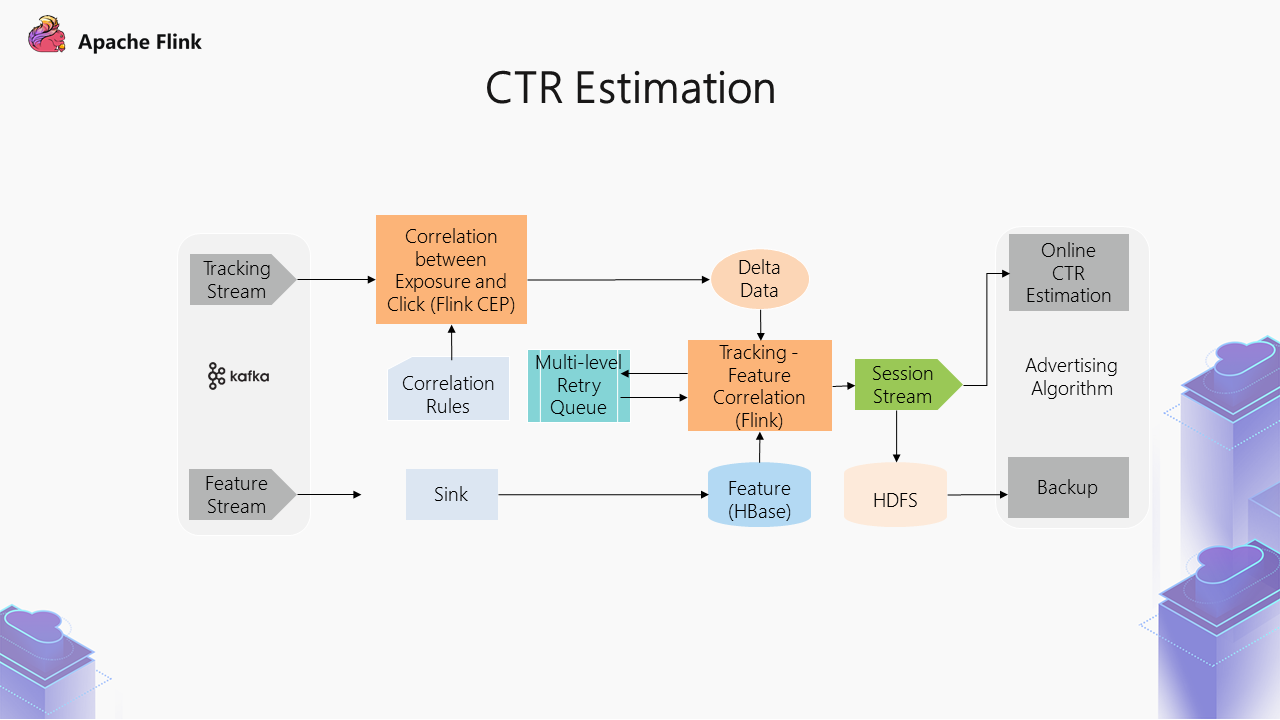
The figure above shows the overall structure of CTR estimation. The correlation we mentioned earlier includes two parts:
However, since the time series of the two streams may be staggered, when exposure and click events appear, this feature may not have arrived, meaning this feature cannot be obtained. Therefore, we implemented a multi-level retry queue to ensure the final correlation integrity of the two streams.
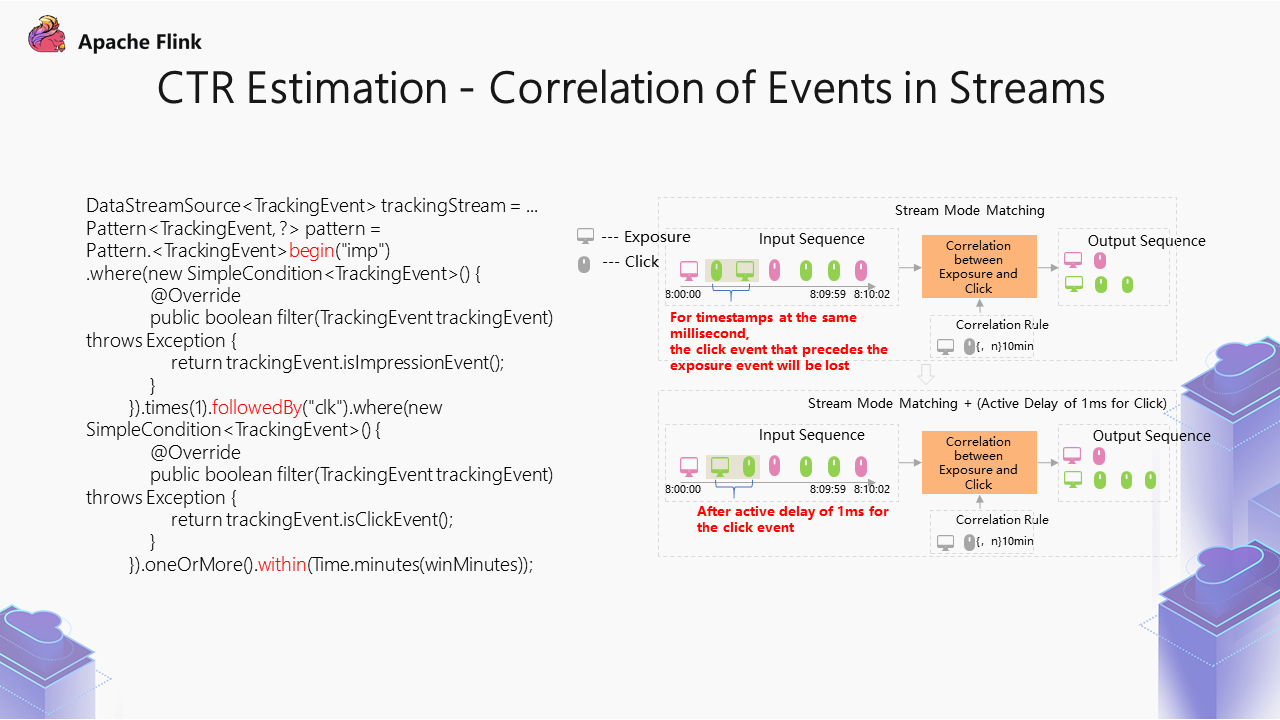
The right side of the figure above shows more detailed statements, which explain why the CEP scheme is selected for the correlation of events in streams. The business requirement is to associate exposure events of the same advertisement in the user behavior stream with click events. After exposure, clicks generated (for example, within five minutes) are taken as positive samples, while clicks generated after five minutes are discarded.
You can wonder which scheme can achieve such an effect when encountering such a scene. The processing of multiple events in a stream can be realized by windows. However, problems with windows may exist:
Therefore, after a lot of technical research at that time, we found that CEP in Flink could achieve such an effect. It used a similar policy matching method to describe which matching methods these sequences need to meet. In addition, it can specify a time window for the event interval, such as a 15-minute interval for exposure and click events.
On the left side of the figure above, the begin command defines an exposure to realize a click within five minutes after the exposure. The commands after it describe a click that can occur multiple times. The within command indicates the duration of the correlation window.
During the process of production practice, this scheme can achieve correlation in most cases, but when comparing data, we found that some exposure and click events are not normally correlated.
After data analysis, we found that the exposure and click timestamps of these data are at the millisecond level. When these events have the same millisecond-level timestamp, they cannot be matched normally. Therefore, we adopt a scheme to add one millisecond to the click events manually. This way, the exposure and click events can be correlated successfully.
As mentioned earlier, feature data needs to be retained for seven days with a size of hundreds of terabytes. Data needs to be stored in an external storage medium. As a result, there are specific requirements for the external storage medium when making technical selections:
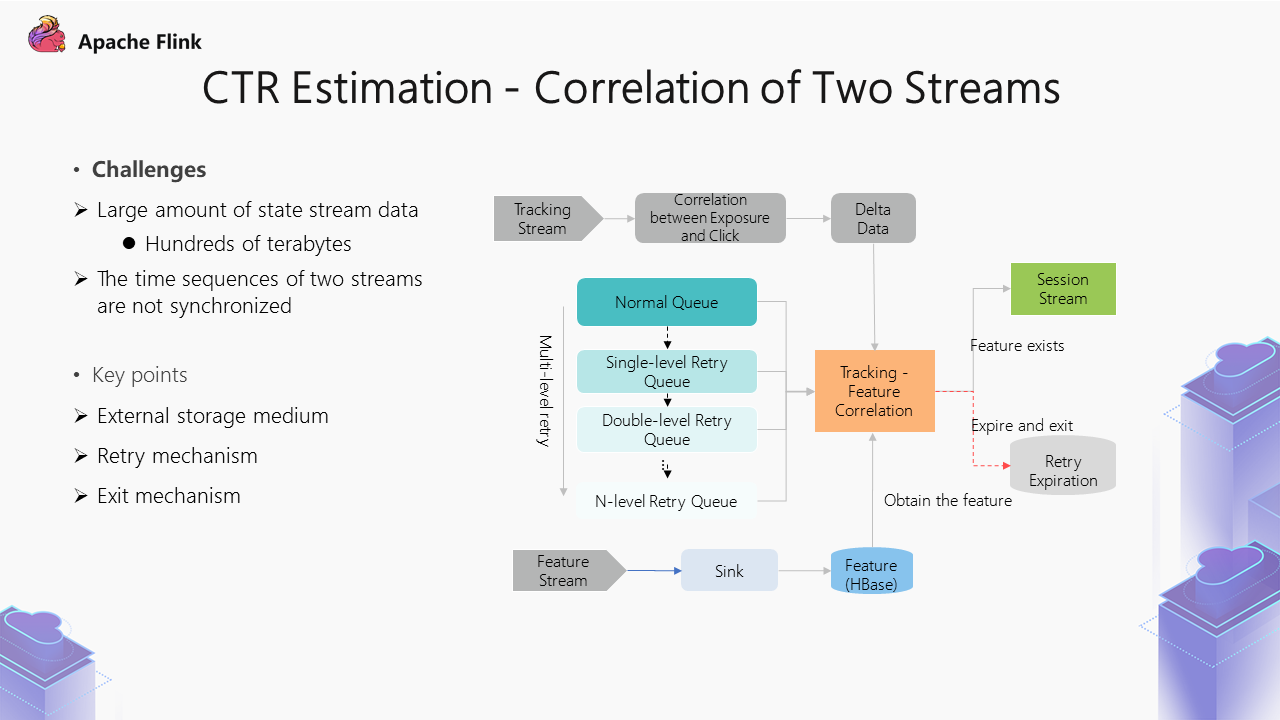
Based on the points above, HBase was finally selected to form the solution shown in the preceding figure.
The top part indicates that the exposure sequence is correlated with the click sequence through CEP. At the bottom, the feature stream is written into HBase through Flink for external state storage. The core modules in the middle are used to achieve the correlation of the two streams. After the correlation of exposure and click events is completed, check the HBase data. If it can be found normally, it will be output to a normal result stream. For the data that cannot be correlated, a multi-level retry queue is provided, which will result in queue degradation during multiple retries. Besides, the retry gap will widen step-by-step to reduce the scanning pressure on HBase during retries.
An exit mechanism is also provided because retries are performed a limited amount of times. The reasons why the exit mechanism exists mainly include:
Therefore, the exit mechanism means the feature will expire after retrying multiple times, and it will retry the expired data.
In the valid click scenario, it is the correlation between the two streams, but the technical selection is completely different.
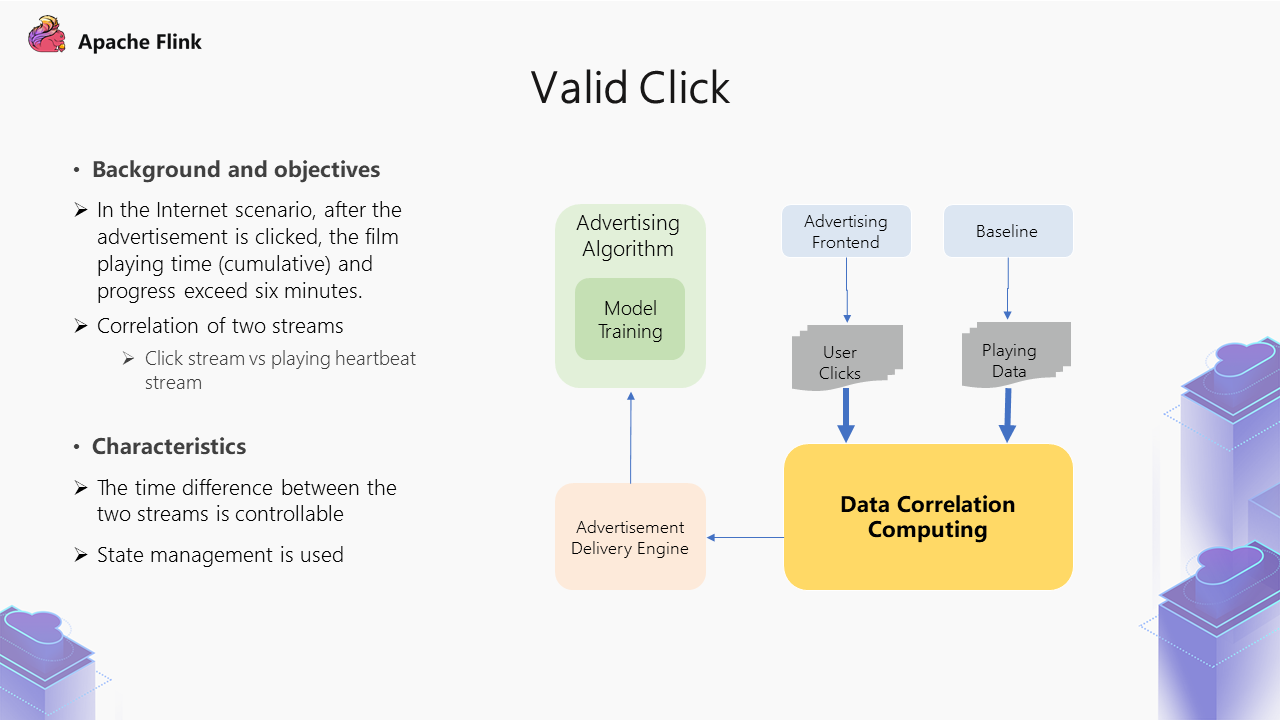
First of all, let's look at the project background. In the Internet scenario, the film itself is an advertisement. After clicking, the playing page appears. On this page, users can watch for six minutes free of charge. If they want to continue watching, they need to become VIPs. The data of valid clicks are collected here. The clicks after users watch for more than six minutes are defined as valid clicks.
This scenario technically involves the correlation of two streams, including the click stream and playing heartbeat stream.
In this scenario, the gap between two streams is relatively narrow, while a film generally lasts for more than two hours. So, for the behavior after clicking, the gap can roughly be completed within three hours. The state is relatively small here. And use of Flink management can achieve that.
Now, let's look at a specific solution:
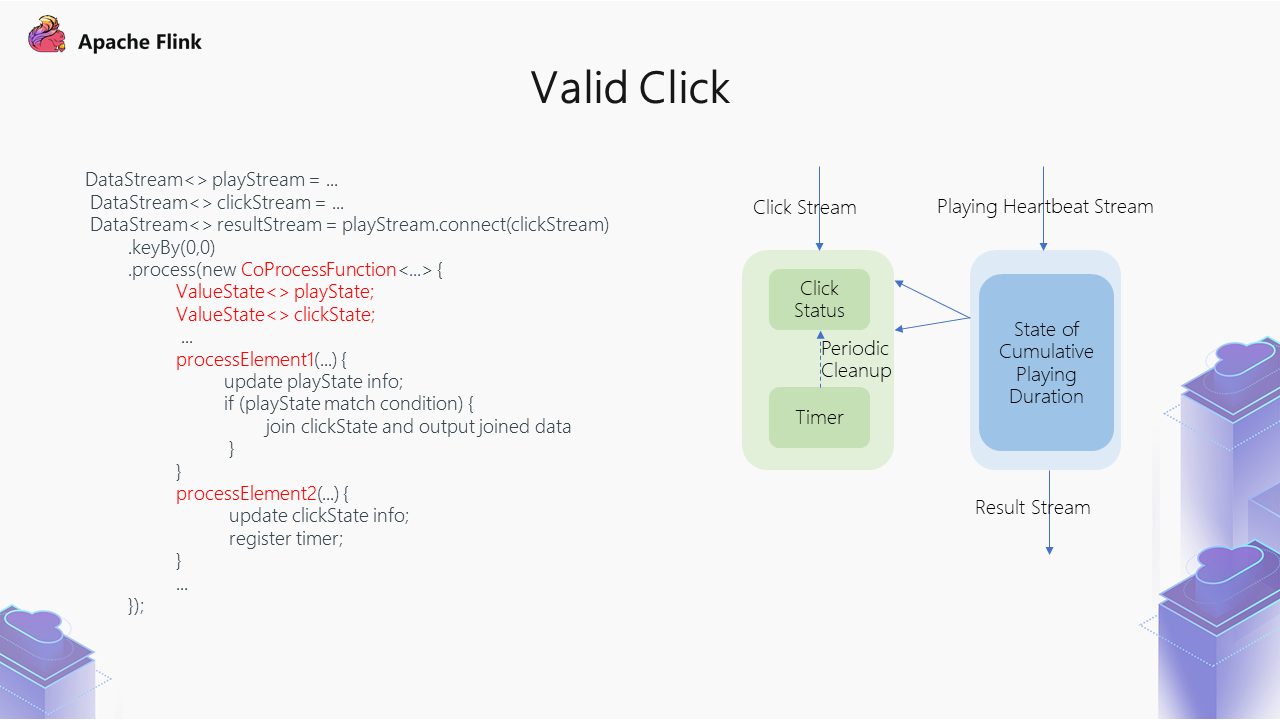
In the figure above, the green part is the click stream, and the blue part is the playing heartbeat stream.
Operators provide users with a lot of flexibility, and users can achieve logical control. Compared with Input Join, it is more flexible for users.
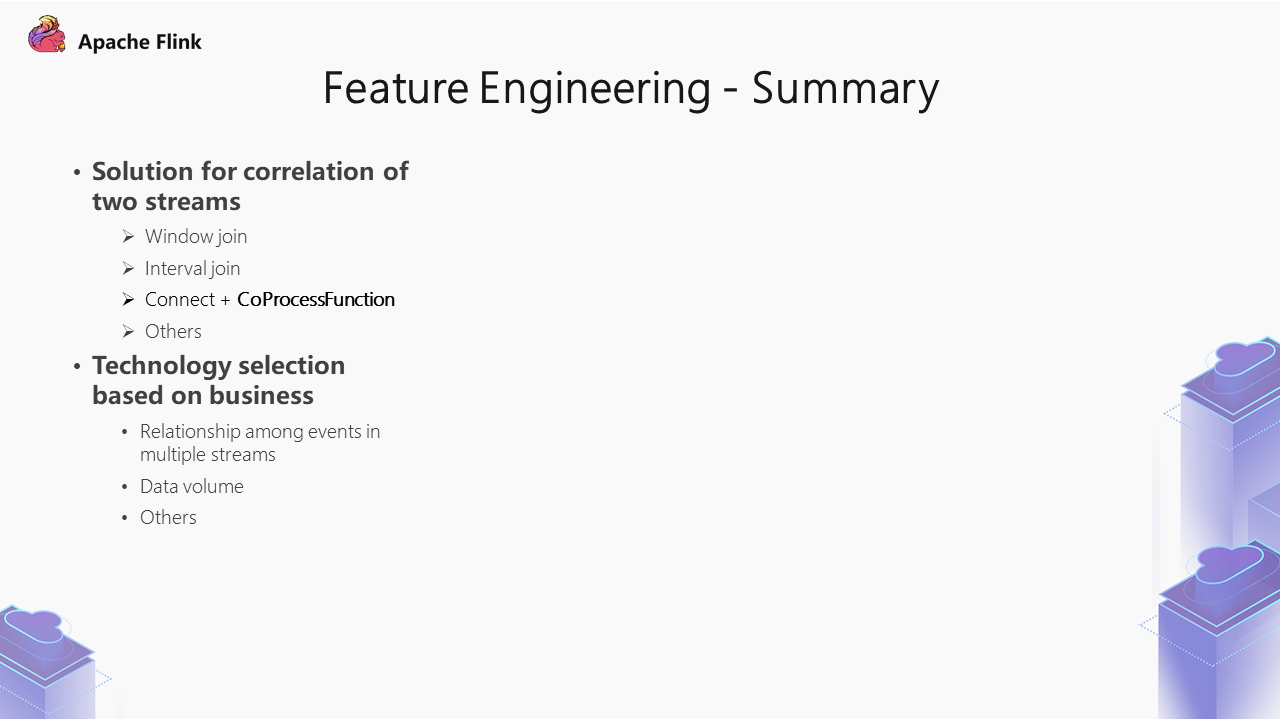
Here is a summary of the parts above. Currently, the management of two streams is very common. There are many options, such as Window join, Interval join, and Connect + CoProcessFunction. In addition, there are some user-defined solutions.
During selection, we recommend considering the business for proper technical selection. First, we should think about the relationship among events in multiple streams and then judge the state scale. To a certain extent, we can exclude the unfeasible schemes from the schemes above.
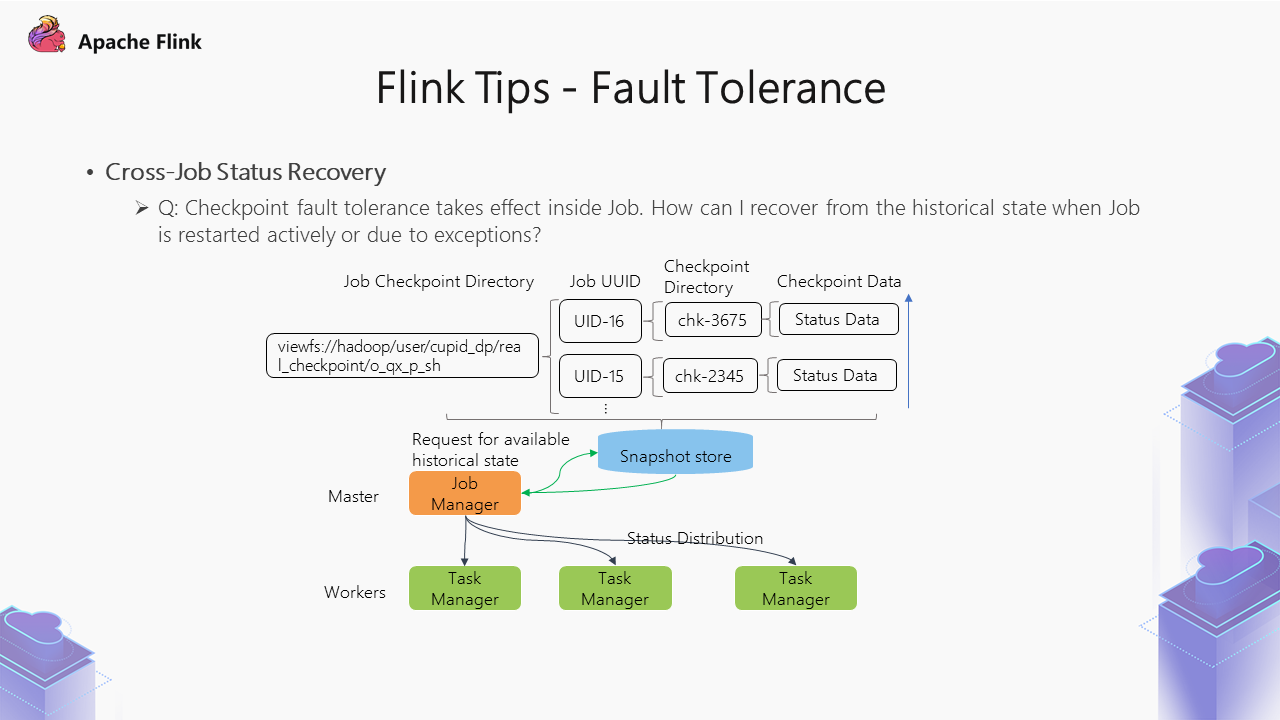
In Flink, fault tolerance is mainly implemented through Checkpoint. Checkpoint is designed for fault tolerance at the task level within Job. However, when Job is restarted actively or due to exception, the state cannot be recovered from the historical state.
Therefore, we have made some improvements here. When a job is started, it will obtain the last successful historical state from Checkpoint and initialize it to achieve the effect of state recovery.
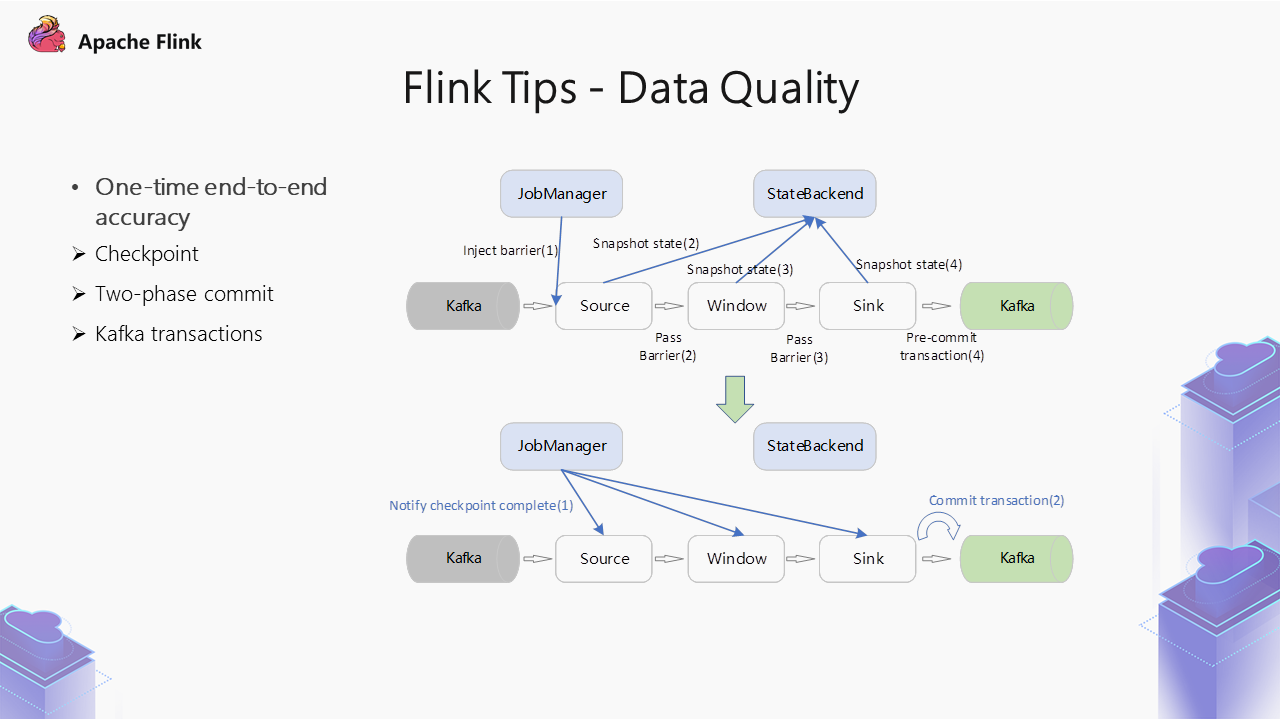
Flink implements one-time end-to-end accuracy. First, you need to enable the Checkpoint feature and specify the semantics of one-time accuracy. Moreover, if it supports transactions from the downstream, such as Sink, it can be combined with a two-phase commit protocol, Checkpoint, and downstream transactions to achieve one-time end-to-end accuracy.
This process is described on the right side of the figure above. This is a pre-commit process. In other words, when the Checkpoint coordinator is implementing checkpoints, it will inject some Barrier data into the Source side. After each Source obtains the Barrier data, it stores the state and feeds back the completion state to the coordinator. As such, each operator obtains the Barrier data to achieve the same function.
After arriving at Sink, it will submit a pre-commit mark in Kafka, which is mainly guaranteed by the transaction mechanism of Kafka. After all the operators have completed the checkpoint operation, the coordinator will send an ACK to all operators for acknowledgment. At this time, Sink can commit the transaction.
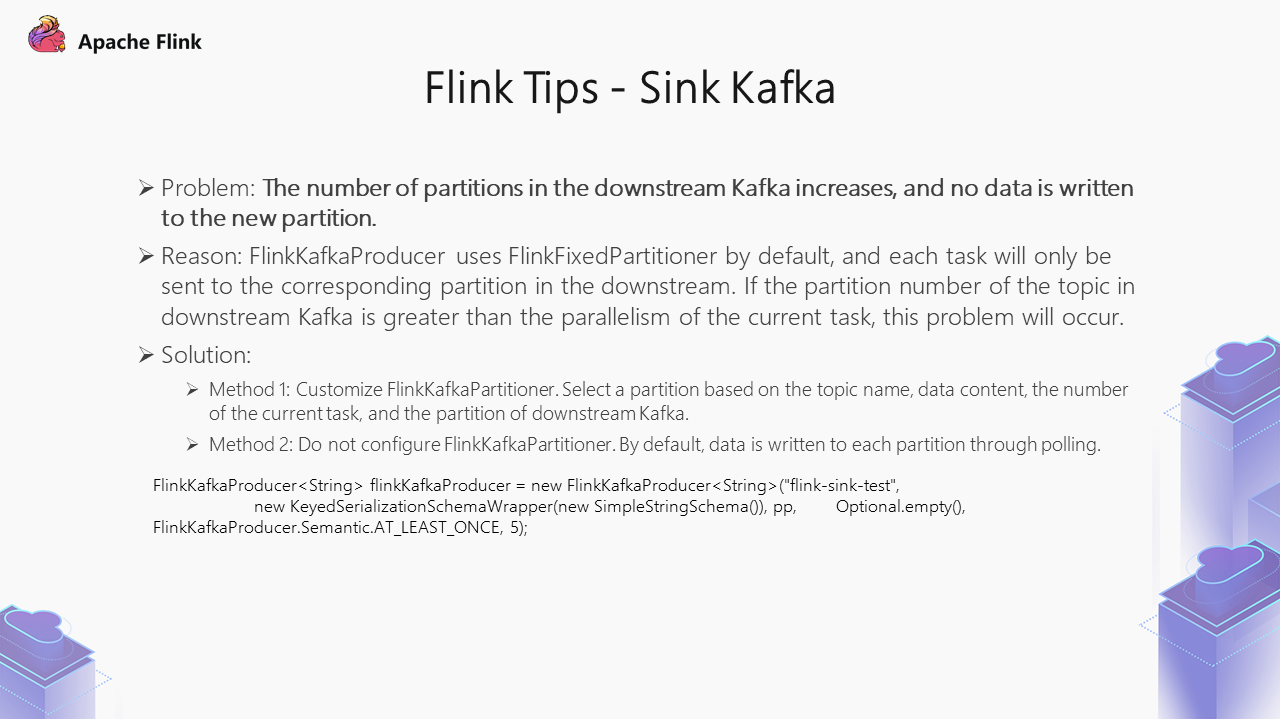
In the previous practice, we found that when the downstream Kafka increases the number of partitions, no data is written to the new partition.
This happens because FlinkKafkaProducer uses FlinkFixedPartitioner by default, and each task is only sent to one corresponding downstream partition. This problem occurs if the partition number of the downstream Kafka Topic is greater than the parallelism of the current task.
There are two solutions:
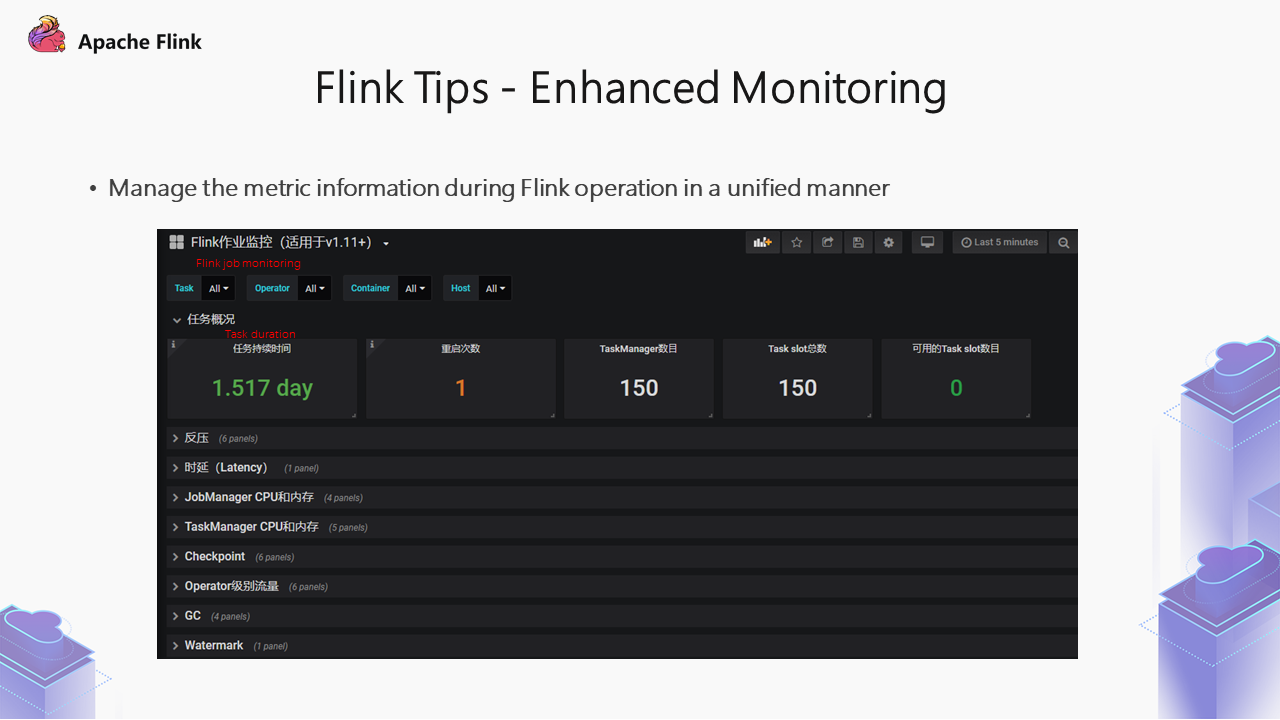
We need to check the status to run a Flink job. For example, in Flink UI, many of its metrics are at Task granularity and have no overall effect.
The platform has aggregated these metrics and displayed them on one page.
As shown in the preceding figure, the displayed information includes the backpressure status, latency, and CPU/memory utilization of JobManager and TaskManage during operation. Checkpoint monitoring is also displayed, showing whether any checkpoint timed out or failed recently. We will add alert notifications for these monitoring metrics later.
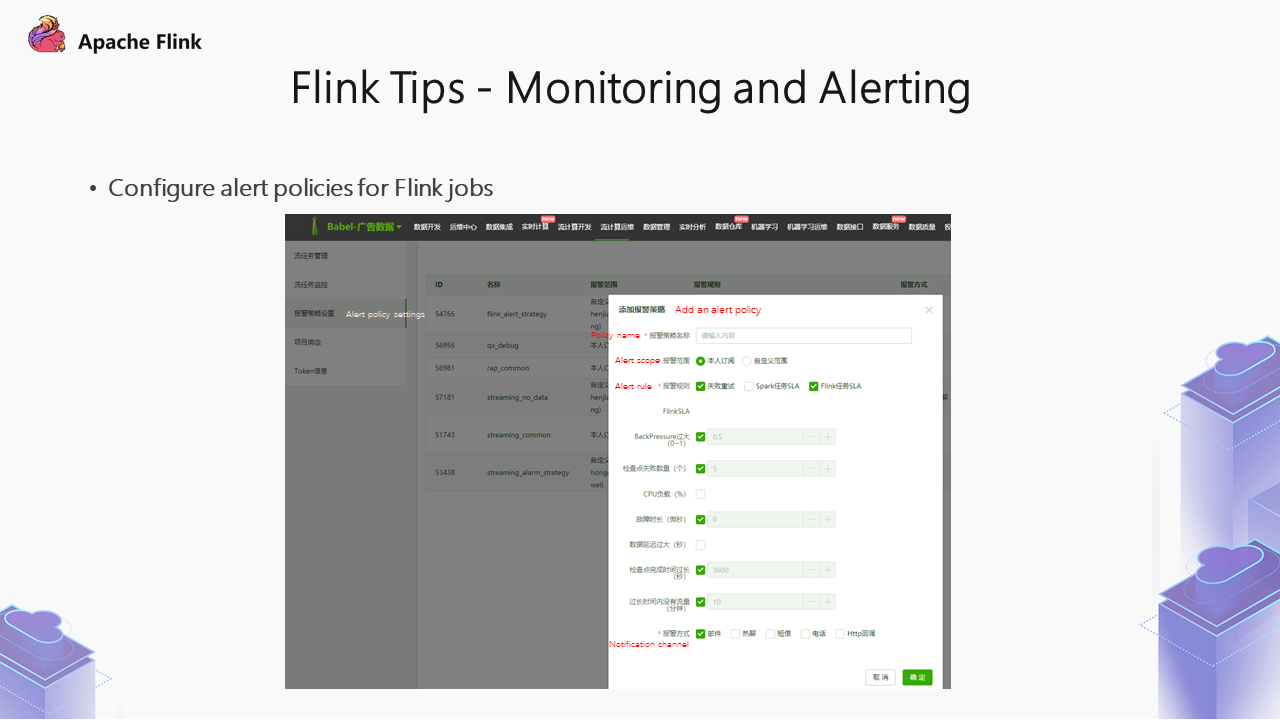
When an exception occurs during real-time task operation, users need to know the status in time. As shown in the figure above, there are some alert items, including alert subscribers, alert levels, and some metrics below. According to the metric values set earlier, if the alert policy rules are met, alerts will be pushed to the alert subscriber. Alerts are sent through emails, telephone calls, and internal communication tools, thus realizing notification of task exception status.
By doing so, when the task is abnormal, the user can know the status in time and then carry out the manual intervention.
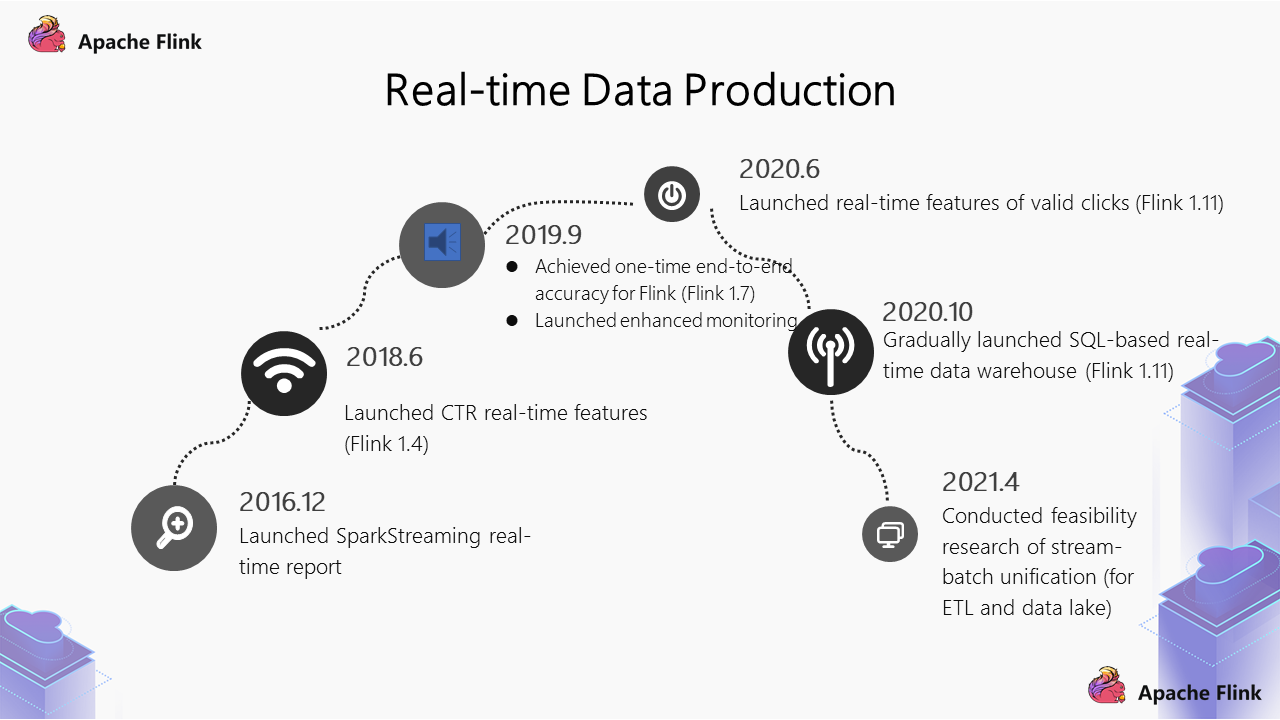
Now, let's summarize the key nodes of iQiyi's advertising business in the real-time production procedure:
The first advantage of implementing stream-batch unification for ETL is to improve the timeliness of offline data warehouses. We need to conduct anti-cheating processing on data. When we provide basic features to the advertising algorithm, the timeliness after anti-cheating processing can largely improve the subsequent overall effect. Therefore, if real-time transformation is performed for ETL, it is of great significance for subsequent stages.
After ETL achieves stream-batch unification, we will store the data in the data lake, and subsequent offline data warehouses and real-time warehouses can be implemented based on the data lake. The stream-batch unification involves two stages. In the first stage, unification is achieved in ETL. The report side can also be placed in the data lake so that our query service can be more powerful. Previously, Union calculation was needed for offline and real-time tables. In the data lake, we can do it by writing the same table offline and in real-time.
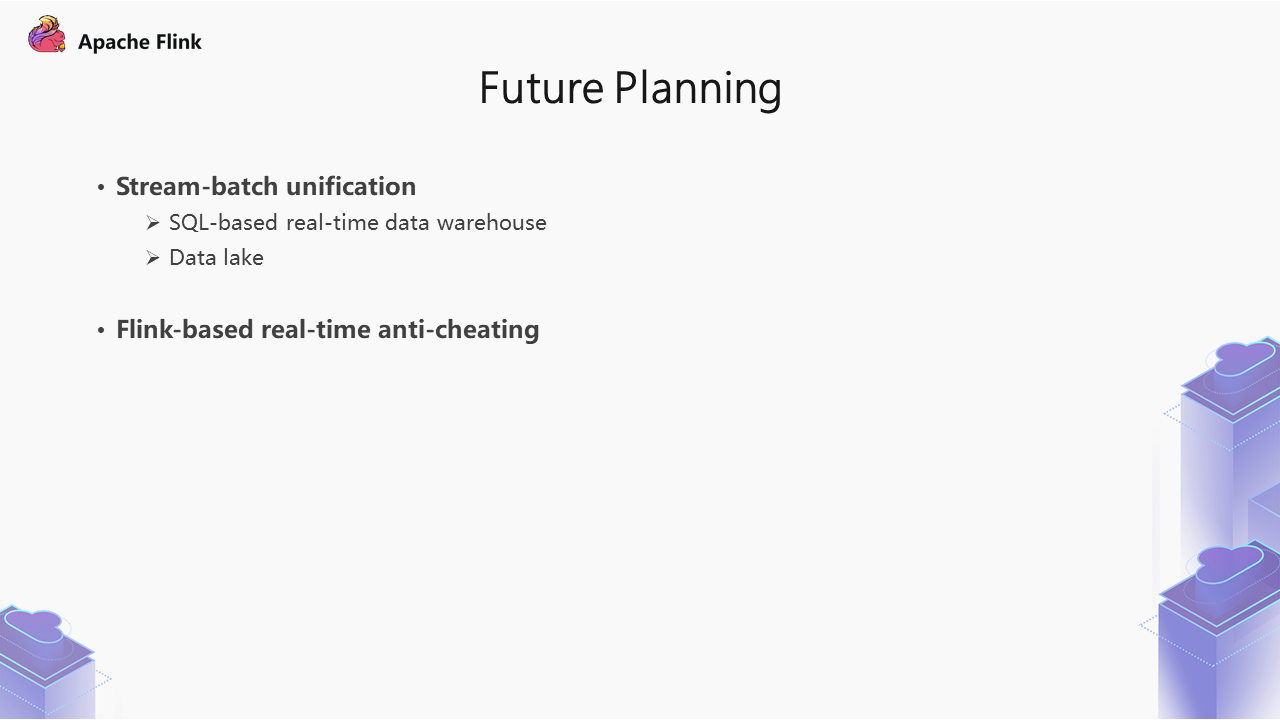
The first thing is stream-batch unification, which includes two aspects:
Currently, anti-cheating processing is mainly implemented offline. In the future, some online anti-cheating models may be transformed into real-time models to minimize risks.
A Demo of the Scenario Solution Based on Realtime Compute for Apache Flink

206 posts | 54 followers
FollowAlibaba EMR - March 18, 2022
Alibaba Cloud Community - December 21, 2021
Apache Flink Community - August 8, 2025
Alibaba Cloud MaxCompute - January 4, 2022
Apache Flink Community China - June 28, 2021
Apache Flink Community China - January 11, 2021

206 posts | 54 followers
Follow Realtime Compute for Apache Flink
Realtime Compute for Apache Flink offers a highly integrated platform for real-time data processing, which optimizes the computing of Apache Flink.
Learn More Big Data Consulting for Data Technology Solution
Alibaba Cloud provides big data consulting services to help enterprises leverage advanced data technology.
Learn More Big Data Consulting Services for Retail Solution
Alibaba Cloud experts provide retailers with a lightweight and customized big data consulting service to help you assess your big data maturity and plan your big data journey.
Learn More Hologres
A real-time data warehouse for serving and analytics which is compatible with PostgreSQL.
Learn MoreMore Posts by Apache Flink Community