By Long Qingyun
MaxCompute is committed to the storage and computing of batch structured data, and provides massive solutions and analytical modeling of data warehouses. However, when executing SQL tasks, sometimes MaxCompute can be slow. This article identifies the reasons for the slowdown of specific tasks by viewing the logview.
Here, the problem of slow task running is analyzed by dividing into the following categories:
A common SQL task uses resources of CPU and Memory. For details on how to query data with Logview 2.0, please see the following documentation page.

If the task keeps showing "Job Queueing..." after submission, it is possible that the task is queued because others are taking up resources in the resource group.
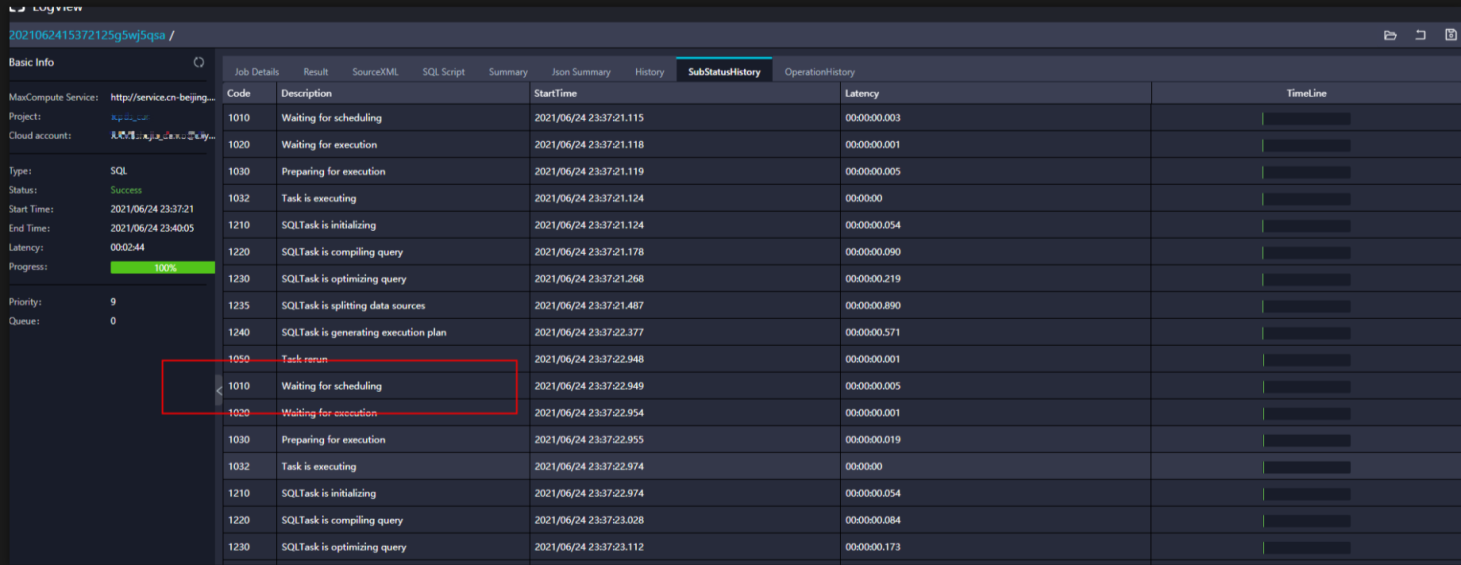
In the SubStatusHistory, waiting for scheduling is the time for waiting.
There is another case here that although the task can be submitted successfully, the current resource group cannot start all instances at the same time due to the large number of resources required. This has led to a situation where tasks are progressing but not fast, which can be observed through the latency chart in Logview. You can click on the corresponding task in detail to view the latency chart.

The preceding figure shows the running status of the task with sufficient resources. It can be seen that the blue parts are all flat, indicating that almost all the instances have been started at the same time.
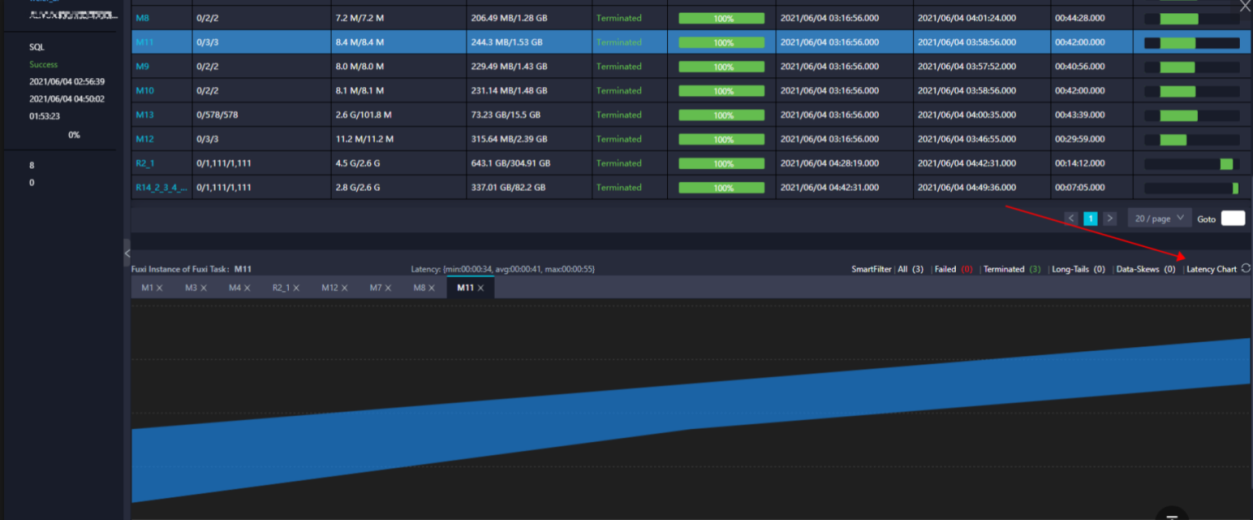
The bottom layer of this figure is in a step-up pattern, indicating that the task instances are scheduled bit by bit, and there are not enough resources running in the task. If the task is relatively important, you can consider increasing the resources or prioritize the task accordingly.
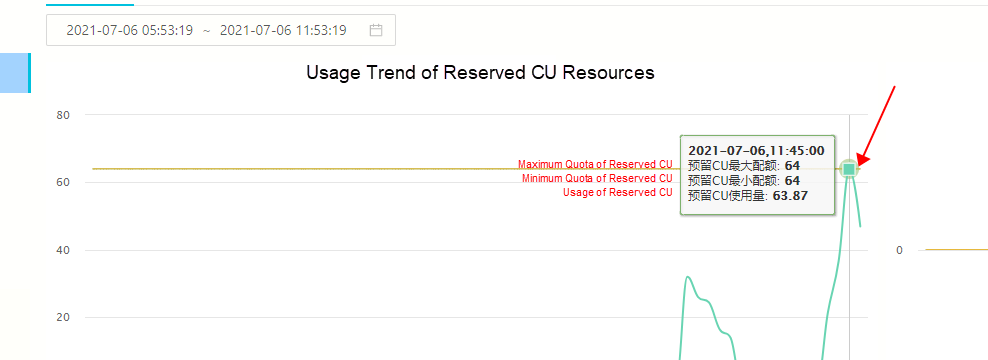
Check whether the number of CU is full using the CU manager. Click on the corresponding task point and find the corresponding time to check the status of the submission.
Sort by CPU utilization:

Slow CU consumption due to excessive small files.
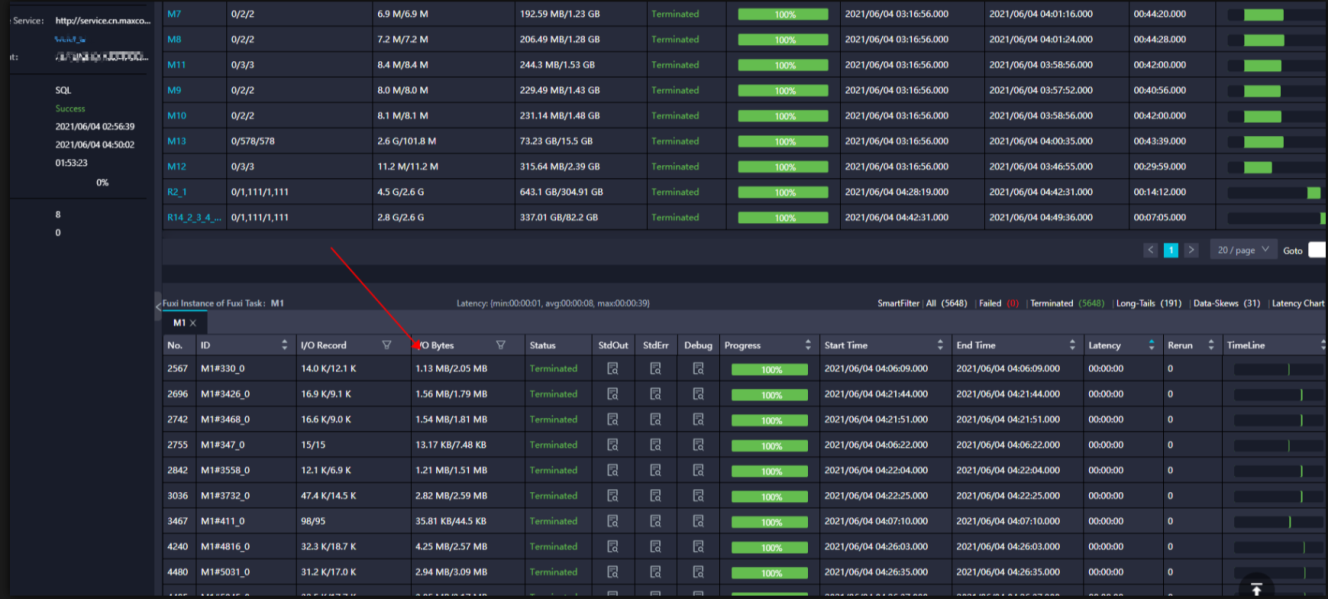
The parallelism of the Map stage is determined by the shard size of the input file, thus indirectly controlling the number of Workers under each Map stage that the default value is 256 MB. If it is a small file, it will be read as a block. As shown in the following figure, the I/O bytes of each task in Map stage m1 is only 1 MB or dozens of kilobytes, causing more than 2,500 degrees of parallelism to fill up resources instantly. This indicates that the table contains too many small files to merge.
Merge small files: https://www.alibabacloud.com/blog/optimizing-maxcompute-table-to-cope-with-small-files_594464
Full resource consumption due to large data volumes
Purchased resources can be added. If it is a temporary task, the parameter of set odps.task.quota.preference.tag=payasyougo; can be added, also the specified task can be temporarily run to a large pool of pay-per-use resources.
The degree of parallelism in MaxCompute is automatically estimated based on the input data and task complexity. Generally, no adjustment is required. Furthermore, the greater the parallelism, the faster the speed processing under ideal circumstances. However, for subscription resource groups, the entire resource group may be used up, resulting in all tasks are waiting for resources. This slows down tasks.
Parallelism of the Map stage
odps.stage.mapper.split.size: Modify the amount of input data for each Map Worker, that is, the shard size of the input file, thus indirectly controlling the number of Workers under each Map stage. The unit is a megabyte (MB) and the default value is 256 MB.
Reduce parallelism
odps.stage.reducer.num: Modify the number of Workers in each Reduce stage
odps.stage.num: Modify MaxCompute to specify the number of concurrency of all Workers under the task with lower priority than odps.stage.mapper.split.size, odps.stage.reducer.mem, and odps.stage.joiner.num.
odps.stage.joiner.num: Modify the number of workers in each Join stage.
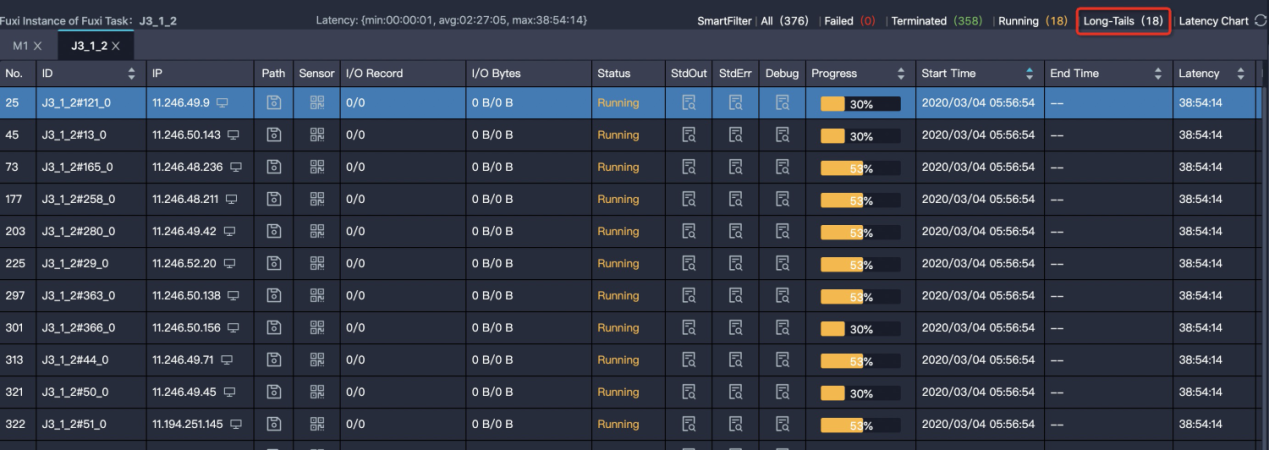
In this scenario, most instances in a task have ended but several instances have long tails that are slow to end. As shown in the following figure, 358 instances are finished, but 18 instances are in the Running state. These instances run slowly, either because they process a lot of data or these instances process specific data slowly.
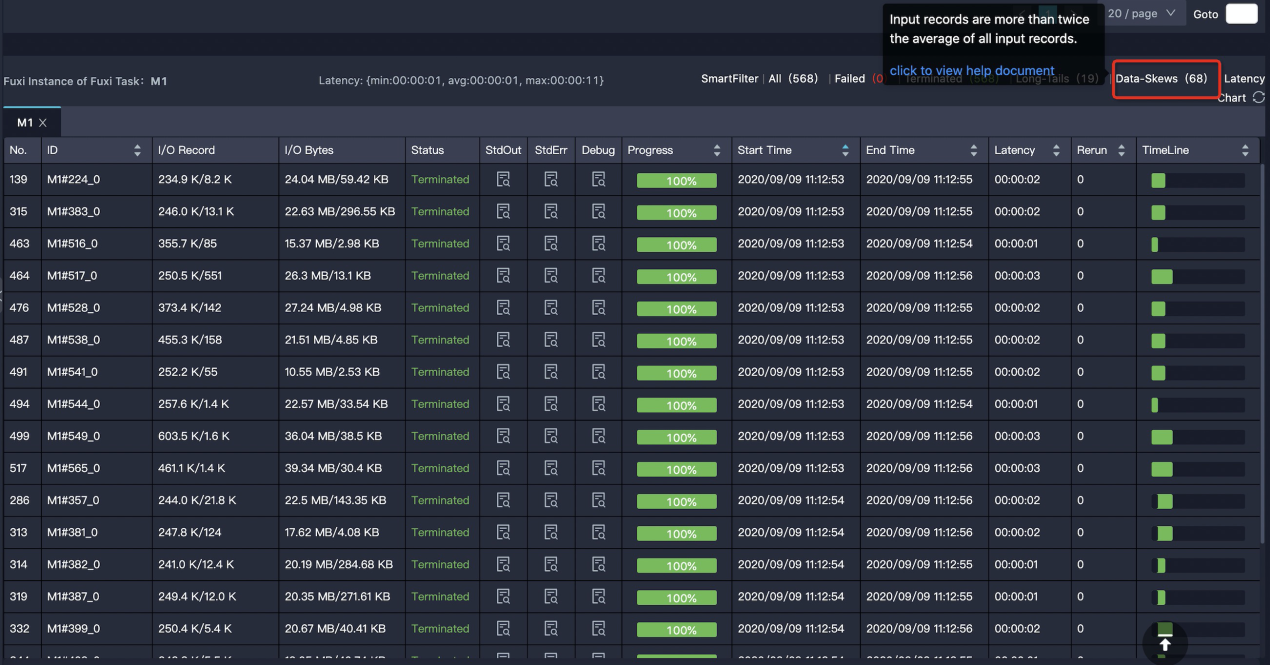
The solution to this issue can be found in the following documentation: https://www.alibabacloud.com/help/doc-detail/102614.htm
The problem is that the SQL or UDF logic is inefficient, or the optimal parameter settings are not used. This is evidenced by the long running time of a task and the relatively even running time of each instance. The situation here is even more diverse. Some of them do have complex logic, while others offer more room for optimization.
The size of output data in a task is much larger than that of input data.
For example, if 1GB of data is processed to 1 TB, the running efficiency will definitely be greatly reduced if the latter is processed in one instance. The amount of input and output data is reflected in the I/O Record and I/O Bytes of the task:

To solve this issue, make sure that the business logic really needs this, and increase the parallelism of the corresponding stages.
A task has low execution efficiency, and there are user-defined extensions in the task. UDF execution produces a timeout error: “Fuxi job failed - WorkerRestart errCode:252,errMsg:kInstanceMonitorTimeout, usually caused by bad udf performance”
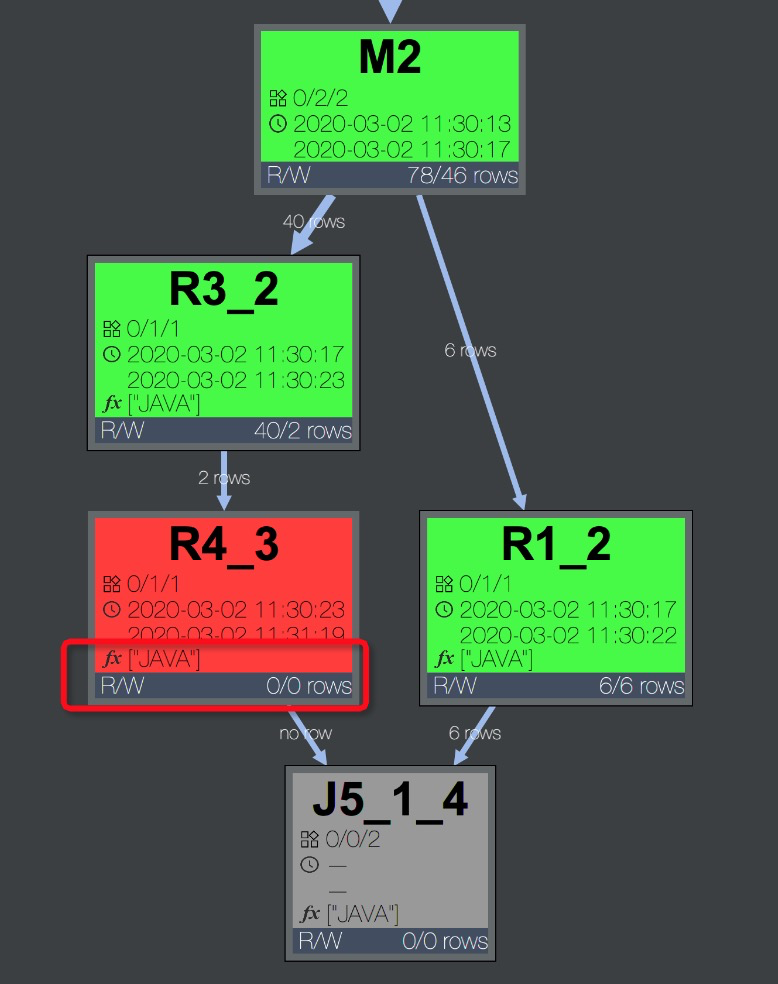
Before attempting to solve this issue, determine the UDF location first. Click the slow fuxi task and check whether the operator graph contains UDFs. The following figure shows UDFs of java.
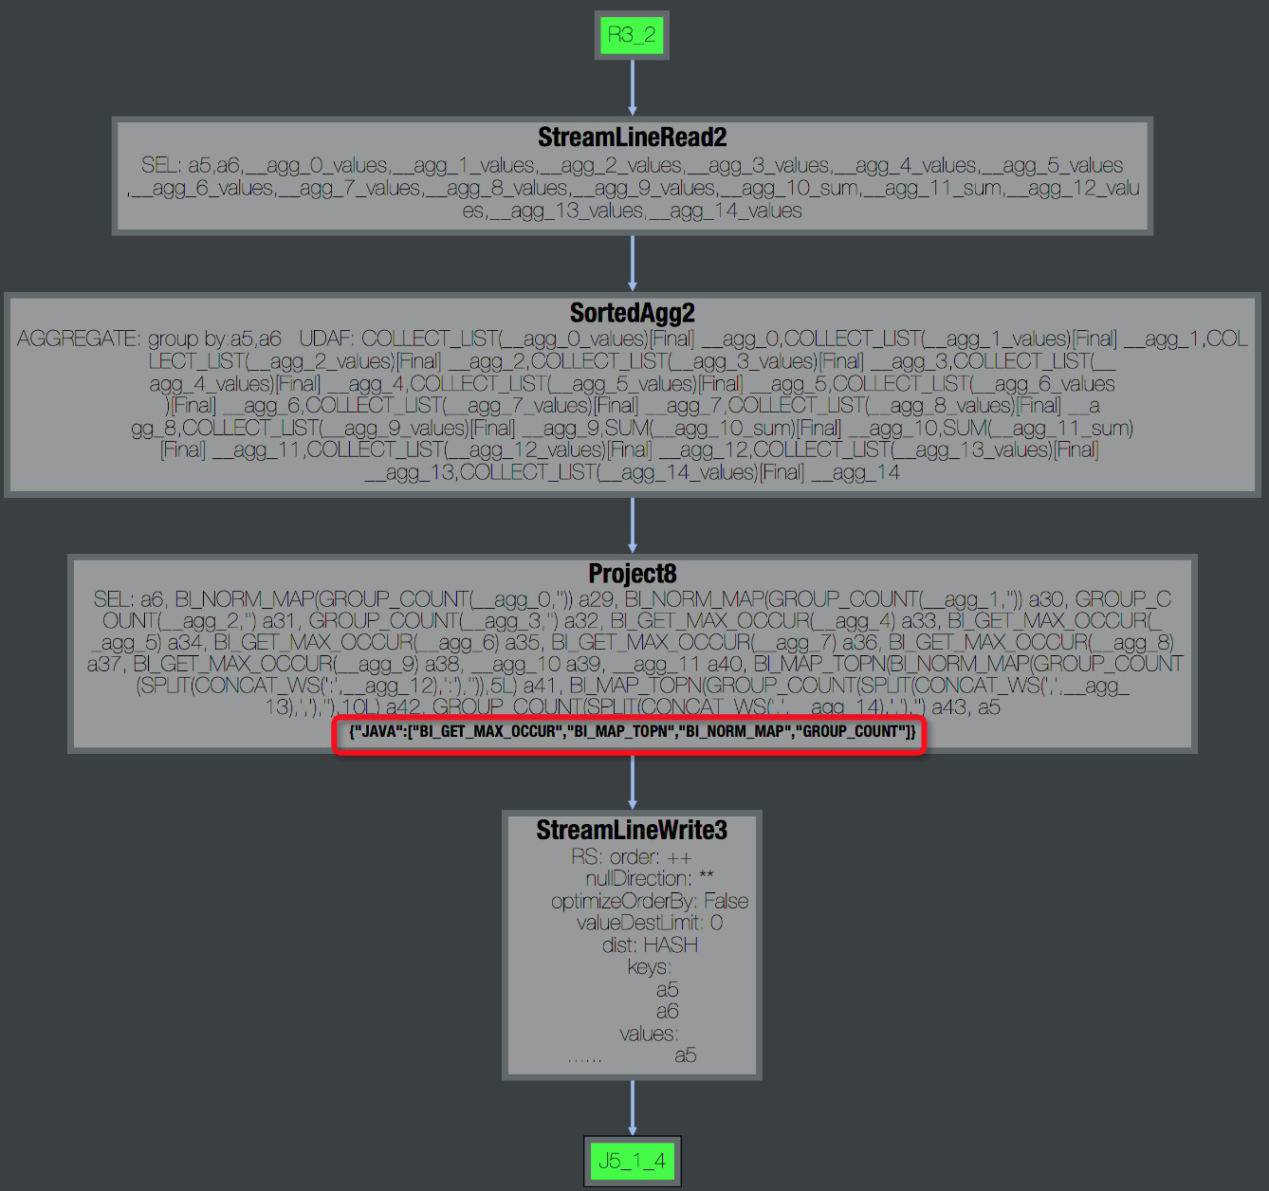
By checking the stdout of the fuxi instance in the logview, the operator's speed can be viewed. Normally, the speed(records/s) is at the millions or hundreds of thousands level.

To solve this issue, use built-in functions as much as possible when checking UDF logic.
MaxCompute-Based Artificial Intelligence Recommendation Solution

137 posts | 21 followers
FollowAlibaba Cloud MaxCompute - December 13, 2018
Alibaba Cloud MaxCompute - September 12, 2018
Alibaba Cloud MaxCompute - June 2, 2021
Alibaba Cloud MaxCompute - September 12, 2018
Alibaba Cloud Community - October 20, 2025
Alibaba Cloud MaxCompute - April 25, 2019

137 posts | 21 followers
Follow Big Data Consulting for Data Technology Solution
Alibaba Cloud provides big data consulting services to help enterprises leverage advanced data technology.
Learn More MaxCompute
Conduct large-scale data warehousing with MaxCompute
Learn More Big Data Consulting Services for Retail Solution
Alibaba Cloud experts provide retailers with a lightweight and customized big data consulting service to help you assess your big data maturity and plan your big data journey.
Learn More ApsaraDB for HBase
ApsaraDB for HBase is a NoSQL database engine that is highly optimized and 100% compatible with the community edition of HBase.
Learn MoreMore Posts by Alibaba Cloud MaxCompute