By Ranjith Udayakumar, Alibaba Cloud Tech Share Author. Tech Share is Alibaba Cloud's incentive program to encourage the sharing of technical knowledge and best practices within the cloud community.
This multi-part article talks about how to collect data, wrangle the data, ingest the data, model the data, and visualize the data from three viewpoints (conceptual, practical, and best practice).
In the first article of this series, we have seen how to understand data conceptually through an example from the Banking, Financial services and Insurance (BFSI) domain. In the second article, we have learned how to wrangle the data (i.e. cleaning the data) according to your business scenario to Alibaba Cloud Quick BI.
In this article, I will share how to model the data according to your business scenario in Quick BI. We will be using Quick BI for this tutorial, so please ensure that you have registered for an Alibaba Cloud account. If you haven't, sign up for a free account through this link.
A data model for one line of business is hardly appropriate for another line of business. Often times, the needs of different businesses, or even departments, do not closely align together. Because of this, understanding and analyzing how an organization should collect, update, and store data becomes a critical problem.
In the previous articles, we have seen how to collect, cleanse, and organize our data. However, we're still missing an essential part of big data analysis – data modeling. Data modeling has become a critical skill for the business analysts who are involved with discovering, analyzing, and specifying changes to how software systems create and maintain information. To better understand data modeling, let's quickly recap the concepts of OLTP and OLAP.
OLTP stands for Online Transactional Processing and is designed to serve as a persistent state store for front-end applications. They can quickly look up transactional procedures like INSERT, UPDATE, or DELETE.
Some common tasks asked of OLTP systems include:
These types of problems require a system that can look up and update one or more columns within one or many rows. The strength of OLTPs is that they support fast writes. A typical workload for OLTP is both frequent reads and writes, but the reads tend to be more of looking up a specific value rather than scanning all values to compute an aggregate.
Common OLTP systems are:
Alibaba Cloud provides the ApsaraDB for RDS service for OLTP systems, including both MySQL and PostgreSQL databases.
In contrast to an OLTP database, an OLAP database is designed to process large datasets quickly to answer questions about data.
Common use cases for an OLAP database are:
An OLAP database is optimized for scanning and performing computations across many rows of data for one or multiple columns. Since OLAP is optimized for analyzing data, basic transactional procedures like writes or updates tend to be done in infrequent batches, typically once a day or an hour. OLAP shines when it comes to reads and analytical calculations like aggregation. Several well-known OLAP systems are:
Alibaba Cloud provides OLAP services with HybridDB and DataWorks.
The term data model refers to two very different but related concepts: a description of data structure and the way data are organized.
Data modeling is the key to success in Business Intelligence (BI). It is paramount that the process is business-centered. Data modeling in BI is a way of mapping out all the different data sources and how these sources of data will fit together and flow into one another. We need to get the data from the places where a software or application stores the information into a centralized place (Data Warehouse) for querying and analyzing the data to derive business values.
Data warehousing is the process of constructing and using a data warehouse. A data warehouse is constructed by integrating data from multiple heterogeneous sources that support analytical reporting, structured and/or ad hoc queries, and decision making.
Facts: A fact table consists of facts of a business process. A fact table record captures a measurement or a metric.
Dimensions: A dimension table contains the textual descriptor of the business. The fields of dimension table are designed to satisfy these two important requirements:
For example, if we were to examine "Sales Revenue by Product", we would most probably see this structure: Sales Revenue (Fact) and Product (Dimension).
Schema is a logical description of the entire database. It includes the name and description of records of all record types including all associated data-items and aggregates. Like a database, a data warehouse also requires maintaining a schema. A database uses relational model, while a data warehouse uses Star and Snowflake schema.
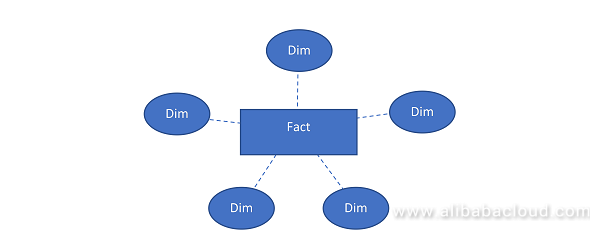
Star Schema: In Star Schema, the dimension is represented with only one-dimension table. Each dimension table is connected to only one Fact Table in star like structure.
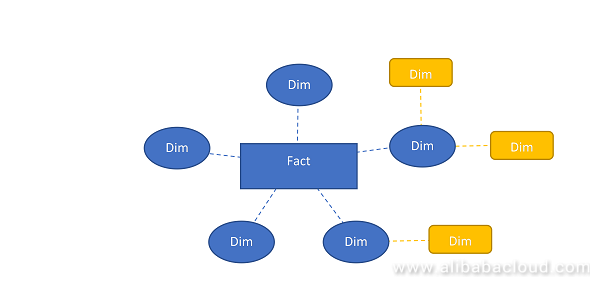
Snowflake Schema: Unlike Star schema, the dimensions table in a snowflake schema are normalized. The normalization splits up the data into additional tables.
Before entering the practical session of modelling the data, we need to know about the process flow of Quick BI.
The basic work flow of Quick BI is as follows:
Note: Quick BI supports OLAP Data modelling, semantics such as dimensions (dates and locations), measures, star schema, and snowflake schema. Allows you to define calculated fields. The product allows you to edit the existing SQL script of the data source to customize your dimensions and measures.
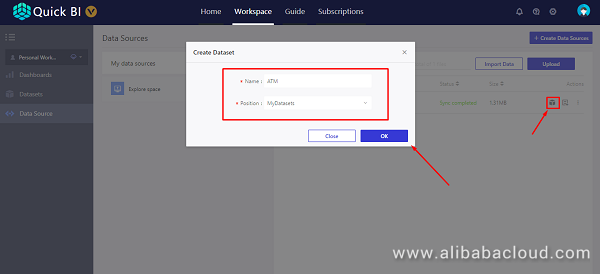
We will look at our first use case, ATM Dataset. We already ingested the data to the Quick BI. We are going to model the data and for that you need to save the data as dataset.
Procedure for creating data set from file:
Modeling the data:
We are going to model the data by editing the dataset accordingly to meet the requirements of business scenario, such as joining the two tables or creating a column.
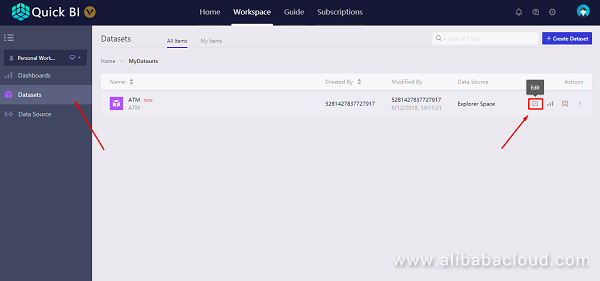
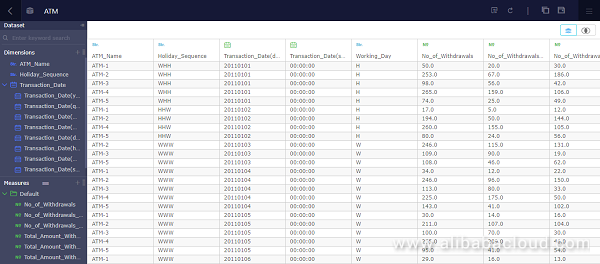
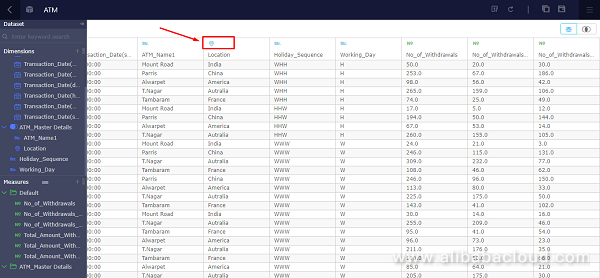
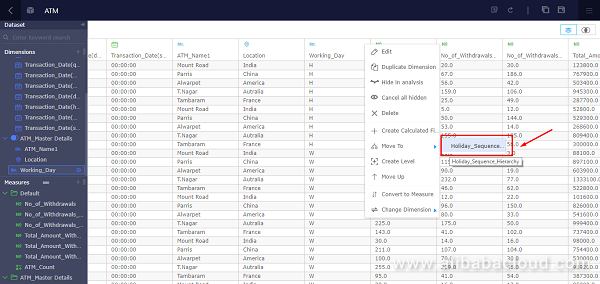
Changing the Dimension or Measure Name:
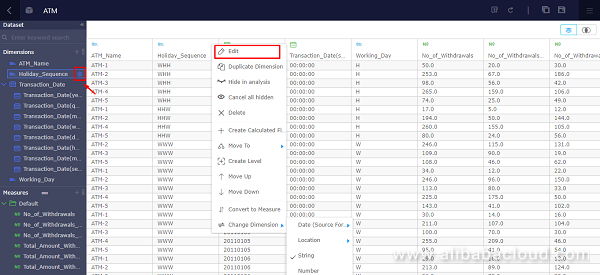
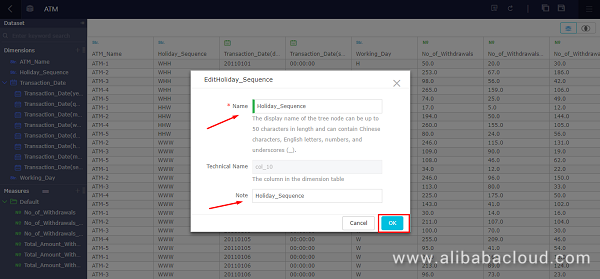
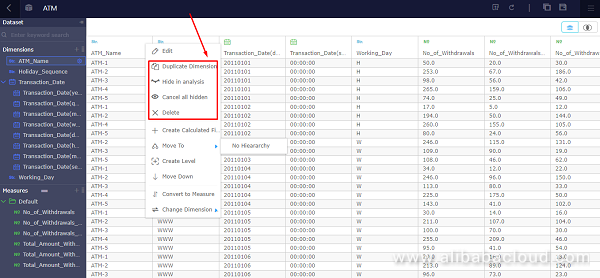
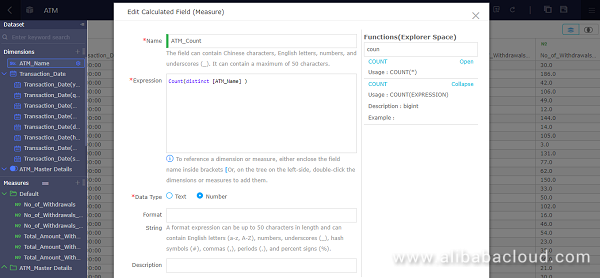
Basic Functions:
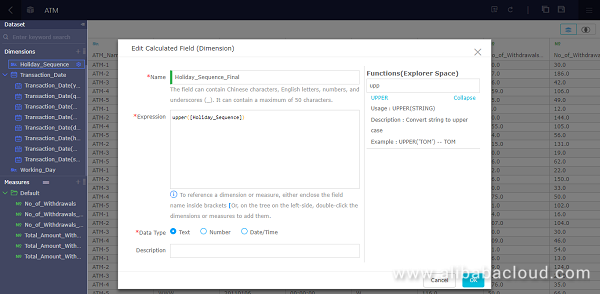
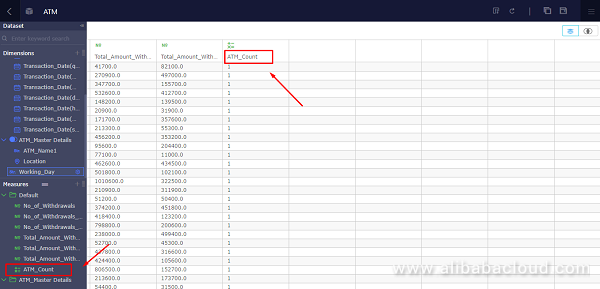
Creating a Calculated Column (Dimension)
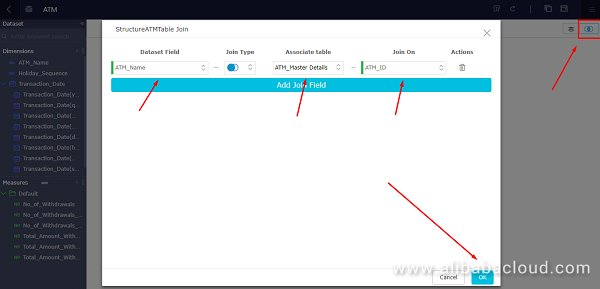
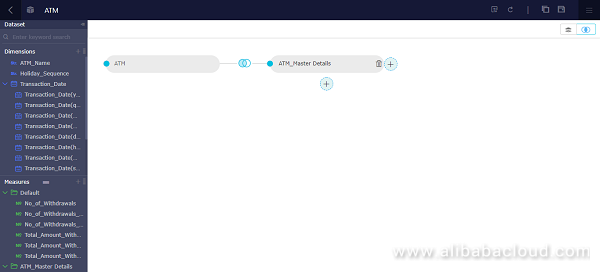
Joining the dataset:
Let's look at the ATM_Master Details
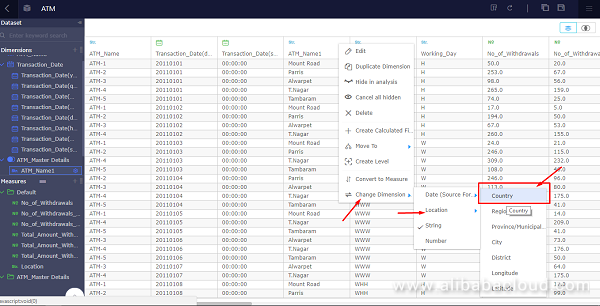
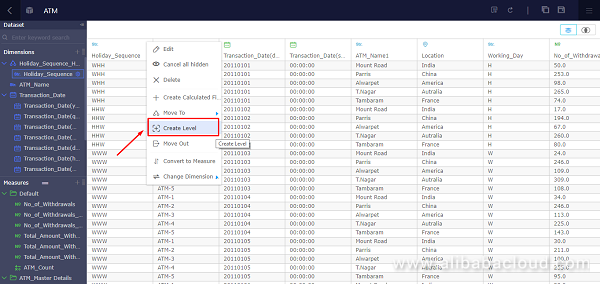
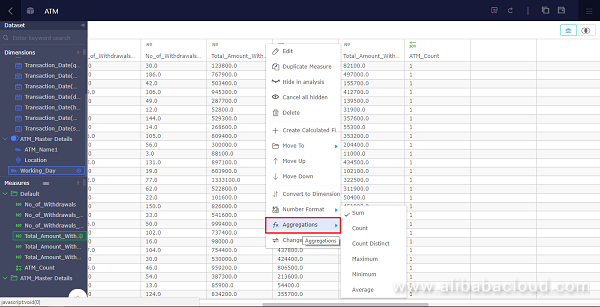
Changing the Aggregation Type:
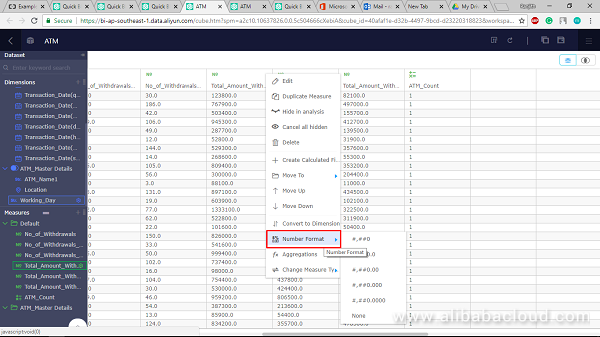
We can apply the same concepts to our next use case, Customer360. The steps are similar, we just need to replace the ATM data to perform all the basic tasks for data modelling. With this understanding I think we can model the data to our business scenario.
If you followed the steps correctly, you should have successfully modeled your data in Quick BI as per the demands of your businesses. In my opinion, this is the toughest part in the process of deciphering data to uncover hidden insights. We will explore how we can visualize our data and narrate data stories in future articles of this multi-part series.
Highlights of the Computing Conference 2018 – Empowering the Economy through Data and Technology

2,605 posts | 747 followers
FollowAlibaba Clouder - March 1, 2019
Alibaba Clouder - March 1, 2019
Alibaba Clouder - August 13, 2018
Alibaba Clouder - October 9, 2018
Alibaba Clouder - July 15, 2020
Shane Duggan - March 8, 2023

2,605 posts | 747 followers
Follow Quick BI
A new generation of business Intelligence services on the cloud
Learn More DataV
DataV
A powerful and accessible data visualization tool
Learn More MaxCompute
Conduct large-scale data warehousing with MaxCompute
Learn MoreMore Posts by Alibaba Clouder