By Lishan
Observability is one of the biggest challenges faced by cloud-native applications. Observability can help us understand the current state of the system and serve as the basis for application self-healing, auto scaling, and intelligent O&M.
Microservice applications are self-contained and should have their own observability in the cloud-native architecture, which can be easily managed and explored by the system. At first, the applications should have the ability to visualize their own health status.
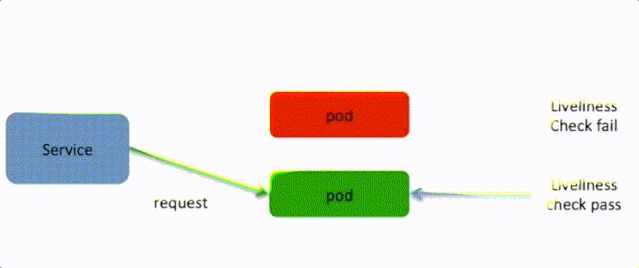
Business applications can provide a liveness probe in Kubernetes that can detect application readiness using TCP, HTTP, or command line. Kubernetes regularly accesses the address for HTTP-like probes. If the return code of the address is not from 200 to 400, the container is considered unhealthy and will be killed, and a new container will be built.

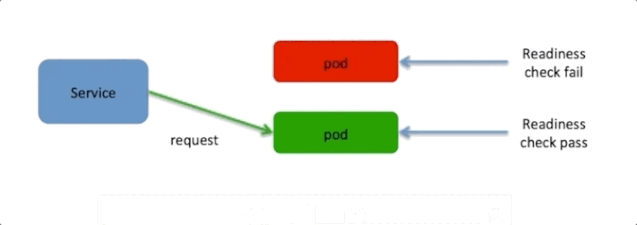
For applications that start slowly, Kubernetes supports a readiness probe for business containers to avoid importing traffic before applications start. Kubernetes regularly accesses the address for HTTP probes. If the return code of the address is not from 200 to 400, the container cannot provide external services, and requests will not be scheduled to the container.

At the same time, observability probes have been built into the new microservices model. For example, two new actuator addresses, /actuator/health/liveness and /actuator/health/readiness, have been released in SpringBoot 2.3. The /actuator/health/liveness is used as a liveness probe, and the /actuator/health/readiness is used as a readiness probe. Business applications can use the Spring system event mechanism to read, subscribe to, and modify Liveness State and Readiness State. Therefore, the Kubernetes platform can perform more accurate self-healing and traffic management.
Please refer to this link for more information.

Problems related to stability, performance, and security may occur anywhere in cloud-native application systems. Therefore, it is required to ensure observability capability in the entire procedure. Different layers need to be covered (such as the infrastructure layer, PaaS layer, and application layer), and observability data can be correlated, aggregated, queried, and analyzed among different systems.
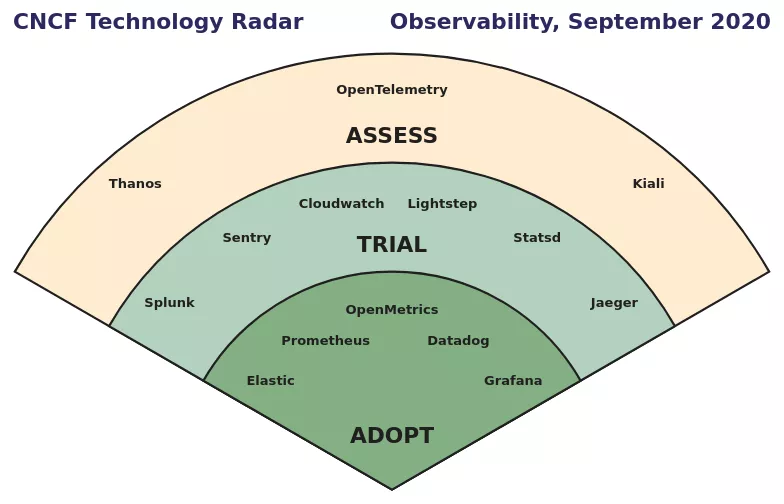
The observable field of software architecture has promising prospects, and many technological innovations have emerged. CNCF released a cloud-native technology radar observability in September 2020.

Among them, Prometheus has become one of the preferred open-source monitoring tools of cloud-native applications for enterprises. Prometheus fosters an active community of developers and users. The dependency on micrometer-registry-prometheus is introduced in the Spring Boot application architecture to allow monitoring metrics of applications to be collected by Prometheus service. Please refer to this document for more information.
OpenTracing is an open-source project of CNCF in the field of distributed tracing. It is a technology-neutral distributed tracing specification that provides a unified interface, allowing developers to integrate one or more distributed tracing implementations in their services. Jaeger is an open-source distributed tracing system for Uber. It is compatible with the OpenTracing standard and hit graduation status in CNCF. In addition, OpenTelemetry is a potential standard. It attempts to integrate the two projects of OpenTracing and OpenCensus to form a unified technical standard.
Current applications do not have complete observability for many existing business systems. The new service mesh technology can become a new way to improve the observability of systems. Mesh can obtain performance metrics for inter-service calls by using request interception of the data plane proxy. In addition, you only need to add the message header that needs to be forwarded to the service caller application to obtain complete tracing analysis information on the service mesh. This approach simplifies the construction of observability and allows existing applications to be integrated into the cloud-native observability system at a low cost.
Alibaba Cloud provides a wide range of capabilities for observability. Trace of Log Service provides support for OpenTracing and OpenTelemetry standards, such as logging, monitoring, tracing, LogAudit, log query, alerting, and other abilities. O&M engineers can obtain these capabilities within one service. ARMS offers application monitoring and Prometheus hosting services, allowing developers to avoid the need to focus on the high availability and capacity challenges of systems. Observability is the foundation of AIOps and will play a more important role in the IT application architecture of enterprises in the future.

1,393 posts | 492 followers
FollowAlibaba Cloud Community - March 8, 2022
Alibaba Cloud Community - June 10, 2022
Alibaba Cloud Community - May 12, 2022
Alibaba Cloud Community - March 8, 2022
Alibaba Cloud Native Community - July 22, 2022
Rupal_Click2Cloud - September 8, 2023

1,393 posts | 492 followers
Follow DevOps Solution
Accelerate software development and delivery by integrating DevOps with the cloud
Learn More Alibaba Cloud Flow
An enterprise-level continuous delivery tool.
Learn More Microservices Engine (MSE)
MSE provides a fully managed registration and configuration center, and gateway and microservices governance capabilities.
Learn More Architecture and Structure Design
Customized infrastructure to ensure high availability, scalability and high-performance
Learn MoreMore Posts by Alibaba Cloud Community