By Zhaofeng Zhou (Muluo)
A series of articles on the analysis of open-source time series databases have been completed. These articles compare and analyze Hbase-based OpenTSDB, Cassandra-based KairosDB, BlueFlood and Heroic, and finally InfluxDB that ranks first among TSDBs. InfluxDB is a purely self-developed TSDB. When reviewing its relevant materials, I was more interested in the bottom-layer TSM, a storage engine optimized for time series data scenarios based on the idea of LSM. The materials share the whole process of InfluxDB from the initial use of LevelDB to its replacement with BoltDB, and finally to the decision of the self-developed TSM, profoundly describing the pain points of each stage and the core problems to be solved in the transition to the next stage, as well as the core design ideas of the final TSM. I like this kind of sharing, which tell you the whole process of technological evolution step by step, instead of directly telling you what technology is the best. The profound analysis of the problems encountered at each stage, the reason for making the final technological choice and so on, are impressive and many things can be learned.
However, the InfluxDB TSM is not described in enough detail, and it focuses more on the description of policies and behaviors. I recently saw an article "Writing a Time Series Database from Scratch". Although the content is somewhat inconsistent with the title, it does introduce some really useful skills and experiences that describe the design idea of a TSDB storage engine. In addition, this storage engine is not a concept or toy, but is actually applied to production. It is a completely rewritten new storage engine in Prometheus 2.0, released in November 2017. This new storage engine claims to have brought "huge performance improvements". Due to significant changes, backward compatibility can not be achieved, but it is estimated that it really brings a lot of surprises, otherwise there would be no such statement.
This article is mainly an interpretation of the article mentioned above, most of which is from the original text, with a few deletions. For more details, see the original English text. I'd welcome any corrections if I've misunderstood anything.
Similar to other mainstream time series databases (TSDBs), Prometheus uses metric names, labels (similar to tags), and metric values in data model definition. Every time series is uniquely identified by its metric name and a set of key-value pairs, which are also known as labels. Prometheus supports querying for time series based on labels, using simple and complex conditions. The storage engine design mainly considers data storage (more writes than reads), data retention, and data query based on the characteristics of the time series data. Prometheus has not yet involved data analysis.

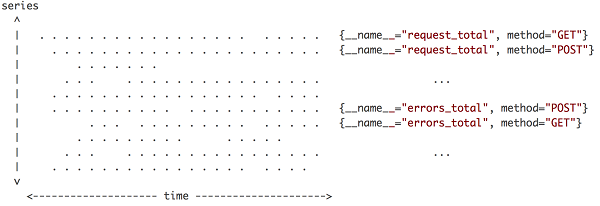
The above picture is a simple view of the distribution of data points, with the horizontal axis being time and the vertical axis being the timeline. Points in the region are data points. Every time Prometheus retrieves data, it receives a vertical line in the area as shown in the picture. This expression is very vivid. Each timeline generates only one data point each time, but there are many timelines to generate time points concurrently. Connecting these data points gives you a vertical line. This feature is very important, because it affects the optimization strategy for data writing and compression.
This article mainly describes some design ideas of the V3 storage engine, the latest version of the V2 storage engine. The V2 storage engine stores data points generated by each timeline separately into different files. We will discuss some topics based on this design:
The V2 storage engine provides some good optimization strategies, which mainly include writing data in larger chunks and hot data memory caching. These two optimization strategies are passed down to V3. V2 also has many drawbacks:
With regard to the timeline indexes, the V2 storage engine uses LevelDB to store the mapping relations between labels and timelines. When the number timelines increases to a certain degree, the query efficiency becomes very low. Generally, the timeline base number is relatively small. Because the application environment rarely changes, and the timeline base number remains stable when the operation is stable. However, with improper label settings, for example, a dynamic value (such as the program version number) is used as the label, the label value changes every time the application is upgraded. As time goes by, there will be more and more inactive timelines (known as series churn in the Prometheus context). The size of timelines becomes larger and larger, affecting index query efficiency.
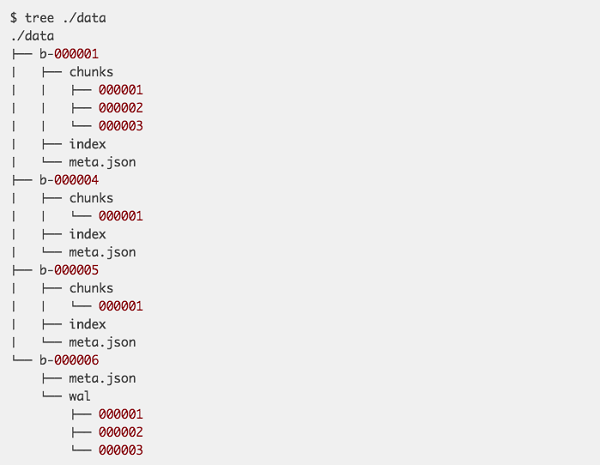
The V3 engine was completely redesigned to address problems with the V2 engine. The V3 engine can be seen as a simplified version of LSM that has been optimized for time-series data scenarios. It can be understood with the LSM design ideas. Let's first look at the file directory structure of the V3 engine.

All data is stored in the data directory. At the top level of the data directory, we have a sequence of numbered blocks, prefixed with 'b-'. Each block holds a file containing an index, a chunks directory, and a meta.json file. Each "chunks" directory holds raw chunks of data points for various series. The chunk of V3 is the same as the chunk of V2. The only difference is that, a chunk of v3 contains a lot of timelines, not just one. Index is the index of chunks under a block, which can be used to rapidly position a timeline and the chunk of the data based on a label. meta.json is a simple description file that simply holds human-readable information about the block to easily understand the state of our storage and the data it contains. To understand the design of the V3 engine, you only need to understand a few questions: 1. What is the storage format of a chunk file? 2. What is the index storage format and how to achieve fast search? 3. Why does the last block contain a "wal” directory instead of chunks?

Prometheus divides data into multiple non-overlapping blocks by the time dimension. Each block acts as a fully independent database containing all time-series data for its time window. Every block of data is immutable after it is dumped to chunk files. We can only write new data to the most recent block. All new data is written to an in-memory database. To prevent data loss, all incoming data is also written to a temporary write ahead log (WAL).
V3 completely borrows the design idea of LSM, and has made some optimizations based on the time series data features. There are many benefits:

In V3, blocks are cut in a reasonable interval of two hours. This interval can neither be too long nor too short. A longer interval requires a larger memory, because you have to keep data for more than two hours. A shorter interval results in too many blocks, and you have to query more files than necessary. The two-hour interval is determined based comprehensive consideration. However, when querying data with a larger time range, it is inevitable to query multiple files. For example, a week-long query may require querying 84 files. Similar to LSM, V3 uses a compaction strategy for query optimization. It merges small blocks into larger blocks. It can also modify existing data along the way, for example, dropping deleted data, or restructuring sample chunks for improved query performance. The cited article does not describe much about the compaction of V3. If interested, you can take a look at how InfluxDB achieves this. InfluxDB has a variety of compaction strategies which are applicable for different situations.

The above example is a schematic diagram of expired data deletion in V3, which is much simpler than V2. If the entire data block has expired, we can delete the folder directly. However, for blocks with only partially expired data, we cannot delete the entire folder. We have to wait for the expiration of all data, or perform compaction. Note that, the older data gets, the larger the blocks may become as we keep compacting previously compacted blocks. An upper limit has to be applied so blocks don't grow to span the entire database. Generally, this limit is set based on the retention window.
Basically, that's all about the data storage design of Prometheus. It's relatively clear and simple. Similar to other TSDBs, Prometheus also has an index. The index structure of V3 is relatively simple. Here I'd like to directly use the example given in the cited article:


Based on the description of that article, V3 does not use LevelDB like V2 does. In a persisted block, the index is immutable. For the most recent block that we write data to, V3 holds all the indexes in memory, and maintains an in-memory structure. These indexes are persisted to on-disk files when the block is closed. This is very easy. By maintaining the mapping relationship between the timelines and IDs and between labels and ID lists, we can ensure high query efficiency. Prometheus has an assumption that: "a real-world dataset of ~4.4 million series with about 12 labels each has less than 5,000 unique labels". All these occupy a surprisingly small amount of memory. InfluxDB uses a similar strategy, while other TSDBs use ElasticSearch as the indexing engine.
For time series data which is written more than read, the LSM storage engines have a lot of advantages. Some TSDBs, such as Hbase and Cassandra, are distributed databases based directly on open source LSM engines. Some are developed based on LevelDB or RocksDB. There are also some fully self-developed TSDBs represented by InfluxDB and Prometheus. The reason for the existence of so many different types of TSDBs is that we can still do a lot to optimize the specific scenario of time series data. For example, index and compaction strategy. The design idea of the Prometheus V3 engine is very similar to that of InfluxDB. Their optimization ideas are highly consistent. There will be more changes upon the emergence of new requirements.
A Comprehensive Analysis of Open-Source Time Series Databases (3)

57 posts | 12 followers
FollowAlibaba Cloud Storage - April 25, 2019
Alibaba Cloud Storage - April 25, 2019
ApsaraDB - July 23, 2021
Alibaba Cloud Storage - April 25, 2019
Alibaba Cloud Community - March 9, 2023
Alibaba Cloud Storage - March 3, 2021

57 posts | 12 followers
Follow Time Series Database for InfluxDB®
A cost-effective online time series database service that offers high availability and auto scaling features
Learn More Time Series Database (TSDB)
TSDB is a stable, reliable, and cost-effective online high-performance time series database service.
Learn More Tablestore
A fully managed NoSQL cloud database service that enables storage of massive amount of structured and semi-structured data
Learn More Database for FinTech Solution
Leverage cloud-native database solutions dedicated for FinTech.
Learn MoreMore Posts by Alibaba Cloud Storage
5574758653032419 May 23, 2019 at 11:12 pm
I'd recommend taking a look at VictoriaMetrics storage. The following links may be quite helpful:- source code - https://github.com/VictoriaMetrics/VictoriaMetrics- https://medium.com/@valyala/how-victoriametrics-makes-instant-snapshots-for-multi-terabyte-time-series-data-e1f3fb0e0282- https://medium.com/@valyala/victoriametrics-achieving-better-compression-for-time-series-data-than-gorilla-317bc1f95932- https://medium.com/@valyala/wal-usage-looks-broken-in-modern-time-series-databases-b62a627ab704- https://medium.com/@valyala/mmap-in-go-considered-harmful-d92a25cb161d