By Ford, FDD architect, with 12 years of software development experience, mainly responsible for the design of cloud native architecture with focus on infrastructures, Service Mesh advocate and practitioner of continuous delivery and agility.
In recent years, many businesses have experienced unexpected growth, which has increased the pressure on traditional software architecture. To cope with this, many have started adopting microservices for their software architecture. Consequently, the number of online applications has multiplied after horizontal and vertical expansion. In traditional monolithic application scenarios, the methods of log query and analysis by using tail, grep, and awk commands cannot meet new requirements. In addition, these methods cannot cope with the huge increase of application logs and the complex operating environment of distributed projects in cloud native architecture.
During the transformation of the cloud native architecture, observability has become the enterprise-level issue for quick fault locating and diagnosis, under complex dynamic cluster environments. Logs are particularly important as one of the three major elements that can be monitored. The three elements are logs, metrics, and traces. The services of log system are no longer limited to application system diagnosis. Now business, operation, BI, audit, and security are also included. The ultimate goal of the log platform is to achieve digitization and intelligence of all aspects in the cloud native architecture.
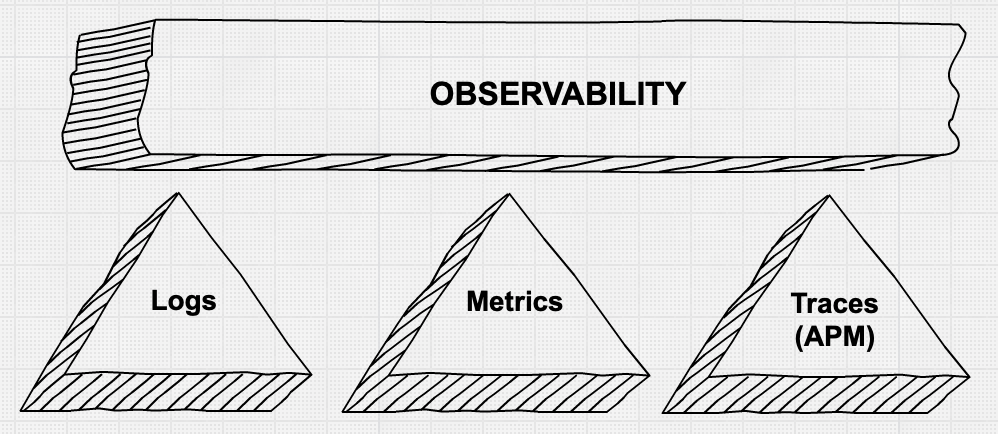
Three major monitoring elements: logs, metrics, and traces
The log solutions based on cloud native architectures are quite different from that based on physical machines and virtual machines. For example:
Log collection solutions in the cloud native architecture
| Solution | Advantage | Disadvantage |
| Solution 1: Integrate log collection components in images of every application, such as logback-redis-appender. | Easy deployment. No special configuration in yaml files of Kubernetes. Flexible customization of log collection rules for each application. | Strong coupling. Intrusion into applications. Inconvenient upgrade and maintenance of application and log collection components. Over large images. |
| Solution 2: Create a separate log collection container in application's pod to run together with the application's container. | Low coupling, high scalability, and easy maintenance and upgrade. | Complex procedures for separate configuration in yaml files of Kubernetes. |
| Solution 3: Start a log collection pod on each work node in DaemonSet mode, and mount the logs of all pods to the host. | Complete decoupling, highest performance, and most convenient management. | Unified log collection rules, directories, and output methods are required. |
Based on the above advantages and disadvantages, we choose Solution 3. Solution 3 is selected because it balances scalability, resource consumption, deployment, and maintenance.
The following figures show the architectures of each solution.

Solution 1: Built-in collection components in applications for asynchronous collections
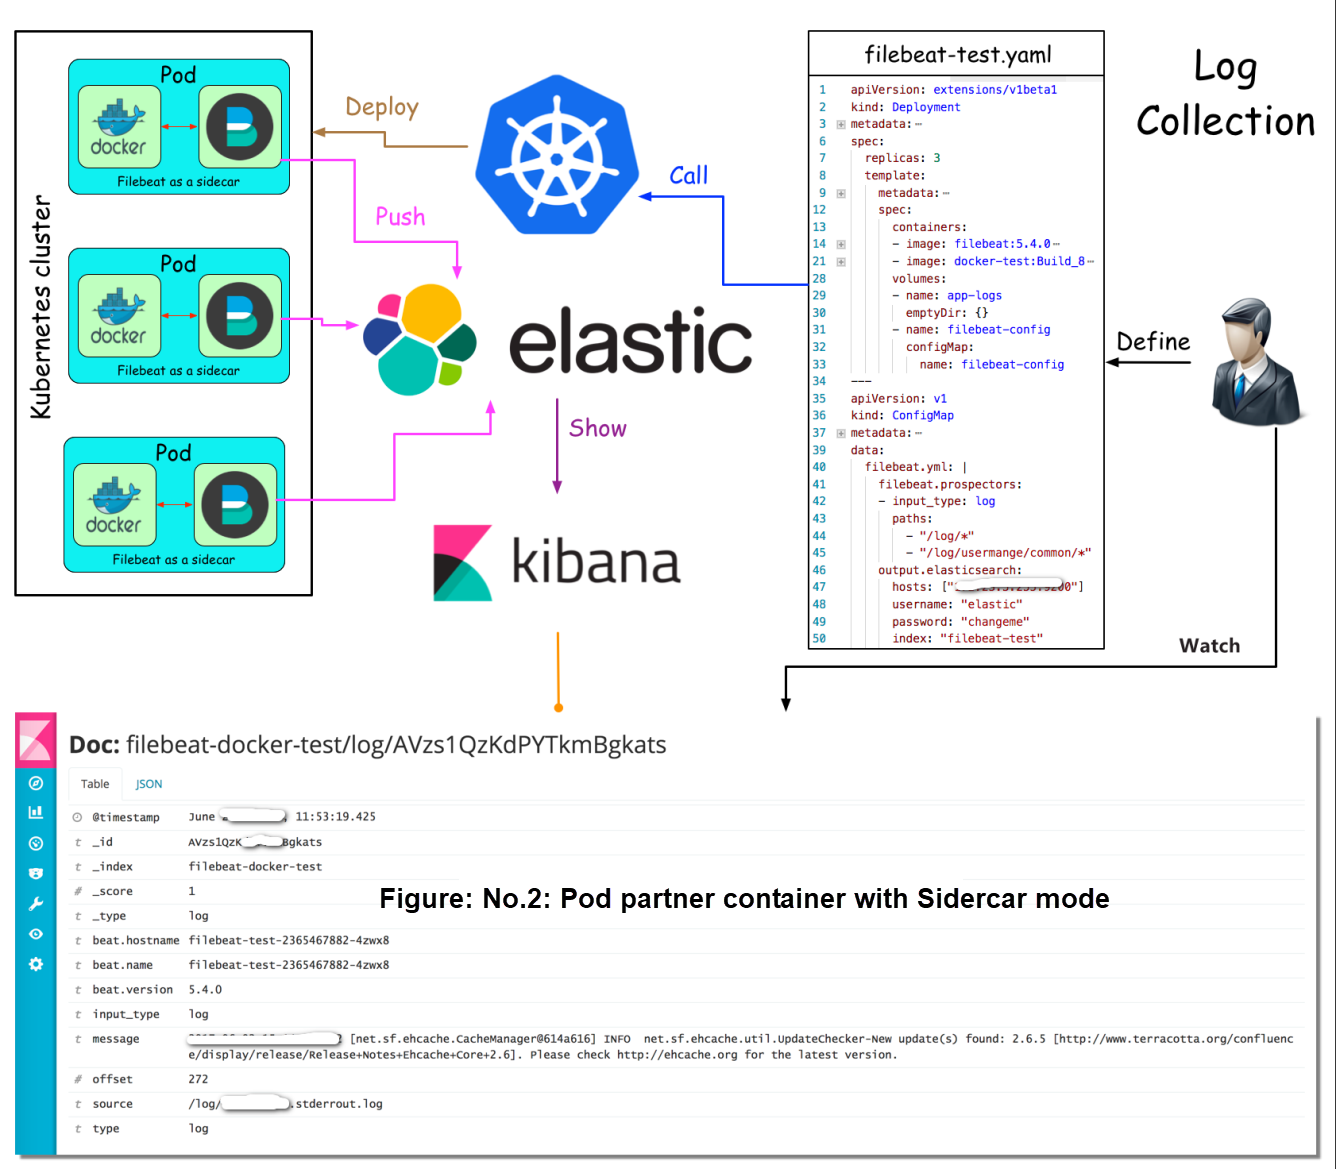
Solution 2: Pod partner container with Sidecar mode
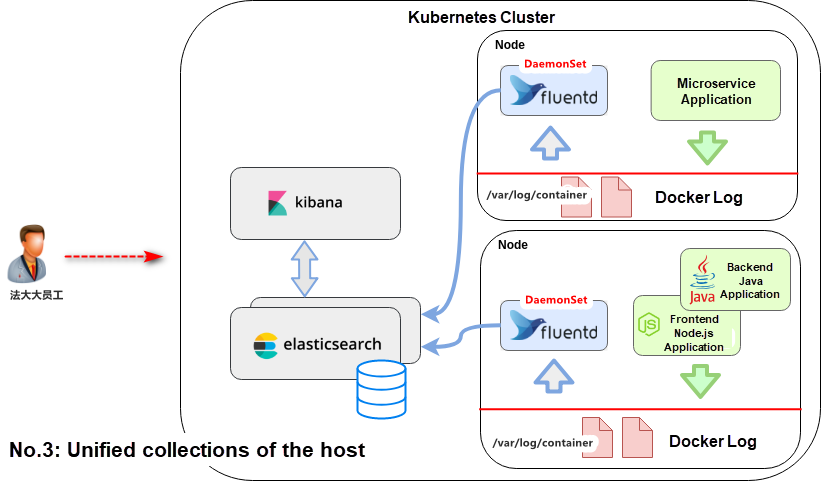
Solution 3: Unified collections of the host
When a cluster starts, a Fluent-bit agent is started on each machine in DaemonSet mode to collect logs and send them to Elasticsearch. Each agent mounts the directory /var/log/containers/. Then, the agent uses the tail plug-in of Fluent-bit to scan log files of each container and directly send these logs to Elasticsearch.
The log of /var/log/containers/ is mapped from the container log of a Kubernetes node, as shown in the following figures:
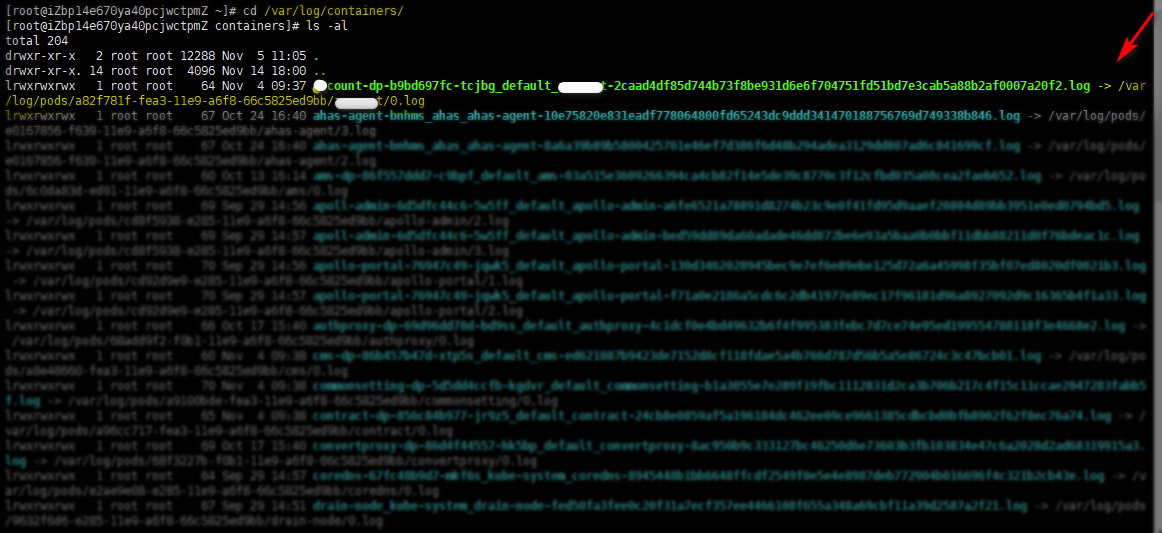

File path of the node in the directory of /var/log/containers/
Monitoring of Fluent-bit and Input configuration
    @INCLUDE input-kubernetes.conf
    @INCLUDE filter-kubernetes.conf
    @INCLUDE output-elasticsearch.conf

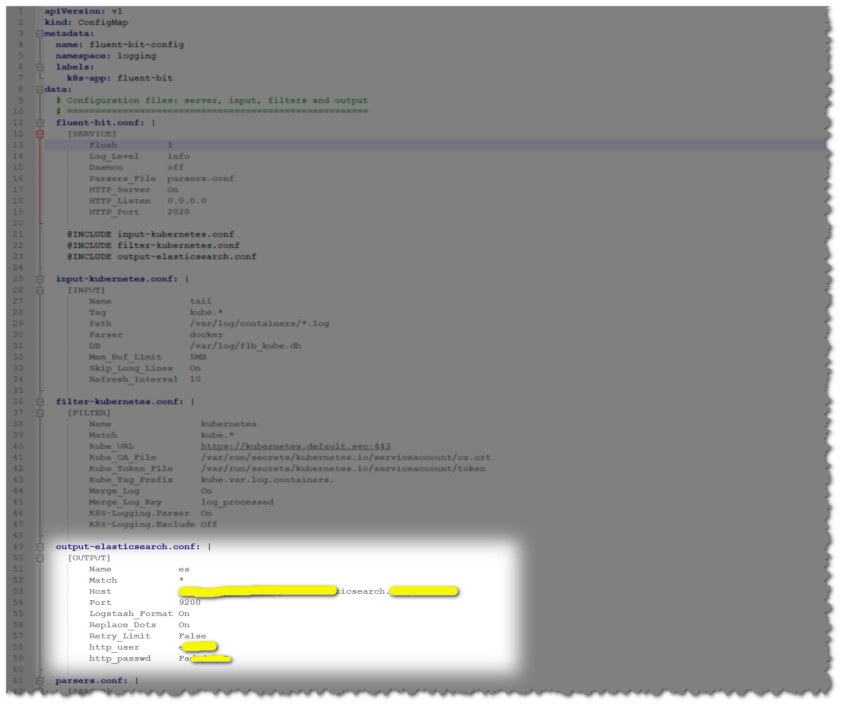
  input-kubernetes.conf: |
    [INPUT]
        Name              tail
        Tag               kube.*
        Path              /var/log/containers/*.log
        Parser            docker
        DB                /var/log/flb_kube.db
        Mem_Buf_Limit     5MB
        Skip_Long_Lines   On
        Refresh_Interval  10
The collection agent is deployed based on Kubernetes cluster. When nodes in the cluster are scaled out, Fluent-bit agents of new nodes are automatically deployed by kube-scheduler.
The current services of Elasticsearch and Kibana are provided by cloud vendors. The services provide the X-pack plug-in and support permission management feature which is only available in Business Edition.
1. Configure Fluent-bit collectors, including collectors for server, input, filters, and output.
2. Create RBAC permission of Fluent-bit in the Kubernetes cluster.
apiVersion: v1
kind: ServiceAccount
metadata:
  name: fluent-bit
namespace: loggingapiVersion: rbac.authorization.k8s.io/v1beta1
kind: ClusterRole
metadata:
name: fluent-bit-read
rules:
- apiGroups: [""]
resources:
- namespaces
- pods
verbs: ["get", "list", "watch"]apiVersion: rbac.authorization.k8s.io/v1beta1
kind: ClusterRoleBinding
metadata:
name: fluent-bit-read
roleRef:
apiGroup: rbac.authorization.k8s.io
kind: ClusterRole
name: fluent-bit-read
subjects:
- kind: ServiceAccount
name: fluent-bit
namespace: logging3. Deploy Fluent-bit on cluster nodes of Kubernetes in DaemonSet mode.
apiVersion: extensions/v1beta1
kind: DaemonSet
metadata:
  name: fluent-bit
  namespace: logging
  labels:
    k8s-app: fluent-bit-logging
    version: v1
    kubernetes.io/cluster-service: "true"
spec:
  template:
    metadata:
labels:
k8s-app: fluent-bit-logging
version: v1
kubernetes.io/cluster-service: "true"
annotations:
prometheus.io/scrape: "true"
prometheus.io/port: "2020"
prometheus.io/path: /api/v1/metrics/prometheus
    spec:
containers:
- name: fluent-bit
image: fluent/fluent-bit:1.2.1
imagePullPolicy: Always
ports:
  - containerPort: 2020
env:
- name: FLUENT_ELASTICSEARCH_HOST
  value: "elasticsearch"
- name: FLUENT_ELASTICSEARCH_PORT
  value: "9200"
volumeMounts:
- name: varlog
  mountPath: /var/log
- name: varlibdockercontainers
  mountPath: /var/lib/docker/containers
  readOnly: true
- name: fluent-bit-config
  mountPath: /fluent-bit/etc/
terminationGracePeriodSeconds: 10
volumes:
- name: varlog
hostPath:
  path: /var/log
- name: varlibdockercontainers
hostPath:
  path: /var/lib/docker/containers
- name: fluent-bit-config
configMap:
  name: fluent-bit-config
serviceAccountName: fluent-bit
tolerations:
- key: node-role.kubernetes.io/master
operator: Exists
effect: NoSchedule
- operator: "Exists"
effect: "NoExecute"
- operator: "Exists"
effect: "NoSchedule"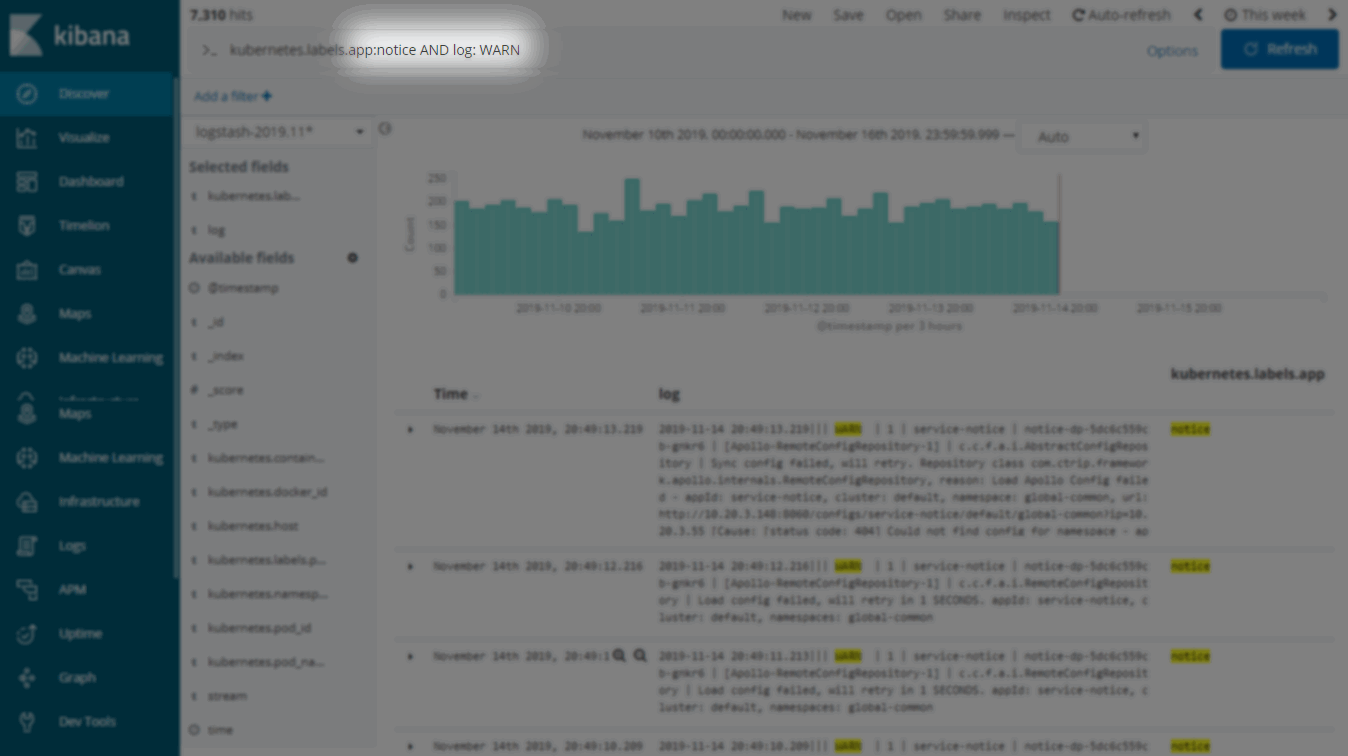
Log Query - Compound Query (AND OR)
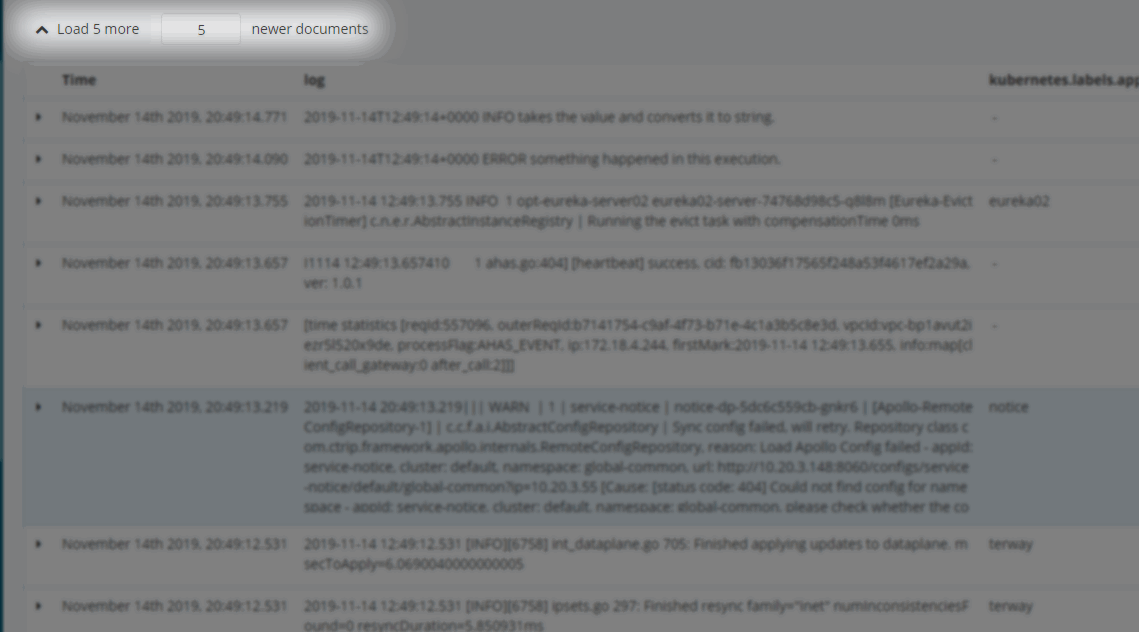
Log Query - Context Query
In the solution, Fluent-bit collects event audit logs of Kubernetes clusters and generates corresponding logs for status changes caused by kube-apiserver operations. The following kubernetes-audit-policy.yaml defines which audit logs are collected. To do that, the reference of this configuration in kube-api startup file is needed by using --audit-policy-file.
apiVersion: audit.k8s.io/v1 # This is required.
kind: Policy
# Don't generate audit events for all requests in RequestReceived stage.
omitStages:
  - "RequestReceived"
rules:
  # Log pod changes at RequestResponse level
  - level: RequestResponse
    resources:
    - group: ""
      # Resource "pods" doesn't match requests to any subresource of pods,
      # which is consistent with the RBAC policy.
      resources: ["pods"]
  # Log "pods/log", "pods/status" at Metadata level
  - level: Metadata
    resources:
    - group: ""
      resources: ["pods/log", "pods/status"]

  # Don't log requests to a configmap called "controller-leader"
  - level: None
    resources:
    - group: ""
      resources: ["configmaps"]
      resourceNames: ["controller-leader"]

  # Don't log watch requests by the "system:kube-proxy" on endpoints or services
  - level: None
    users: ["system:kube-proxy"]
    verbs: ["watch"]
    resources:
    - group: "" # core API group
      resources: ["endpoints", "services"]

  # Don't log authenticated requests to certain non-resource URL paths.
  - level: None
    userGroups: ["system:authenticated"]
    nonResourceURLs:
    - "/api*" # Wildcard matching.
    - "/version"

  # Log the request body of configmap changes in kube-system.
  - level: Request
    resources:
    - group: "" # core API group
      resources: ["configmaps"]
    # This rule only applies to resources in the "kube-system" namespace.
    # The empty string "" can be used to select non-namespaced resources.
    namespaces: ["kube-system"]

  # Log configmap and secret changes in all other namespaces at the Metadata level.
  - level: Metadata
    resources:
    - group: "" # core API group
      resources: ["secrets", "configmaps"]

  # Log all other resources in core and extensions at the Request level.
  - level: Request
    resources:
    - group: "" # core API group
    - group: "extensions" # Version of group should NOT be included.

  # A catch-all rule to log all other requests at the Metadata level.
  - level: Metadata
    # Long-running requests like watches that fall under this rule will not
    # generate an audit event in RequestReceived.
    omitStages:
      - "RequestReceived"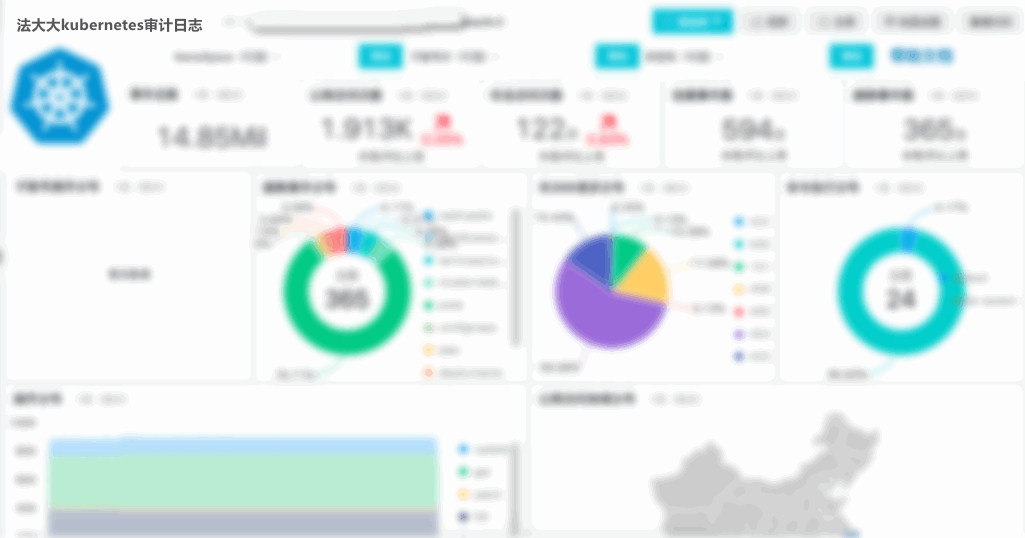
Audit log of Kubernetes clusters
As the distributed system in the cloud-native architecture grows complex, logs are becoming scattered. So, it is difficult to monitor application and troubleshoot, and the efficiency is low. The centralized log platform of Kubernetes cluster in this article aims to solve these problems. The collection, retrieval, and analysis of cluster logs, application logs, and security logs, and Web management are centrally controlled by the platform. It realizes quick troubleshooting, and become an important way to solve problems efficiently.
During production and deployment, the introduction of Kafka queue can be determined based on the business system capacity. In the offline environment, it doesn't have to introduce Kafka queue. Simple deployment is enough, and Kafka queue can be introduced when it needs to scale out the business system.
The services of Elasticsearch and Kibana in this article are provided by cloud vendors. In the considering of cost-saving factors, Helm can be chosen to quickly build offline development environments. The example for reference is as follows:
helm repo add incubator https://kubernetes-charts-incubator.storage.googleapis.com/
helm install --name elasticsearch stable/elasticsearch \
    --set master.persistence.enabled=false \
    --set data.persistence.enabled=false \
--namespace logginghelm install --name kibana stable/kibana \
--set env.ELASTICSEARCH_URL=http://elasticsearch-client:9200 \
--namespace loggingChaosBlade x SkyWalking: High Availability Microservices Practices

662 posts | 55 followers
FollowAlibaba Developer - June 30, 2020
Alibaba Cloud MaxCompute - July 14, 2021
Aliware - July 21, 2021
DavidZhang - December 30, 2020
DavidZhang - January 15, 2021
ApsaraDB - February 20, 2021

662 posts | 55 followers
Follow Managed Service for Grafana
Managed Service for Grafana displays a large amount of data in real time to provide an overview of business and O&M monitoring.
Learn More Bastionhost
A unified, efficient, and secure platform that provides cloud-based O&M, access control, and operation audit.
Learn More Simple Log Service
An all-in-one service for log-type data
Learn More Microservices Engine (MSE)
MSE provides a fully managed registration and configuration center, and gateway and microservices governance capabilities.
Learn MoreMore Posts by Alibaba Cloud Native Community