After you use OpenTelemetry to instrument an application and report the trace data to Managed Service for OpenTelemetry, Managed Service for OpenTelemetry starts to monitor the application. You can view the monitoring data of the application such as application topology, traces, abnormal transactions, slow transactions, and SQL analysis. This topic describes how to use OpenTelemetry to instrument a Swift application and report the trace data of the Swift application.
Before you begin
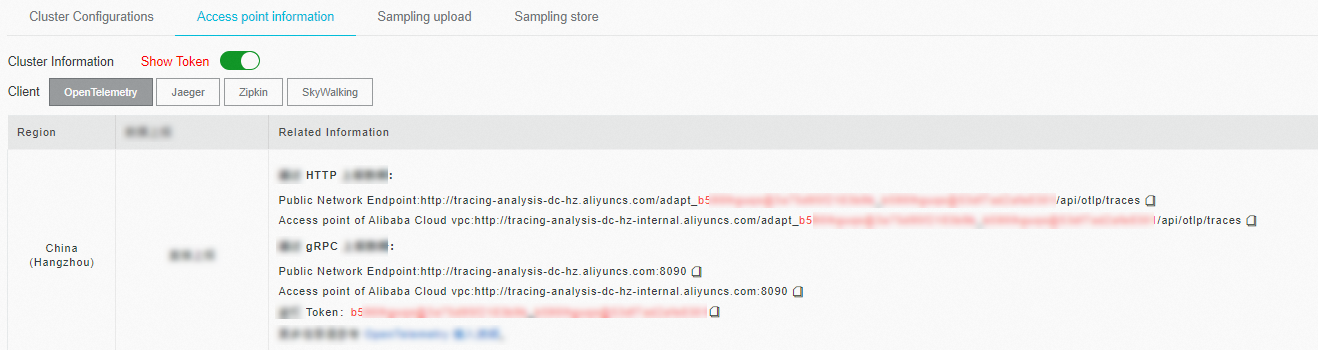
Log on to the Managed Service for OpenTelemetry console.
In the left-side navigation pane, click Cluster Configurations. On the page that appears, click the Access point information tab.
In the top navigation bar, select a region. In the Cluster Information section, turn on Show Token.
Set the Client parameter to OpenTelemetry.
Obtain an endpoint of OpenTelemetry in the Related Information column of the table in the lower part.
 Note
NoteIf your application is deployed in an Alibaba Cloud production environment, use a Virtual Private Cloud (VPC) endpoint. Otherwise, use a public endpoint.
Sample code
In this example, OpenTelemetry is used to report the trace data of a macOS command-line application written in Swift. The method used in this example also applies to iOS applications.
Download the sample code from opentelemetry-swift-demo.
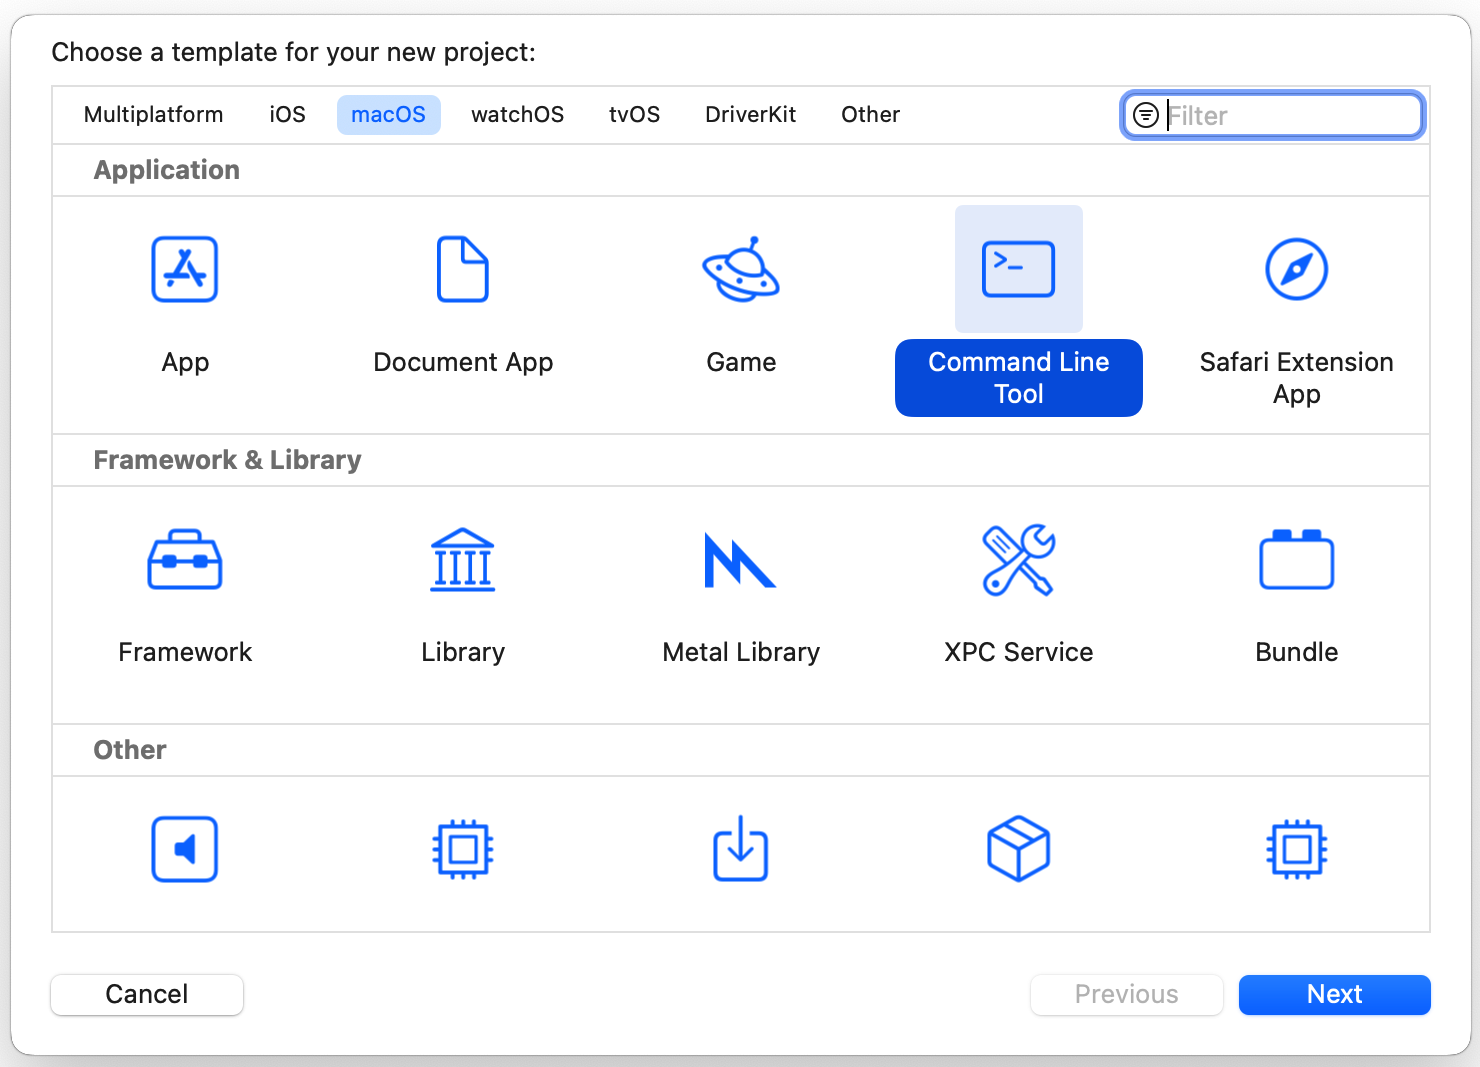
Step 1: Create an application and add dependencies
Select the type of the application that you want to create. For example, choose macOS > Command Line Tool.
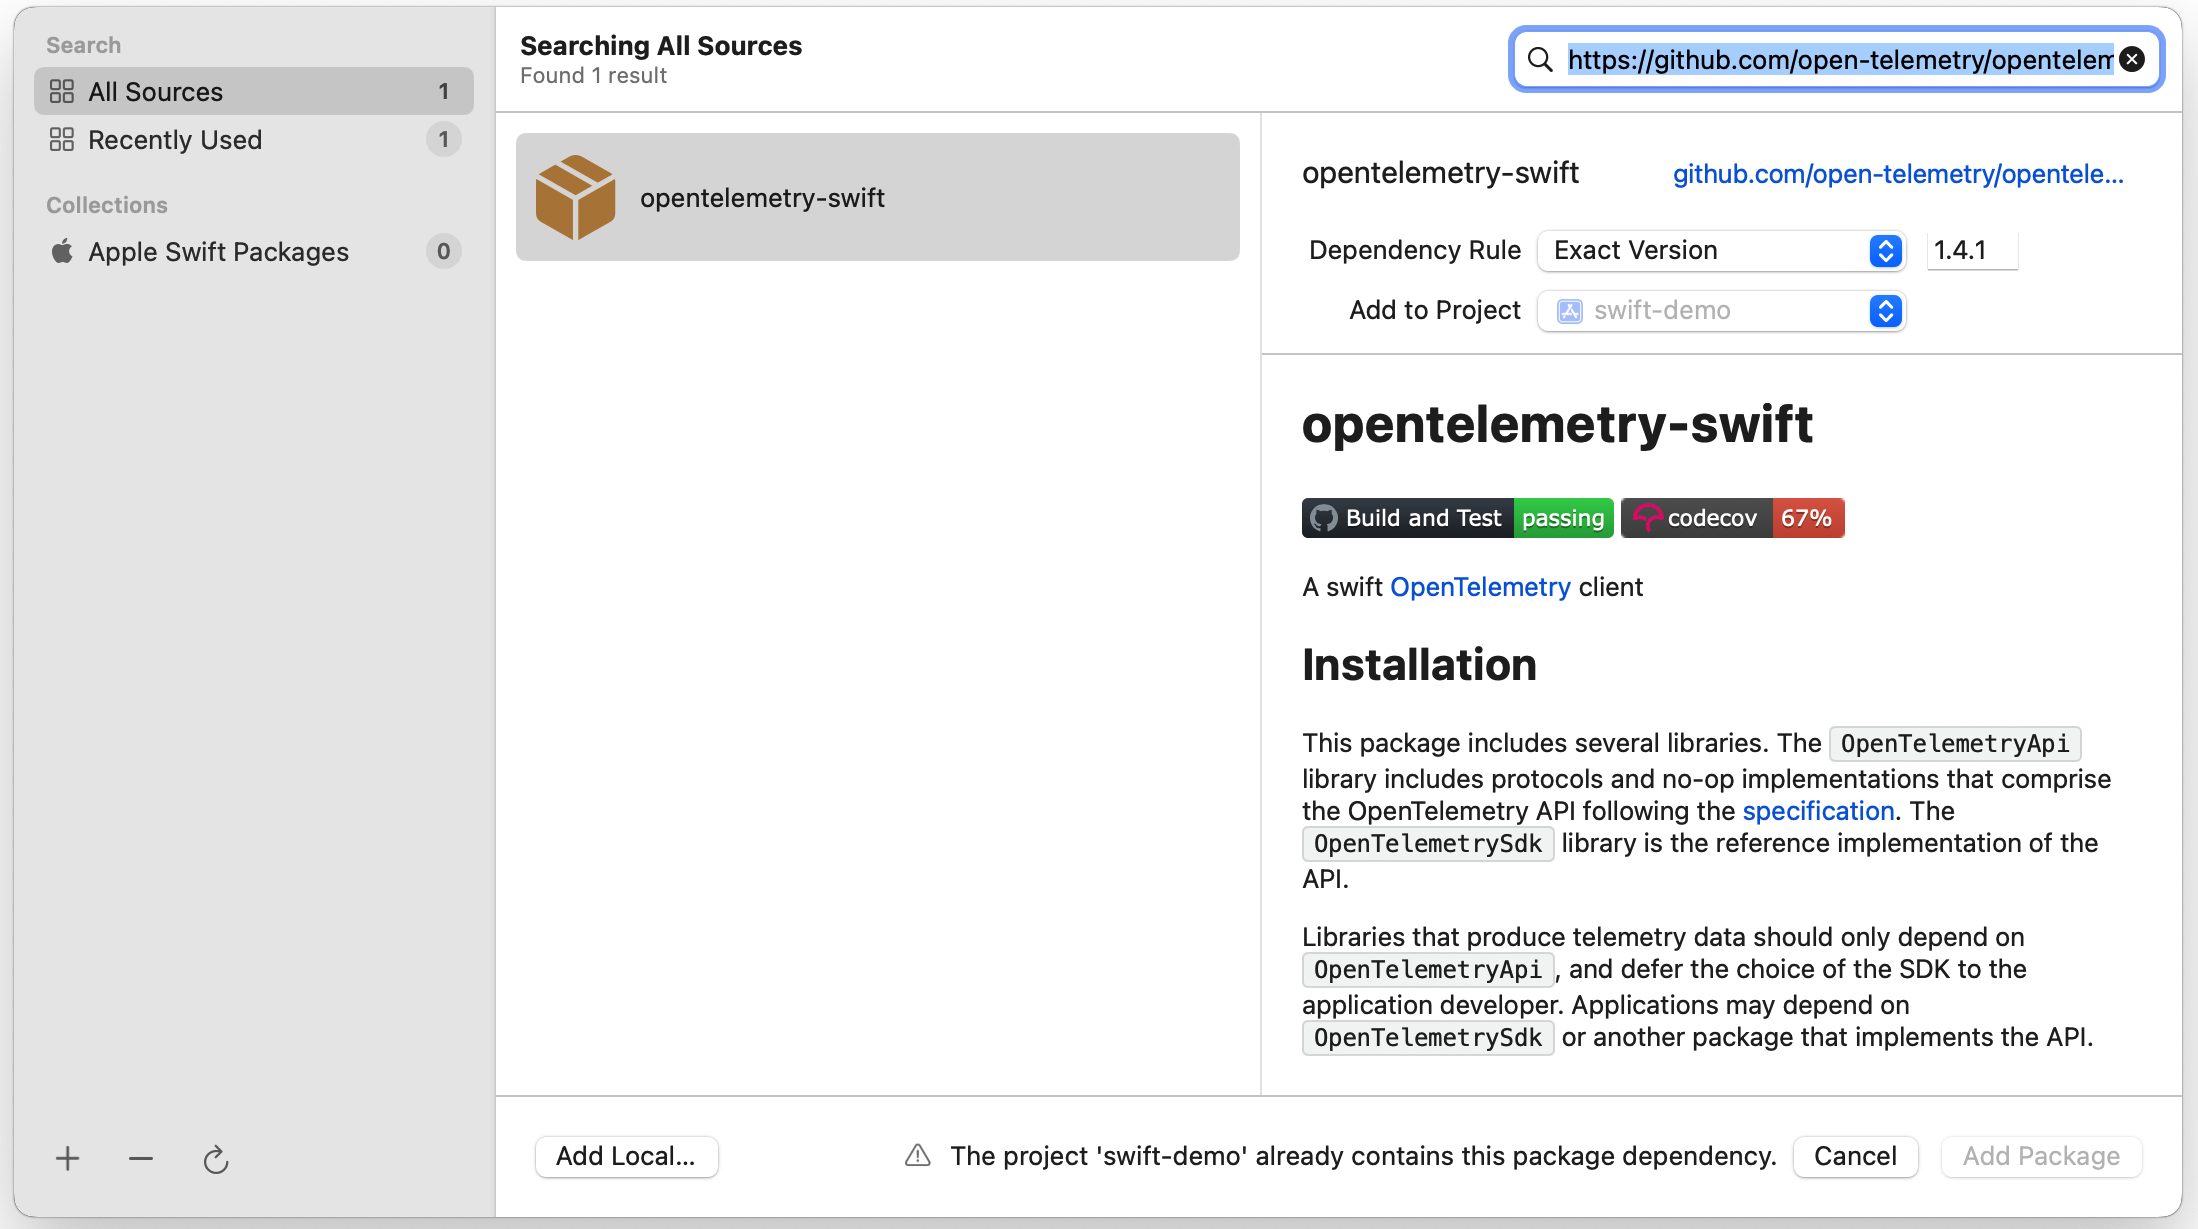
In XCode, choose , enter
https://github.com/open-telemetry/opentelemetry-swiftin the search box, and then select version 1.4.1.NoteIf you want to know more about versions, visit the opentelemetry-swift page on GitHub.
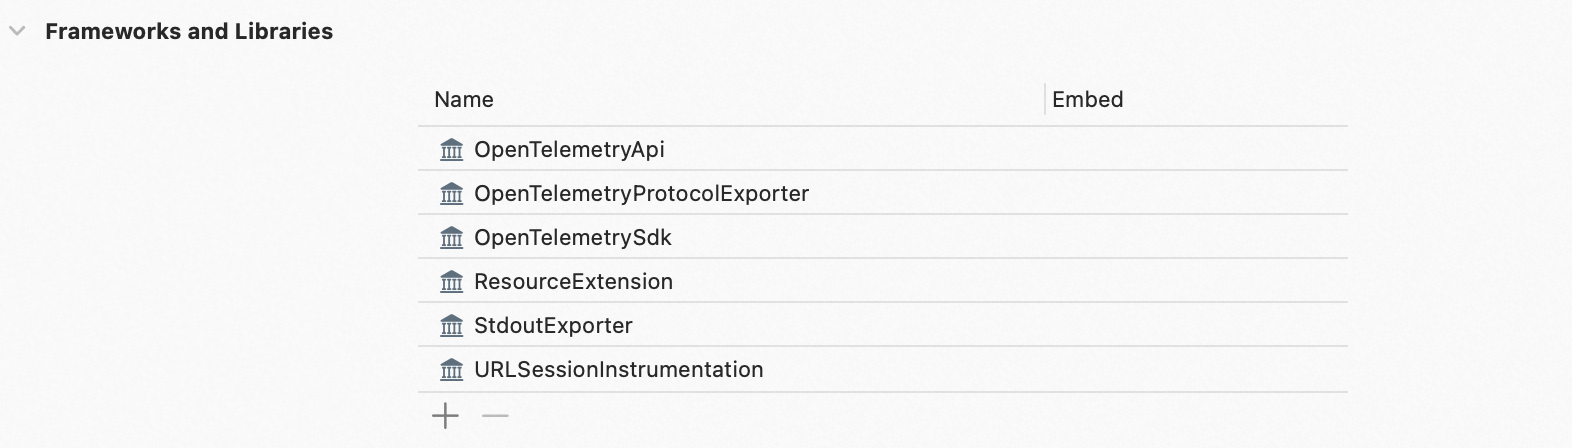
Select the required packages.
The following figure shows the packages that are used in this example.
Step 2: Initialize OpenTelemetry
Create an exporter to export monitoring data.
Select one of the following methods to report trace data:
Method 1: Report trace data by using the gRPC protocol
Replace
<gRPC-endpoint>and<gRPC-port>with the endpoint and port number obtained in the "Before you begin" section of this topic. In this example,host: "http://tracing-analysis-dc-hz.aliyuncs.com", port:8090is used.Replace
<your-token>with the authentication token obtained in the "Before you begin" section of this topic.
let grpcChannel = ClientConnection(
    configuration: ClientConnection.Configuration.default(
        target: .hostAndPort("<gRPC-endpoint>", 8090), // Specify the endpoint that does not contain the http:// prefix. In this example, tracing-analysis-dc-hz.aliyuncs.com is used.
        eventLoopGroup: MultiThreadedEventLoopGroup(numberOfThreads: 1)
    )
)

let otlpGrpcConfiguration = OtlpConfiguration(
    timeout: OtlpConfiguration.DefaultTimeoutInterval,
    headers: [
        ("Authentication","xxxxxx")
    ]

)
let otlpGrpcTraceExporter = OtlpTraceExporter(channel: grpcChannel, config: otlpGrpcConfiguration)
Method 2: Report trace data by using the HTTP protocol
Replace
<HTTP-endpoint>with the endpoint obtained in the "Before you begin" section of this topic. In this example,http://tracing-analysis-dc-hz.aliyuncs.com/adapt_xxxx@xxxx_xxxx@xxxx/api/otlp/tracesis used.let url = URL(string: "<HTTP-endpoint>") let otlpHttpTraceExporter = OtlpHttpTraceExporter(endpoint: url!)Method 3: Obtain trace data in the command line
let consoleTraceExporter = StdoutExporter(isDebug: true)
Obtain the tracer that is used to create a span.
Replace
<your-service-name>with the name of the application whose data you want to report and<your-host-name>with the hostname.Replace
<trace-exporter>with different values based on the method that you use to report trace data in Step 1.Method 1: Replace
<trace-exporter>withotlpGrpcTraceExporter.Method 2: Replace
<trace-exporter>withotlpHttpTraceExporter.Method 3: Replace
<trace-exporter>withconsoleTraceExporter.
// Specify the application name and the hostname.
let resource = Resource(attributes: [
    ResourceAttributes.serviceName.rawValue: AttributeValue.string("<your-service-name>"),
    ResourceAttributes.hostName.rawValue: AttributeValue.string("<your-host-name>")
])

// Configure the TracerProvider.
OpenTelemetry.registerTracerProvider(tracerProvider: TracerProviderBuilder()
                                     .add(spanProcessor: BatchSpanProcessor(spanExporter: <trace-exporter>)) // Report data to Managed Service for OpenTelemetry.
                                     .with(resource: resource)
                                     .build())

// Obtain the tracer that is used to create a span.
let tracer = OpenTelemetry.instance.tracerProvider.get(instrumentationName: "instrumentation-library-name", instrumentationVersion: "1.0.0")
Step 3: Create a span to track trace data
Create a span, configure attributes and an event for the span, and then obtain the trace ID of the span.
let span = tracer.spanBuilder(spanName: "first span").startSpan()
// Configure attributes.
span.setAttribute(key: "http.method", value: "GET")
span.setAttribute(key: "http.url", value: "www.aliyun.com")
let attributes = [
    "key": AttributeValue.string("value"),
    "result": AttributeValue.int(100)
]

// your code...

// Configure an event.
span.addEvent(name: "computation complete", attributes: attributes)

// Display the trace ID.
print(span.context.traceId.hexString)

// your code...

// End the current span.
span.end()
Create a nested span.
let parentSpan = tracer.spanBuilder(spanName: "parent span").startSpan()

// your code...

let childSpan = tracer.spanBuilder(spanName: "child span").setParent(parentSpan).startSpan()

// your code...

childSpan.end()

// your code...

parentSpan.end()
Start the application.
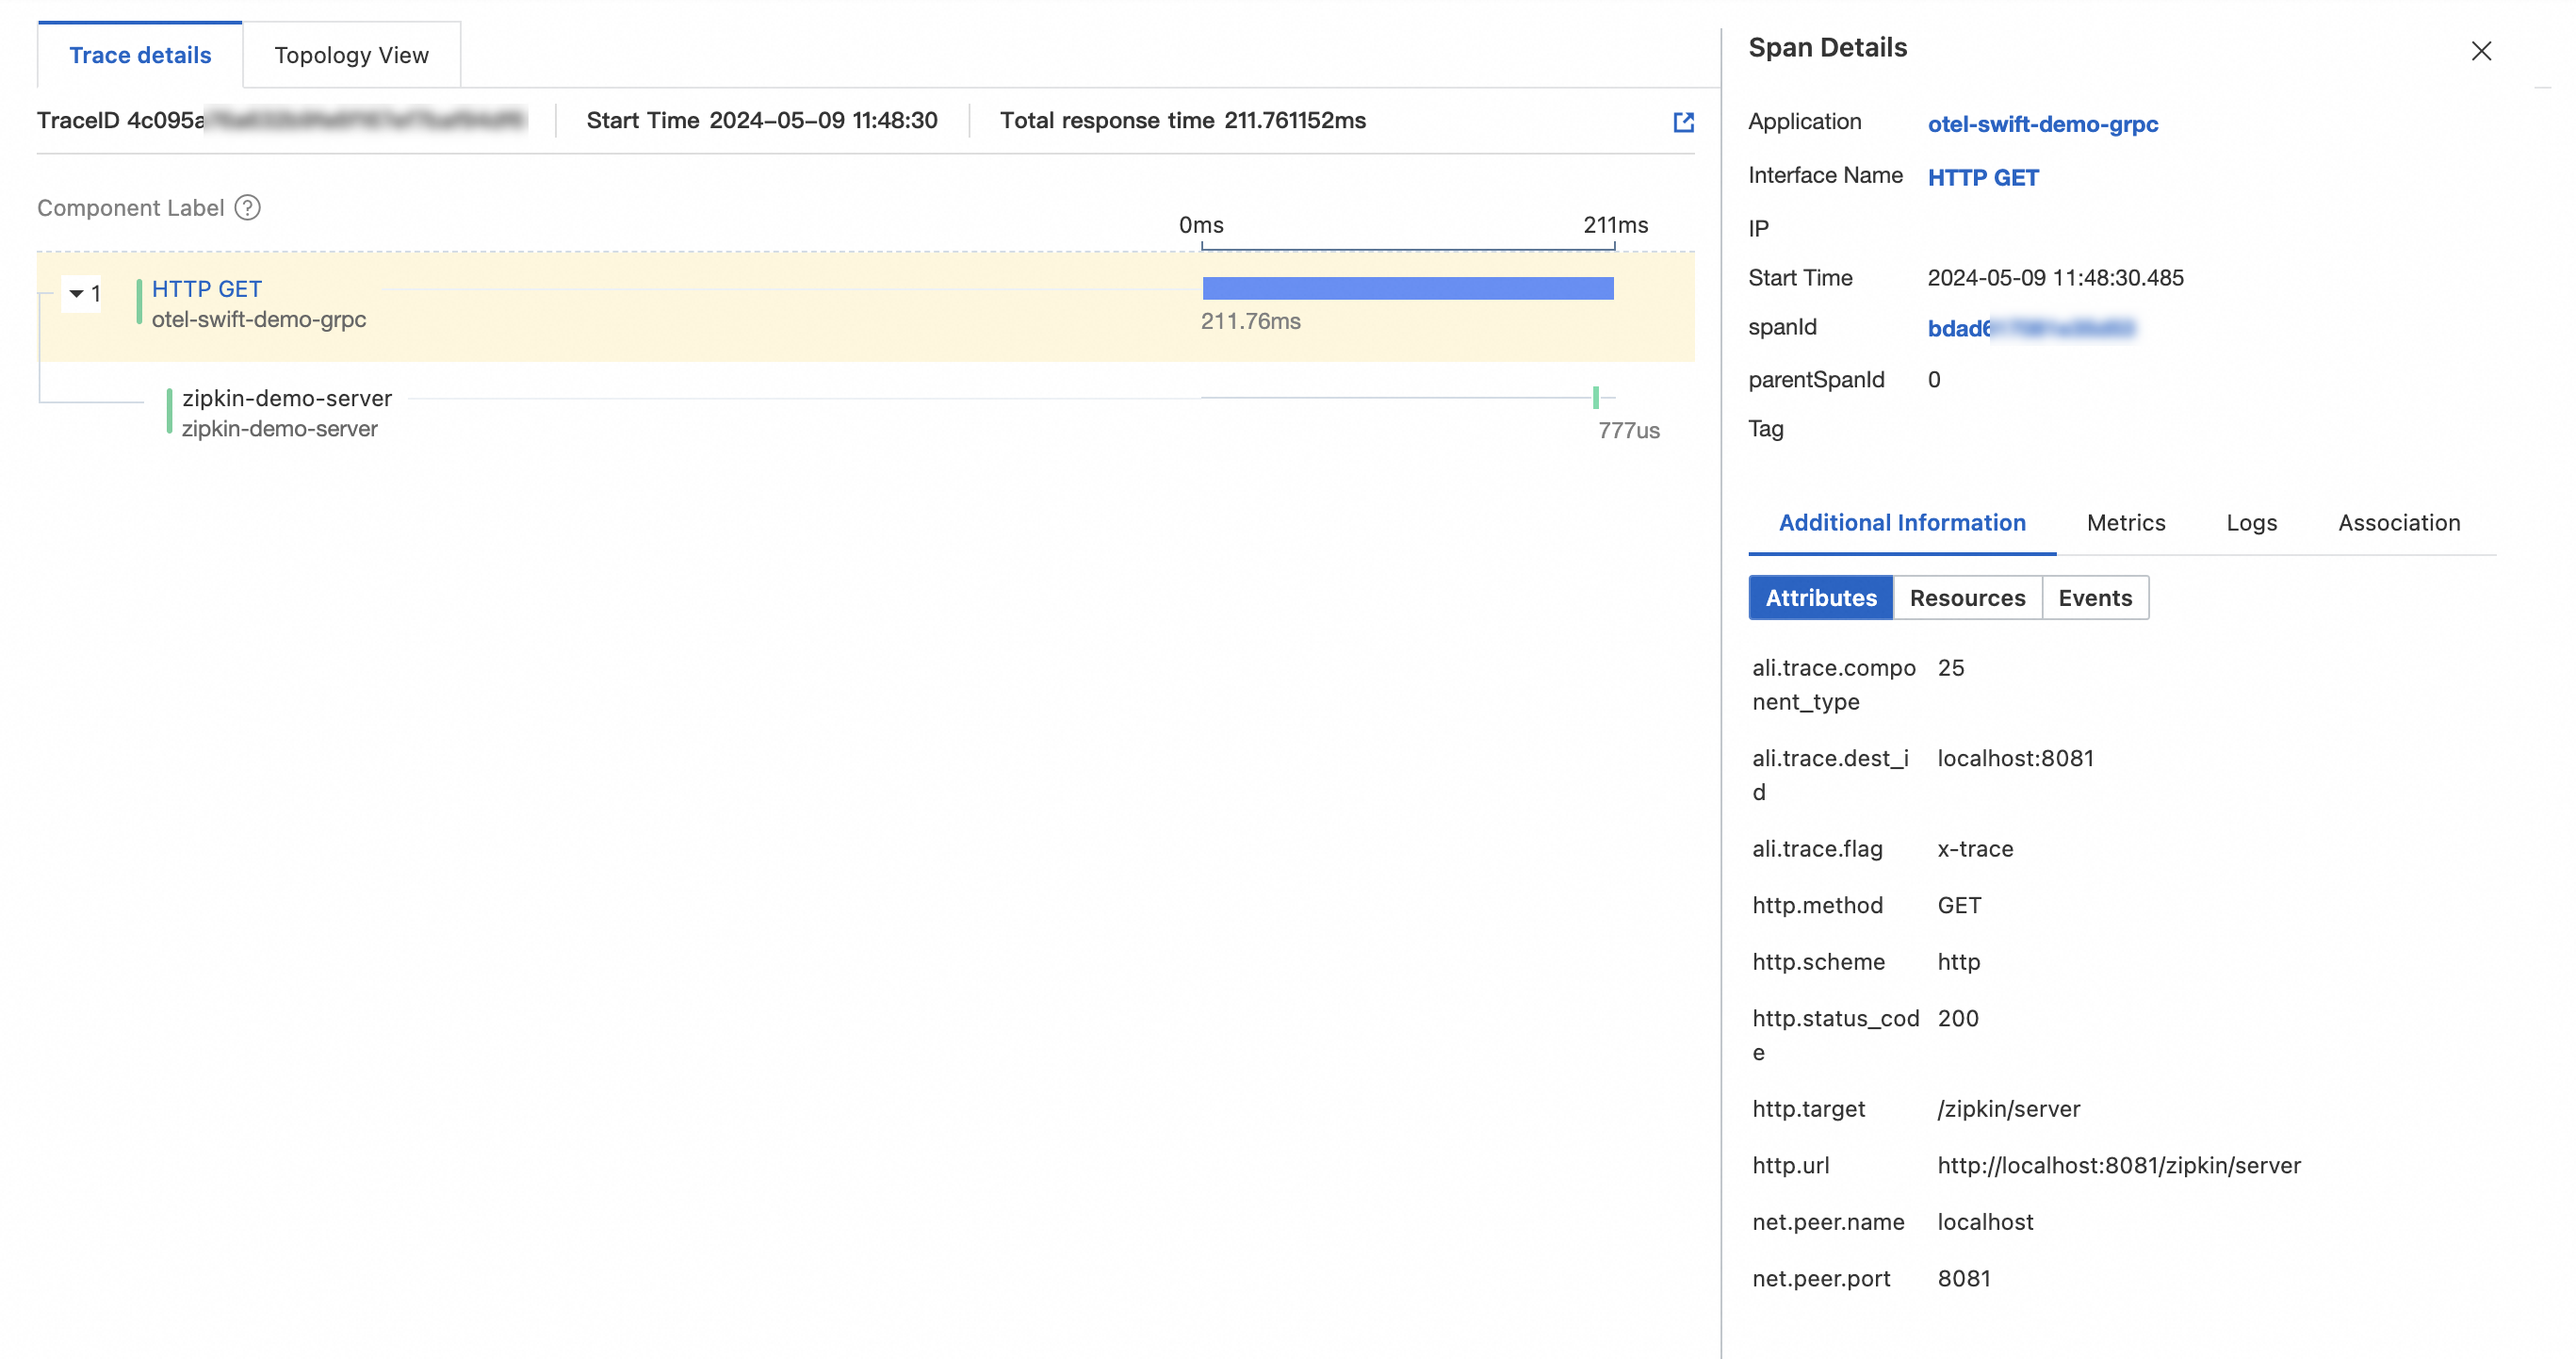
On the Applications page of the Managed Service for OpenTelemetry console, click the name of the application. On the page that appears, view the trace data.
Step 4: Connect the client application and server application
Change the format to pass trace data in the HTTP request header.
Different protocols use different HTTP request headers to pass the trace context. For example, OpenTelemtry uses the W3C Trace Context format by default and supports other formats, and Zipkin uses the B3 or B3 Multi format. For more information, see Specify the format to pass trace data.
Set the format to pass trace data for the client application based on the protocol used by the server application. This way, the iOS client application and server application can be connected.
If the server application uses the W3C Trace Context format of OpenTelemetry, you do not need to specify the textPropagators and baggagePropagator parameters for the client application.
If the server application uses the B3 or B3 Multi format of Zipkin, set the textPropagators parameter to B3Propagator and the baggagePropagator parameter to ZipkinBaggagePropagator for the client application.
// Specify the B3 format to pass trace data.
OpenTelemetry.registerPropagators(textPropagators: [B3Propagator()],
                                  baggagePropagator: ZipkinBaggagePropagator())
If the server application uses the Jaeger protocol, you must set the textPropagators parameter to JaegerPropagator and the baggagePropagator parameter to JaegerBaggagePropagator for the client application.
// Specify the Jaeger format to pass trace data.
OpenTelemetry.registerPropagators(textPropagators: [JaegerPropagator()],
                                  baggagePropagator: JaegerBaggagePropagator())
You can also specify multiple formats to pass trace data.
// Specify the W3C Trace Context, B3, and Jaeger formats to pass trace data.
OpenTelemetry.registerPropagators(textPropagators: [W3CTraceContextPropagator(),
                                                    B3Propagator(),
                                                    JaegerPropagator()],
                                  baggagePropagator: W3CBaggagePropagator())
Import the URLSessionInstrumentation plug-in.
URLSessionInstrumentation is an automatic instrumentation plug-in provided by OpenTelemetry for the URLSession class. It automatically intercepts all network requests that are sent from the URLSession class and creates traces.
import URLSessionInstrumentation

...
let networkInstrumentation = URLSessionInstrumentation(configuration: URLSessionInstrumentationConfiguration())
Use the URLSession class to send a request to access the server application.
let url = URL(string: "<Server address>")! let request = URLRequest(url: url) let semaphore = DispatchSemaphore(value: 0) let task = URLSession.shared.dataTask(with: request) { data, _, _ in if let data = data { let string = String(decoding: data, as: UTF8.self) print(string) } semaphore.signal() } task.resume() semaphore.wait()Start the application and view the trace between the client application and server application on the Trace Explorer page.
The following figure shows an example. In this example,
HTTP GETis an iOS application andzipkin-demo-serveris a server application.