Managed Service for Prometheus は、ServiceMonitor カスタムリソース定義 (CRD) を使用したサービスディスカバリをサポートしています。ServiceMonitor を使用して、Pod ディスカバリの名前空間を定義し、matchLabel でモニタリングするサービスを選択できます。本トピックでは、Spring Boot フレームワーク上に構築されたアプリケーションに対して、ServiceMonitor を使用してサービスディスカバリ構成を作成する方法について説明します。
デモ
デモプロジェクトをダウンロードして、ServiceMonitor を使用したサービスディスカバリ構成の作成方法の完全な例をご参照ください。
ステップ 1:依存関係の追加
Maven アプリケーションを作成し、次の依存関係を pom.xml ファイルに追加します。
    <dependencies>
        <dependency>
            <groupId>org.springframework.boot</groupId>
            <artifactId>spring-boot-starter-actuator</artifactId>
        </dependency>
        <dependency>
            <groupId>org.springframework.boot</groupId>
            <artifactId>spring-boot-starter-web</artifactId>
        </dependency>
        <dependency>
            <groupId>io.micrometer</groupId>
            <artifactId>micrometer-registry-prometheus</artifactId>
            <version>1.6.6</version>
        </dependency>

        <dependency>
            <groupId>org.springframework.boot</groupId>
            <artifactId>spring-boot-configuration-processor</artifactId>
            <optional>true</optional>
        </dependency>
        <dependency>
            <groupId>org.projectlombok</groupId>
            <artifactId>lombok</artifactId>
            <optional>true</optional>
        </dependency>
        <dependency>
            <groupId>org.springframework.boot</groupId>
            <artifactId>spring-boot-starter-test</artifactId>
            <scope>test</scope>
        </dependency>
    </dependencies>
プロジェクトの src/resources/applications.properties ファイルに次の構成を追加します。
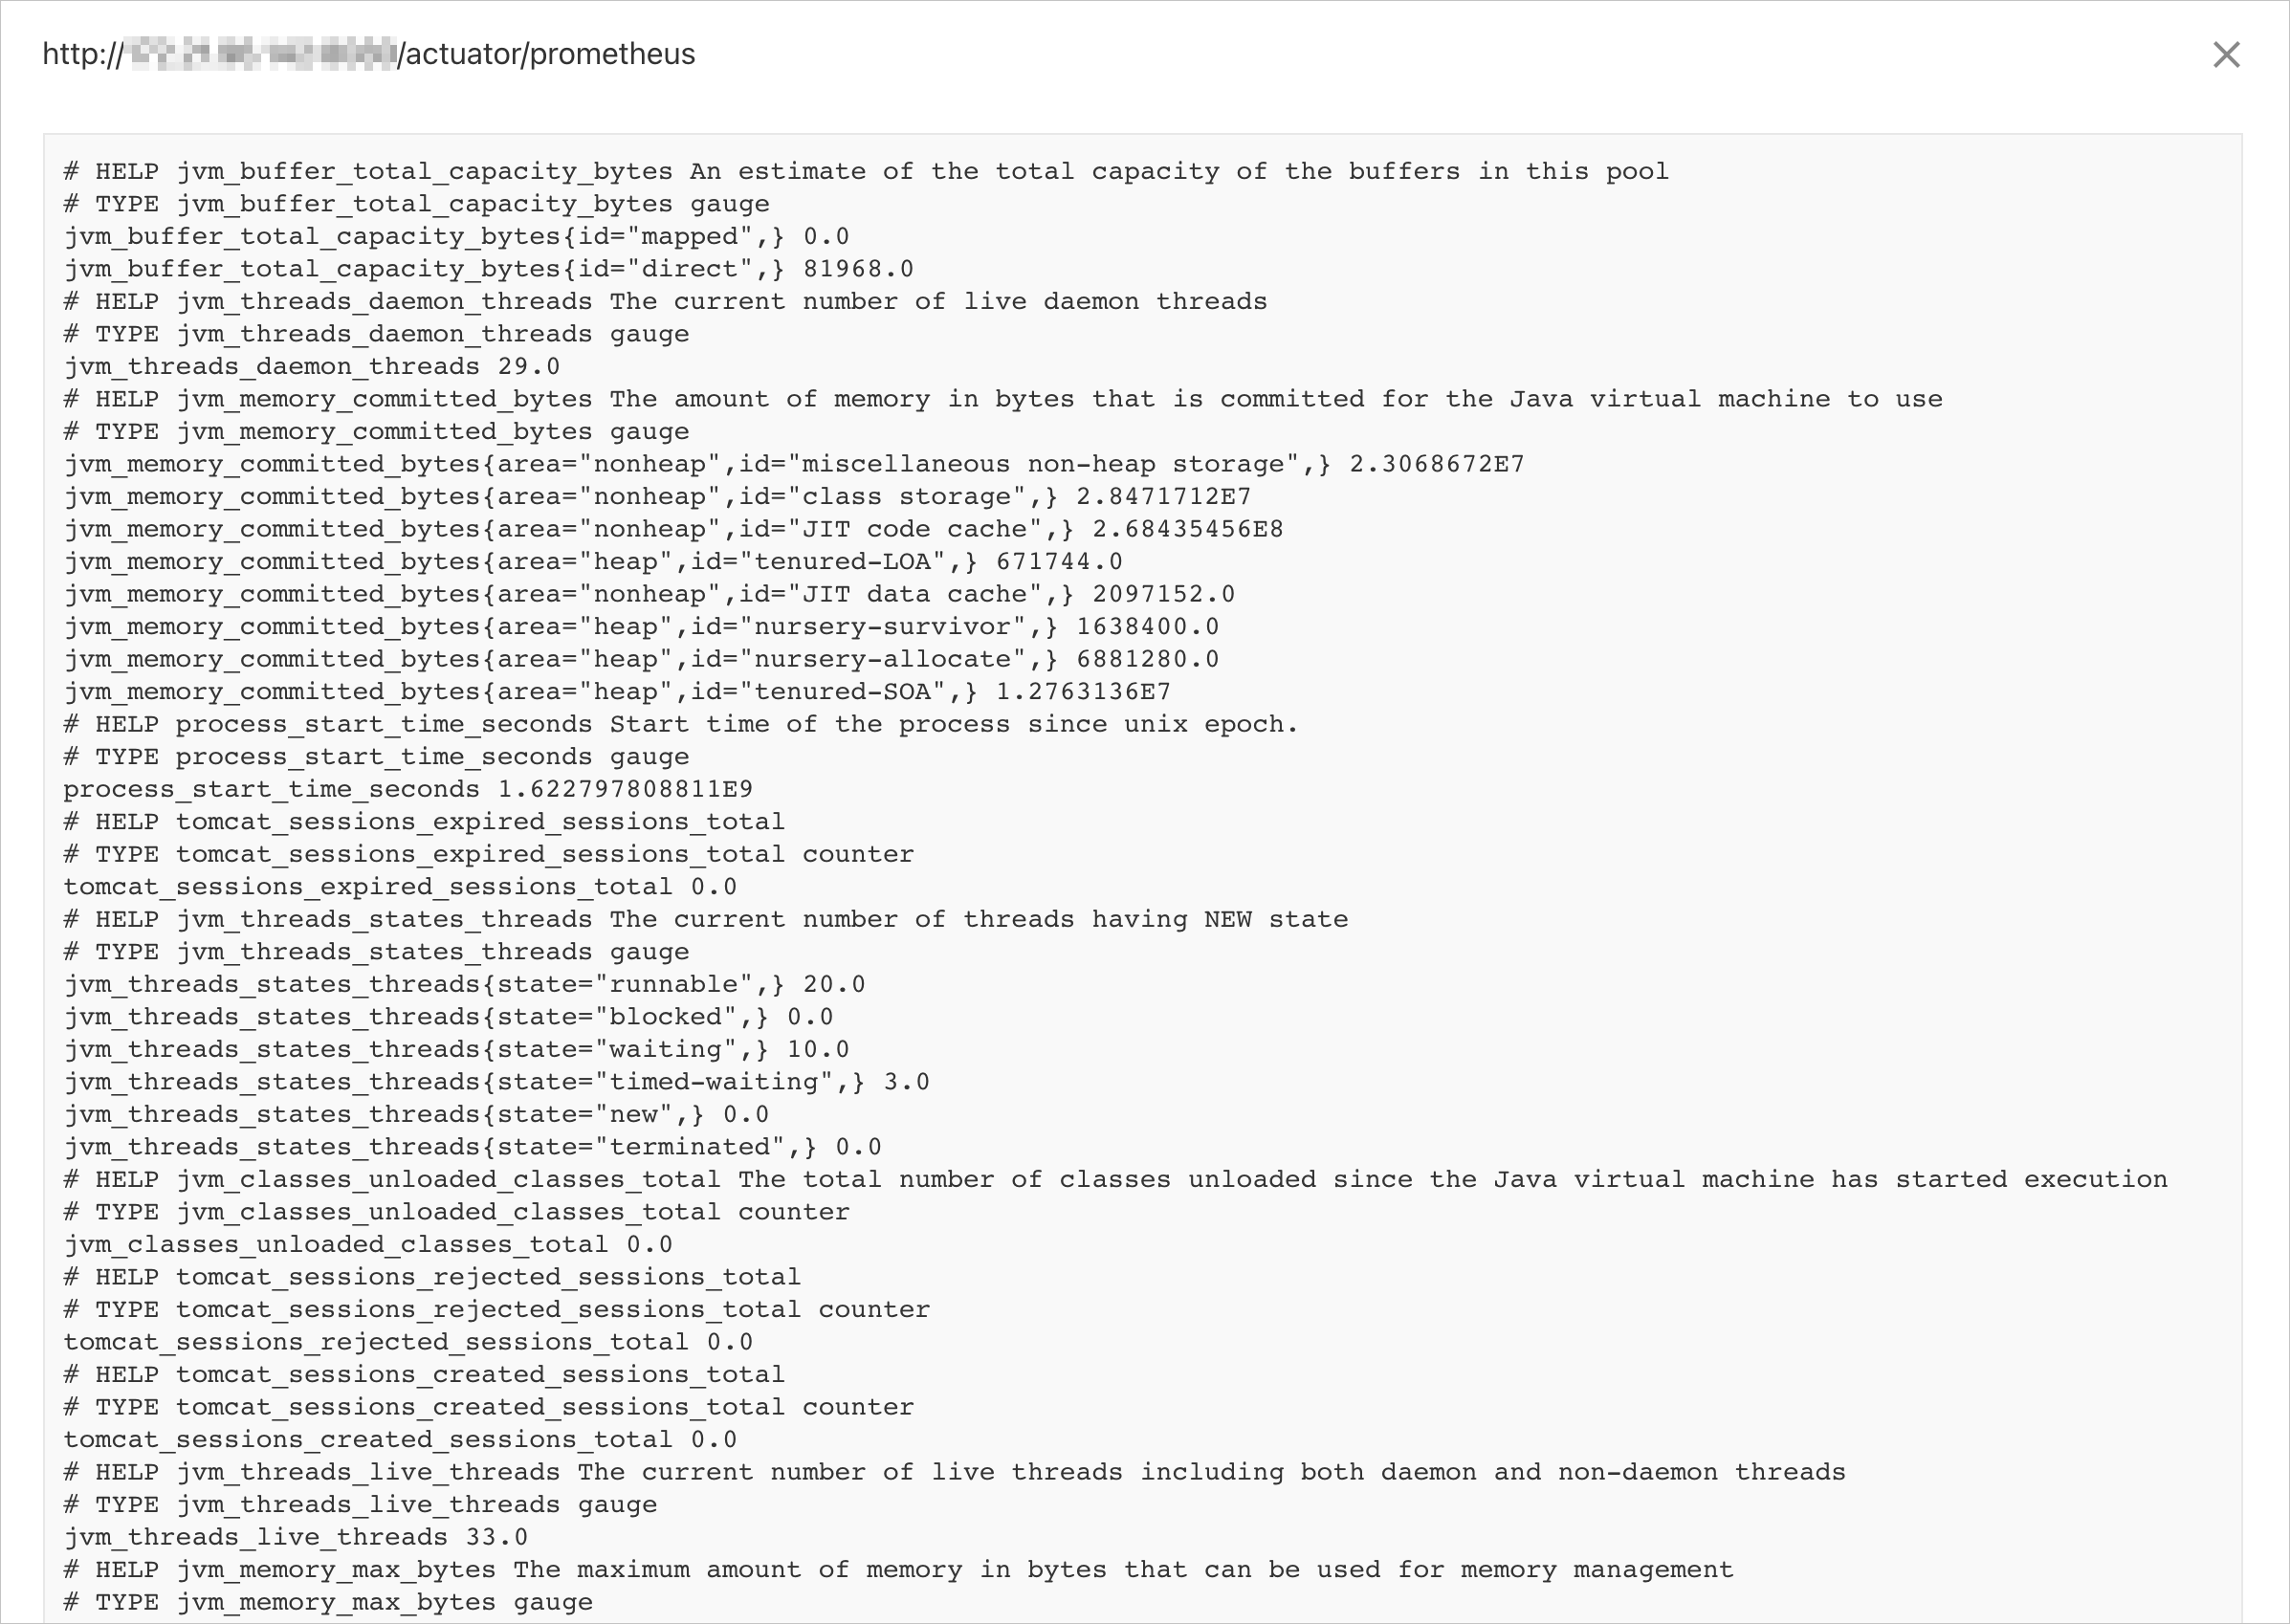
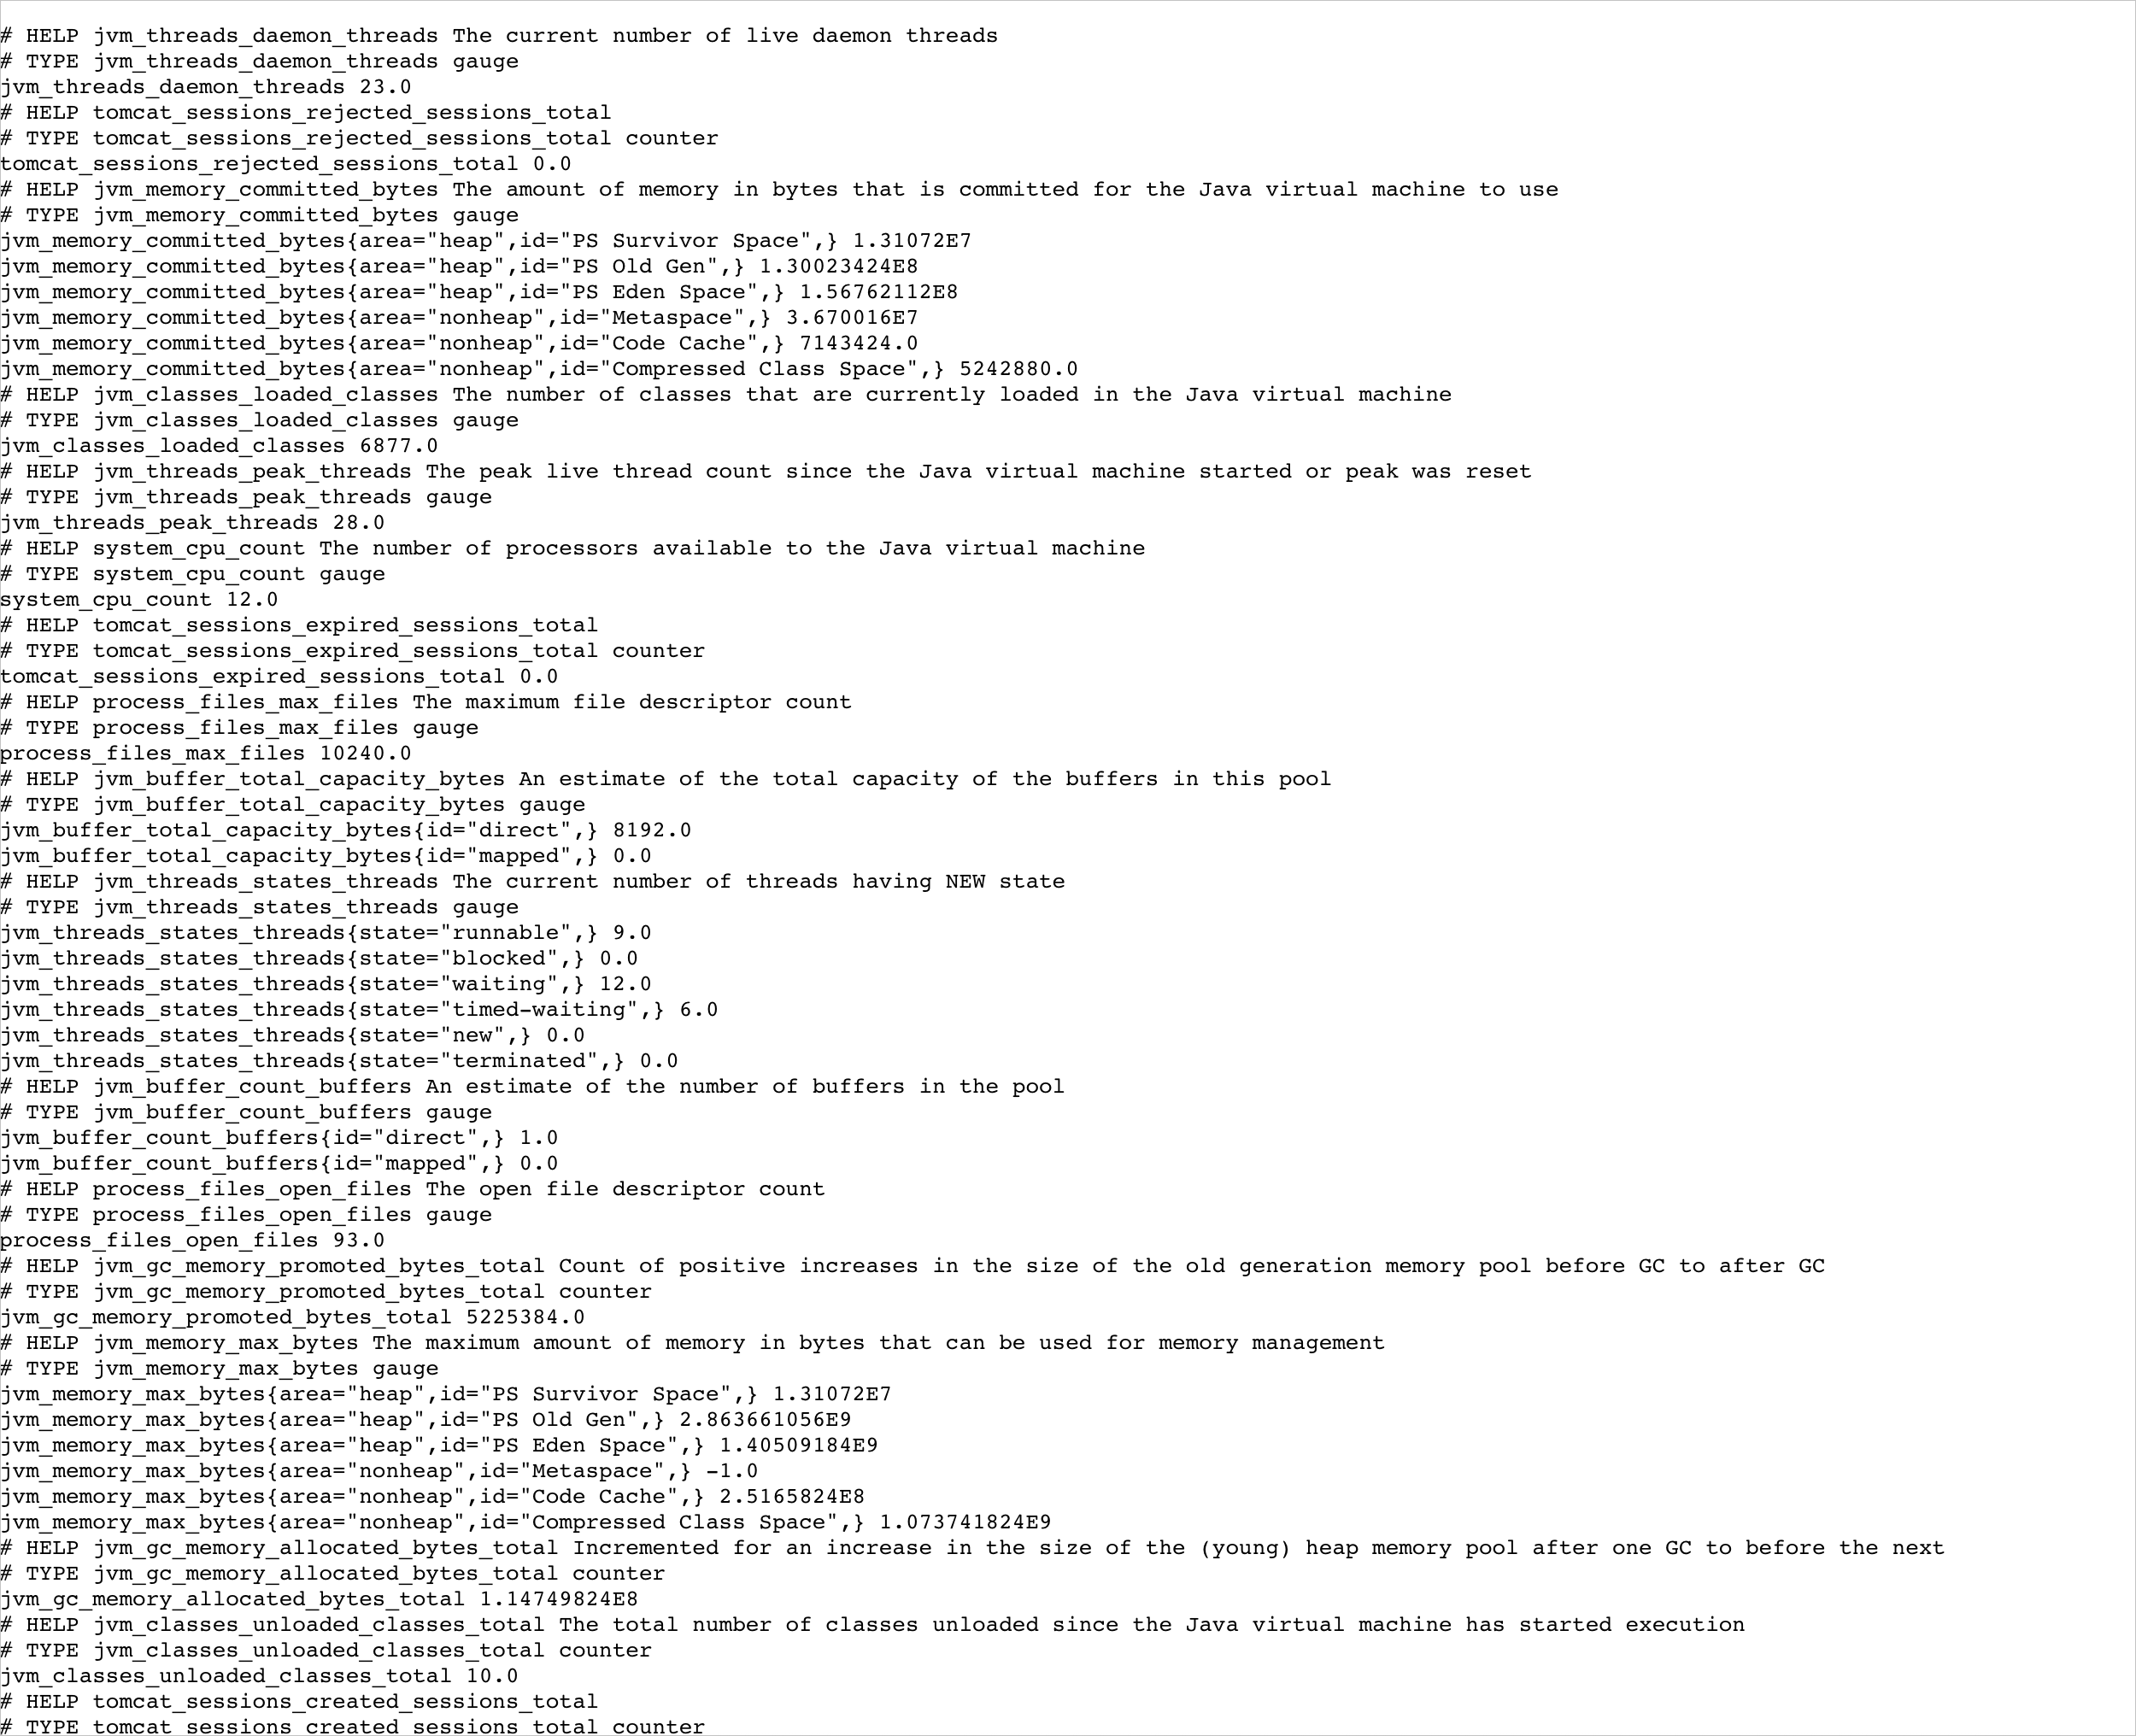
management.endpoints.web.exposure.include=prometheusプロジェクトを開始し、ブラウザで
http://{host}:{port}/actuator/prometheusにアクセスします。対応する Java 仮想マシン (JVM) のモニタリングデータが表示されます。下図に例を示します。
ステップ 2:Kubernetes クラスターのデプロイ
イメージをビルドし、イメージリポジトリにアップロードします。詳細については、「ソースコードホスティングプラットフォームのバインド」をご参照ください。
次の YAML 構成を使用して Deployment を作成します。
apiVersion: apps/v1
kind: Deployment
metadata:
  name: micrometer-prometheus
  namespace: default
  labels:
    app: demo-prometheus
spec:
  replicas: 3
  selector:
    matchLabels:
      app: demo-prometheus
  template:
    metadata:
      labels:
        app: demo-prometheus
    spec:
      containers:
        - name: micrometer-prometheus
          image: manjusakalza/micrometer-prometheus:latest
          ports:
            - containerPort: 8080
次の YAML 構成を使用してサービスを作成します。
apiVersion: v1
kind: Service
metadata:
  name: prometheus-metrics-demo
  namespace: default
  labels:
    micrometer-prometheus-discovery: 'true'
spec:
  selector:
    app: demo-prometheus
  ports:
    - protocol: TCP
      port: 8080
      targetPort: 8080
      name: metrics
ステップ 3:ServiceMonitor の作成
YAML ファイルをコンピューターに保存し、
kubectl apply -f {path/to/the/YAML/file}を実行してファイルを適用します。
以下は、ServiceMonitor の YAML ファイルのサンプルです:
apiVersion: monitoring.coreos.com/v1
kind: ServiceMonitor
metadata:
  name: micrometer-demo
  namespace: default
spec:
  endpoints:
    - interval: 15s
      path: /actuator/prometheus
      port: metrics    # 注:ポート番号ではなく、ポート名を設定してください。
  namespaceSelector:
    any: true
  selector:
    matchLabels:
      micrometer-prometheus-discovery: 'true'
この YAML ファイルの各フィールドの説明は次のとおりです:
metadataフィールドのnameとnamespaceは、ServiceMonitor の主要なメタデータを指定します。specフィールドのendpointsは、Prometheus がメトリックをスクレイピングするサーバーエンドポイントを指定します。endpointsは、複数のendpointsを作成できる配列です。各endpointには、次の 3 つのフィールドが含まれます:interval:Prometheus が現在のendpointをスクレイピングする間隔を指定します。単位は秒です。この例では、値は15sに設定されています。path:Prometheus のスクレイピングパスを指定します。この例では、値は/actuator/prometheusに設定されています。port: メトリックの収集元となるサービスポートの名前。このパラメーターには、ステップ 2 で作成した Service で指定されているnameパラメーターの値を設定します。この例では、このパラメーターはmetricsに設定されています。重要ポート番号ではなく、ポート名を設定してください。
specフィールドのnamespaceSelectorは、サービスディスカバリの範囲を指定します。namespaceSelectorには、相互に排他的な 2 つのフィールドが含まれています。各フィールドの説明は次のとおりです:any:値はtrueのみです。このフィールドを `true` に設定すると、システムはすべての名前空間でセレクターのフィルター条件に一致するすべてのサービスをモニタリングします。matchNames:モニタリングするnamespacesを指定する配列です。たとえば、default と arms-prom の名前空間のサービスのみをモニタリングするには、matchNamesを次のように設定します:namespaceSelector: matchNames: - default - arms-prom
specフィールドのselectorは、サービスの選択に使用されます。この例で使用されるサービスには、micrometer-prometheus-discovery: 'true' というラベルが付いています。したがって、
selectorを次のように設定します:selector: matchLabels: micrometer-prometheus-discovery: 'true'
Basic 認証機能を使用するには、次のサンプル YAML ファイルをご参照ください。
apiVersion: monitoring.coreos.com/v1
kind: ServiceMonitor
metadata:
  name: cloud-open-api-monitor     #  ServiceMonitor に一意の名前を設定します。
  namespace: default   #  ServiceMonitor が存在する名前空間を設定します。
spec:
  endpoints:
  - interval: 30s
    # Prometheus が現在のエンドポイントをスクレイピングする間隔を指定します。
    port: tcp-8080
    # Prometheus エクスポーターのコードで公開されているパスを入力します。
    path: /api/actuator/prometheus
    basicAuth:
      password:
        name: basic-auth
        key: <password>
      username:
        name: basic-auth
        key: <userName>
    scheme: http
  namespaceSelector:
    any: true
  selector:
    matchLabels:
      # 次のラベルを持つサービスに一致させます。
      edas.oam.acname: cloud-open-api
Basic 認証機能を使用するために必要な権限がない場合は、必要な権限を持つ ClusterRole をクラスターに追加します。次に、ClusterRoleBinding を使用して、この ClusterRole を arms-prom 名前空間の arms-prom-operator という名前の ServiceAccount にバインドします。これにより、Prometheus エージェントに必要な権限が付与されます。
ClusterRole の YAML ファイル
apiVersion: rbac.authorization.k8s.io/v1
kind: ClusterRole
metadata:
  name: prometheus-agent-role
  labels:
    app: prometheus-agent
rules:
  - apiGroups: [""]
    resources: ["pods", "services", "endpoints", "nodes"]
    verbs: ["get", "list", "watch"]  # 必要に応じて調整します。
  - apiGroups: ["monitoring.coreos.com"]  # 必要に応じて apiGroups を調整します。
    resources: ["*"]
    verbs: ["get", "list", "watch", "create", "update", "delete"]  # 必要に応じて調整します。
ClusterRoleBinding の YAML ファイル
apiVersion: rbac.authorization.k8s.io/v1
kind: ClusterRoleBinding
metadata:
  name: prometheus-agent-binding
subjects:
  - kind: ServiceAccount
    name: arms-prom-operator  # サービスアカウント名
    namespace: arms-prom      # サービスアカウントが存在する名前空間。
roleRef:
  kind: ClusterRole
  name: prometheus-agent-role  # 上記で定義した ClusterRole の名前。
  apiGroup: rbac.authorization.k8s.io
ステップ 4:ServiceMonitor の検証
次の手順を実行して、Prometheus がサービスを正常に検出したことを確認します。
Managed Service for Prometheus コンソールにログインします。左側のナビゲーションウィンドウで、[統合管理] をクリックします。
[統合済み環境] タブで、[コンテナサービス] リストにあるターゲットコンテナ環境の名前をクリックします。
[セルフモニタリング] タブをクリックします。
[ターゲット] タブで、{namespace}/{serviceMonitorName}/x という名前のターゲットが存在するかどうかを確認します。
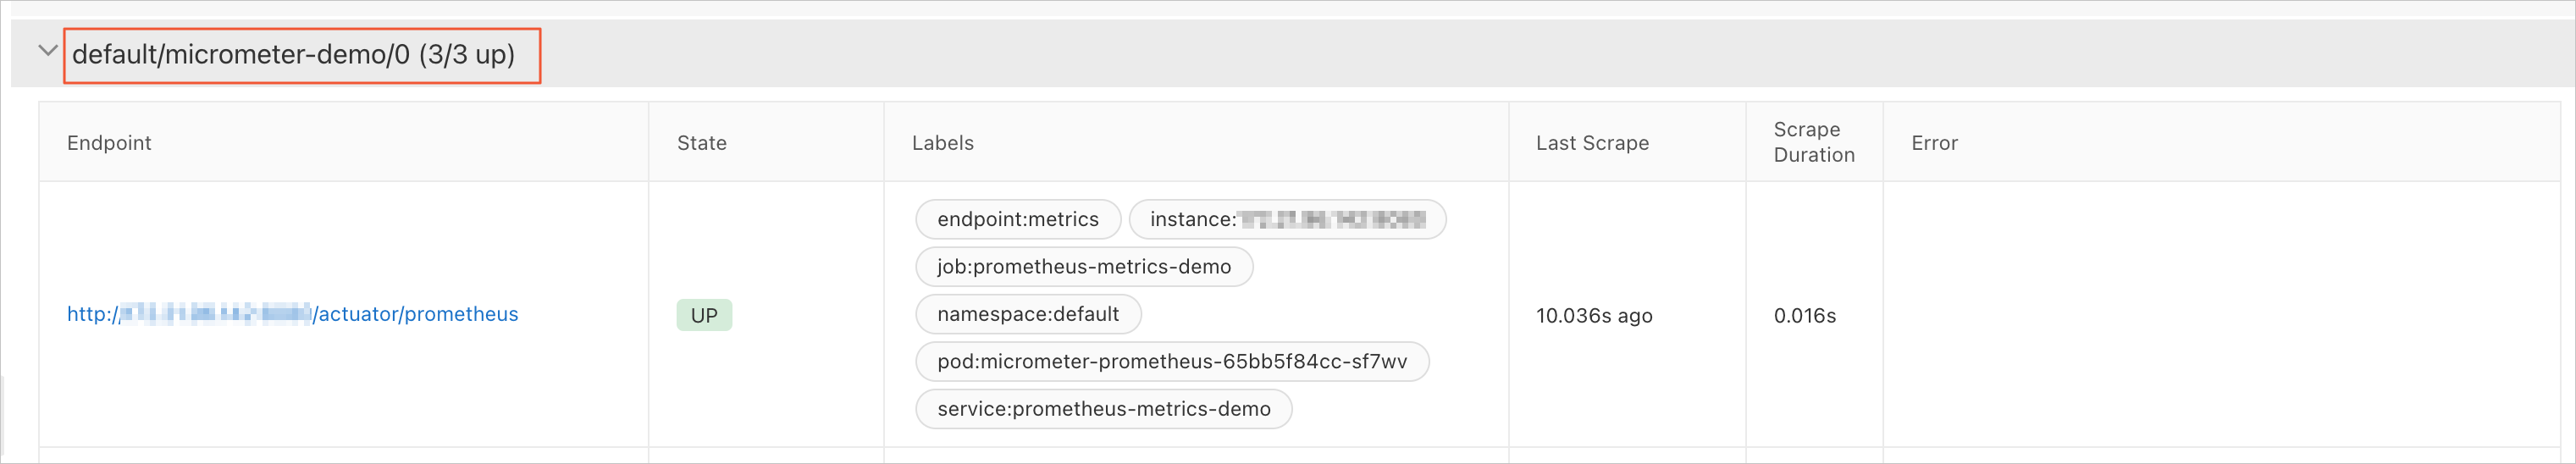
{namespace}/{serviceMonitorName}/x ターゲットの行をクリックして展開し、エンドポイントのリンクをクリックします。
メトリックが正しく表示されることを確認します。