All Products
Search
Document Center

Container Compute Service:Routing cerdas dan manajemen traffic dengan Gateway with Inference Extension

Last Updated:Apr 22, 2026

Load balancing tradisional yang mengandalkan alokasi traffic sederhana sering kali tidak memadai untuk menangani permintaan kompleks dan beban traffic dinamis pada layanan inferensi large language model (LLM) di kluster Kubernetes. Topik ini menjelaskan cara menggunakan komponen Gateway with Inference Extension untuk mengonfigurasi ekstensi layanan inferensi guna mencapai routing cerdas dan manajemen traffic yang efisien.

Latar Belakang

KV cache

Selama proses inferensi, model menyimpan kunci dan nilai yang dihasilkan dalam cache. Hal ini memungkinkan akses cepat ke informasi kontekstual dari permintaan sebelumnya, sehingga meningkatkan efisiensi generasi teks oleh model. KV cache membantu model menghindari komputasi berulang, yang secara signifikan mempercepat kecepatan inferensi dan mengurangi latensi respons.

Prosedur

Diagram berikut menggambarkan alur kerja.

  1. Pada inference-gateway, port 8080 menggunakan entri rute HTTP standar untuk meneruskan permintaan ke layanan inferensi backend. Port 8081 meneruskan permintaan melalui ekstensi LLM Route, yang kemudian meneruskannya ke layanan yang sama.

  2. Dalam entri rute HTTP, Anda menggunakan resource InferencePool untuk mendeklarasikan kelompok workload layanan inferensi LLM dan resource InferenceModel untuk menentukan kebijakan distribusi traffic bagi suatu model dalam InferencePool tersebut. Konfigurasi ini mengarahkan permintaan dari port 8081 inference-gateway ke workload layanan inferensi LLM yang ditentukan dengan menggunakan algoritma penyeimbangan beban yang ditingkatkan khusus untuk layanan inferensi.

Prasyarat

Anda memiliki kluster ACK yang dikelola dengan kelompok node GPU. Anda juga dapat menginstal komponen ACK Virtual Node di kluster ACK yang dikelola untuk menggunakan daya komputasi GPU ACS.

Prosedur

Langkah 1: Deploy layanan inferensi contoh

  1. Buat file bernama vllm-service.yaml dengan konten berikut.

    Catatan

    Untuk image ini, kami merekomendasikan penggunaan kartu A10 di kluster ACK dan kartu L20 (GN8IS) di Alibaba Cloud Container Compute Service.

    Selain itu, karena ukuran image LLM besar, kami merekomendasikan untuk mendorongnya ke Container Registry dan menariknya menggunakan alamat internal. Menarik image langsung dari jaringan publik bisa lambat karena kecepatannya dibatasi oleh bandwidth alamat IP elastis (EIP) kluster.

    Konten YAML

    apiVersion: apps/v1
    kind: Deployment
    metadata:
      labels:
        app: qwen
      name: qwen
    spec:
      progressDeadlineSeconds: 600
      replicas: 5
      selector:
        matchLabels:
          app: qwen
      template:
        metadata:
          annotations:
            prometheus.io/path: /metrics
            prometheus.io/port: "8000"
            prometheus.io/scrape: "true"
          labels:
            app: qwen
            alibabacloud.com/compute-class: gpu
            alibabacloud.com/compute-qos: default
            alibabacloud.com/gpu-model-series: GN8IS
        spec:
          containers:
            - command:
                - sh
                - -c
                - vllm serve /models/Qwen-2.5-7B-Instruct --port 8000 --trust-remote-code --served-model-name /model/qwen --gpu-memory-utilization 0.95 --enforce-eager --enable-lora --max-loras 2 --max-cpu-loras 4 --lora-modules travel-helper-v1=/models/Qwen-TravelHelper-Lora travel-helper-v2=/models/Qwen-TravelHelper-Lora-v2
              image: registry-cn-hangzhou.ack.aliyuncs.com/dev/qwen-2.5-7b-instruct-lora:v0.1
              imagePullPolicy: IfNotPresent
              name: custom-serving
              ports:
                - containerPort: 8000
                  name: http
                  protocol: TCP
              readinessProbe:
                failureThreshold: 3
                initialDelaySeconds: 30
                periodSeconds: 30
                successThreshold: 1
                tcpSocket:
                  port: 8000
                timeoutSeconds: 1
              resources:
                limits:
                  nvidia.com/gpu: "1"
                  cpu: "8"
                  memory: 30G
              terminationMessagePath: /dev/termination-log
              terminationMessagePolicy: File
              volumeMounts:
                - mountPath: /dev/shm
                  name: dshm
          restartPolicy: Always
          volumes:
            - emptyDir:
                medium: Memory
                sizeLimit: 30Gi
              name: dshm
    ---
    apiVersion: v1
    kind: Service
    metadata:
      labels:
        app: qwen
      name: qwen
    spec:
      ports:
        - name: http-serving
          port: 8000
          protocol: TCP
          targetPort: 8000
      selector:
        app: qwen
  2. Deploy layanan inferensi contoh.

    kubectl apply -f vllm-service.yaml

Langkah 2: Instal komponen Gateway with Inference Extension

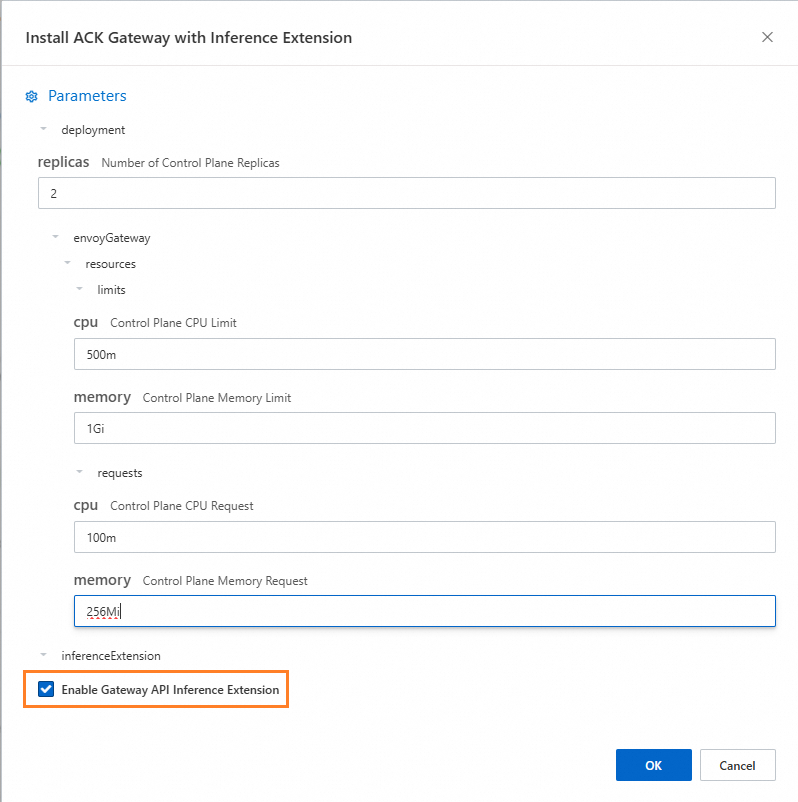
atau Instal komponen Gateway with Inference Extension, dan pastikan Enable Gateway API Inference Extension (Requires a deployed inference service) dipilih.
image

Langkah 3: Menerapkan perutean inferensi

Langkah ini membuat resource InferencePool dan InferenceModel.

  1. Buat file inference-pool.yaml.

    apiVersion: inference.networking.x-k8s.io/v1alpha2
    kind: InferencePool
    metadata:
      name: vllm-qwen-pool
    spec:
      targetPortNumber: 8000
      selector:
        app: qwen
      extensionRef:
        name: inference-gateway-ext-proc
    ---
    apiVersion: inference.networking.x-k8s.io/v1alpha2
    kind: InferenceModel
    metadata:
      name: inferencemodel-qwen
    spec:
      modelName: /model/qwen
      criticality: Critical
      poolRef:
        group: inference.networking.x-k8s.io
        kind: InferencePool
        name: vllm-qwen-pool
      targetModels:
      - name: /model/qwen
        weight: 100
  2. Deploy routing inferensi.

    kubectl apply -f inference-pool.yaml

Langkah 4: Deploy dan verifikasi gateway

Pada langkah ini, Anda membuat gateway yang mendengarkan pada port 8080 dan 8081.

  1. Buat file bernama inference-gateway.yaml.

    apiVersion: gateway.networking.k8s.io/v1
    kind: GatewayClass
    metadata:
      name: qwen-inference-gateway-class
    spec:
      controllerName: gateway.envoyproxy.io/gatewayclass-controller
    ---
    apiVersion: gateway.networking.k8s.io/v1
    kind: Gateway
    metadata:
      name: qwen-inference-gateway
    spec:
      gatewayClassName: qwen-inference-gateway-class
      listeners:
        - name: http
          protocol: HTTP
          port: 8080
        - name: llm-gw
          protocol: HTTP
          port: 8081
    ---
    apiVersion: gateway.networking.k8s.io/v1
    kind: HTTPRoute
    metadata:
      name: qwen-backend
    spec:
      parentRefs:
        - name: qwen-inference-gateway
          sectionName: llm-gw
      rules:
        - backendRefs:
            - group: inference.networking.x-k8s.io
              kind: InferencePool
              name: vllm-qwen-pool
          matches:
            - path:
                type: PathPrefix
                value: /
    ---
    apiVersion: gateway.networking.k8s.io/v1
    kind: HTTPRoute
    metadata:
      name: qwen-backend-no-inference
    spec:
      parentRefs:
      - group: gateway.networking.k8s.io
        kind: Gateway
        name: qwen-inference-gateway
        sectionName: http
      rules:
      - backendRefs:
        - group: ""
          kind: Service
          name: qwen
          port: 8000
          weight: 1
        matches:
        - path:
            type: PathPrefix
            value: /
    ---
    apiVersion: gateway.envoyproxy.io/v1alpha1
    kind: BackendTrafficPolicy
    metadata:
      name: backend-timeout
    spec:
      timeout:
        http:
          requestTimeout: 1h
      targetRef:
        group: gateway.networking.k8s.io
        kind: Gateway
        name: qwen-inference-gateway
  2. Deploy gateway.

    kubectl apply -f inference-gateway.yaml

    Konfigurasi ini membuat namespace bernama envoy-gateway-system dan layanan bernama envoy-default-inference-gateway-645xxxxx di kluster.

  3. Ambil alamat IP publik gateway.

    export GATEWAY_HOST=$(kubectl get gateway/qwen-inference-gateway -o jsonpath='{.status.addresses[0].value}')
  4. Verifikasi bahwa gateway meneruskan permintaan ke layanan inferensi menggunakan routing HTTP standar pada port 8080.

    curl -X POST ${GATEWAY_HOST}:8080/v1/chat/completions -H 'Content-Type: application/json' -d '{
        "model": "/model/qwen",
        "max_completion_tokens": 100,
        "temperature": 0,
        "messages": [
          {
            "role": "user",
            "content": "Write as if you were a critic: San Francisco"
          }
        ]
    }'

    Output yang diharapkan:

    {"id":"chatcmpl-aa6438e2-d65b-4211-afb8-ae8e76e7a692","object":"chat.completion","created":1747191180,"model":"/model/qwen","choices":[{"index":0,"message":{"role":"assistant","reasoning_content":null,"content":"San Francisco, a city that has long been a beacon of innovation, culture, and diversity, continues to captivate the world with its unique charm and character. As a critic, I find myself both enamored and occasionally perplexed by the city's multifaceted personality.\n\nSan Francisco's architecture is a testament to its rich history and progressive spirit. The iconic cable cars, Victorian houses, and the Golden Gate Bridge are not just tourist attractions but symbols of the city's enduring appeal. However, the","tool_calls":[]},"logprobs":null,"finish_reason":"length","stop_reason":null}],"usage":{"prompt_tokens":39,"total_tokens":139,"completion_tokens":100,"prompt_tokens_details":null},"prompt_logprobs":null}
  5. Verifikasi bahwa gateway meneruskan permintaan ke layanan inferensi menggunakan ekstensi layanan inferensi pada port 8081.

    curl -X POST ${GATEWAY_HOST}:8081/v1/chat/completions -H 'Content-Type: application/json' -d '{
        "model": "/model/qwen",
        "max_completion_tokens": 100,
        "temperature": 0,
        "messages": [
          {
            "role": "user",
            "content": "Write as if you were a critic: Los Angeles"
          }
        ]
    }'

    Output yang diharapkan:

    {"id":"chatcmpl-cc4fcd0a-6a66-4684-8dc9-284d4eb77bb7","object":"chat.completion","created":1747191969,"model":"/model/qwen","choices":[{"index":0,"message":{"role":"assistant","reasoning_content":null,"content":"Los Angeles, the sprawling metropolis often referred to as \"L.A.,\" is a city that defies easy description. It is a place where dreams are made and broken, where the sun never sets, and where the line between reality and fantasy is as blurred as the smog that often hangs over its valleys. As a critic, I find myself both captivated and perplexed by this city that is as much a state of mind as it is a physical place.\n\nOn one hand, Los","tool_calls":[]},"logprobs":null,"finish_reason":"length","stop_reason":null}],"usage":{"prompt_tokens":39,"total_tokens":139,"completion_tokens":100,"prompt_tokens_details":null},"prompt_logprobs":null}

(Opsional) Langkah 5: Konfigurasi metrik observabilitas dan dasbor

Catatan

Anda harus mengaktifkan dan mengonfigurasi Managed Service for Prometheus untuk kluster Anda, yang dapat menimbulkan biaya tambahan.

  1. Anda dapat menambahkan anotasi Prometheus ke pod layanan vLLM untuk mengaktifkan pengumpulan metrik. Instans Prometheus kemudian dapat menggunakan mekanisme penemuan layanan default-nya untuk mengambil metrik layanan vLLM dan memantau status internal layanan tersebut.

    ...
    annotations:
      prometheus.io/path: /metrics # Jalur HTTP tempat metrik diekspos.
      prometheus.io/port: "8000" # Port untuk mengekspos metrik, yaitu port pendengar server vLLM.
      prometheus.io/scrape: "true" # Apakah akan mengambil metrik dari pod saat ini.
    ...

    Tabel berikut menjelaskan beberapa metrik pemantauan yang disediakan oleh layanan vLLM:

    Metrik

    Deskripsi

    vllm:gpu_cache_usage_perc

    Persentase cache GPU yang digunakan oleh vLLM. Saat vLLM dimulai, ia secara preemptif mengalokasikan sebanyak mungkin memori video GPU untuk cache KV. Untuk server vLLM, pemanfaatan yang lebih rendah berarti GPU memiliki ruang yang cukup untuk permintaan baru.

    vllm:request_queue_time_seconds_sum

    Total waktu yang dihabiskan permintaan dalam antrian tunggu. Setelah permintaan inferensi LLM tiba di server vLLM, permintaan tersebut mungkin tidak diproses segera. Sebaliknya, permintaan harus menunggu untuk dijadwalkan oleh penjadwal vLLM untuk prefill dan decode.

    vllm:num_requests_running

    vllm:num_requests_waiting

    vllm:num_requests_swapped

    Jumlah permintaan yang sedang berjalan, menunggu, atau dialihkan ke memori. Anda dapat menggunakan metrik ini untuk menilai beban permintaan saat ini pada layanan vLLM.

    vllm:avg_generation_throughput_toks_per_s

    vllm:avg_prompt_throughput_toks_per_s

    Jumlah token yang dikonsumsi per detik selama tahap prefill dan jumlah token yang dihasilkan per detik selama tahap decode.

    vllm:time_to_first_token_seconds_bucket

    Latensi antara mengirim permintaan ke layanan vLLM dan menerima token pertama. Umumnya dikenal sebagai Time to First Token (TTFT), metrik ini mengukur waktu antara klien mengirim permintaan dan menerima bagian pertama respons. TTFT merupakan indikator penting pengalaman pengguna LLM.

    Anda dapat menetapkan aturan alert berdasarkan metrik ini untuk memantau layanan vLLM dan mendeteksi anomali secara real-time.

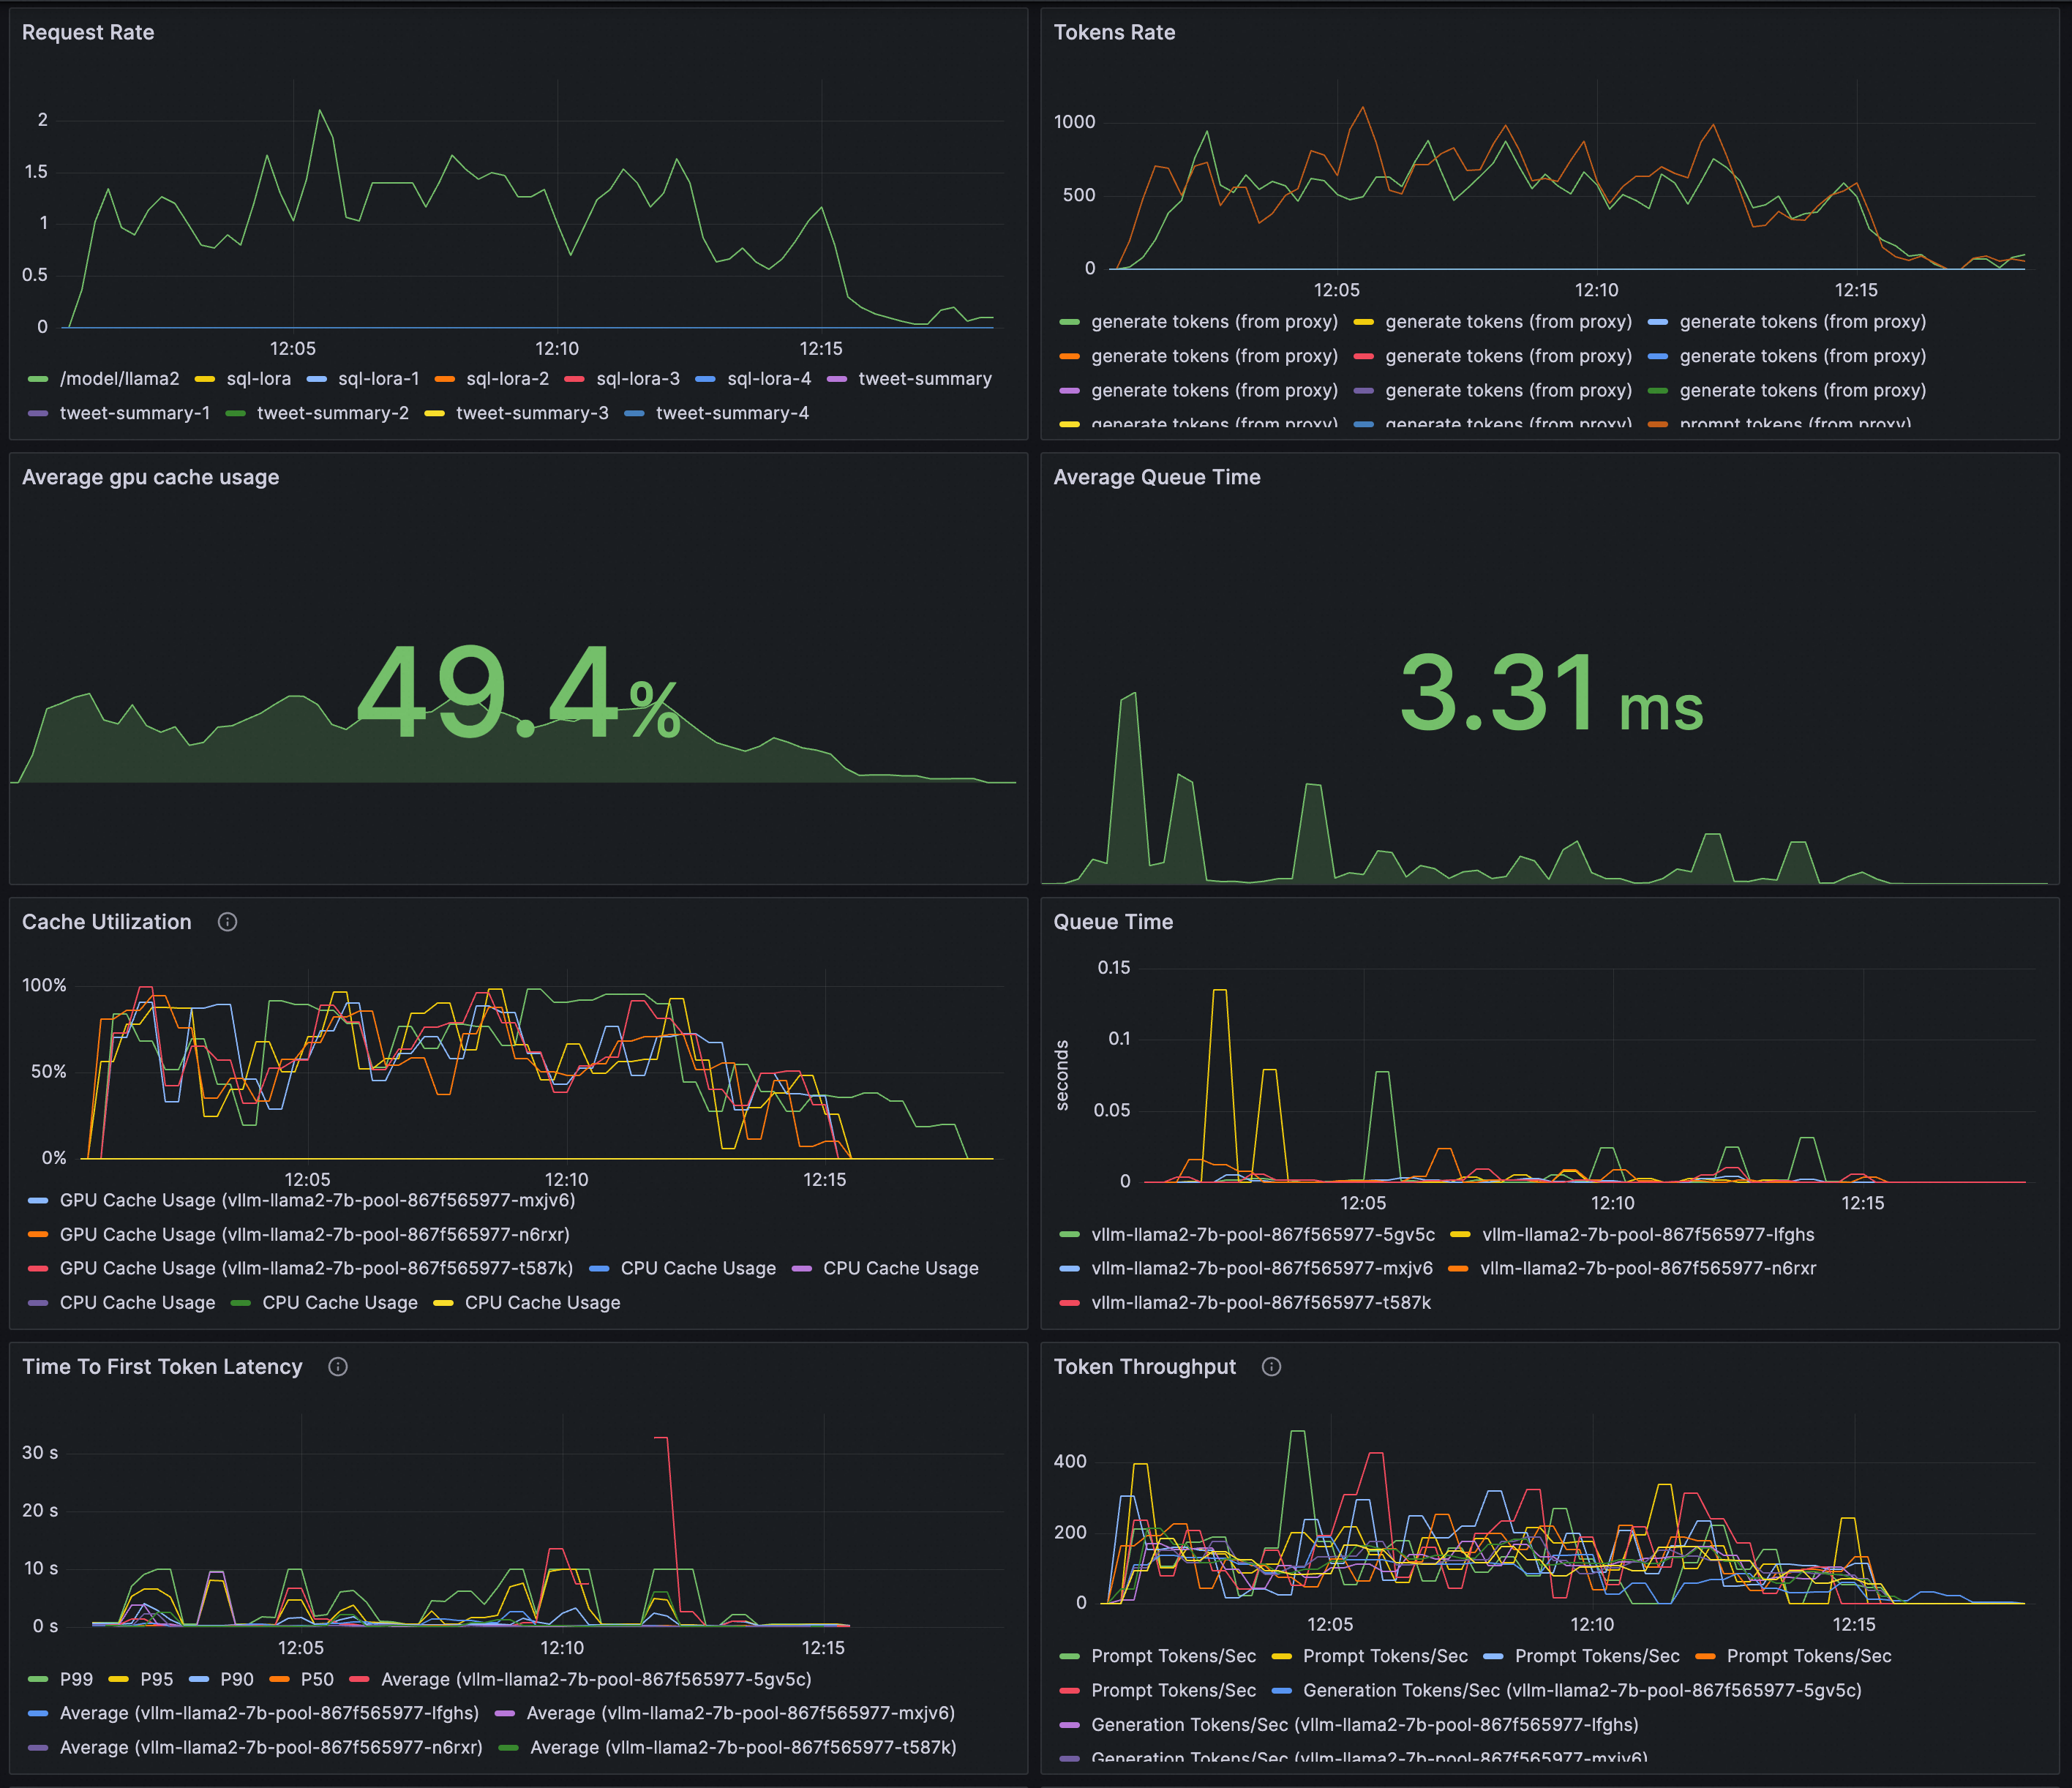
  2. Konfigurasikan dasbor Grafana untuk pemantauan waktu nyata layanan inferensi LLM. Anda dapat menggunakan dasbor ini untuk:

    • Memantau laju permintaan dan throughput total token layanan LLM.

    • Memantau status internal workload inferensi.

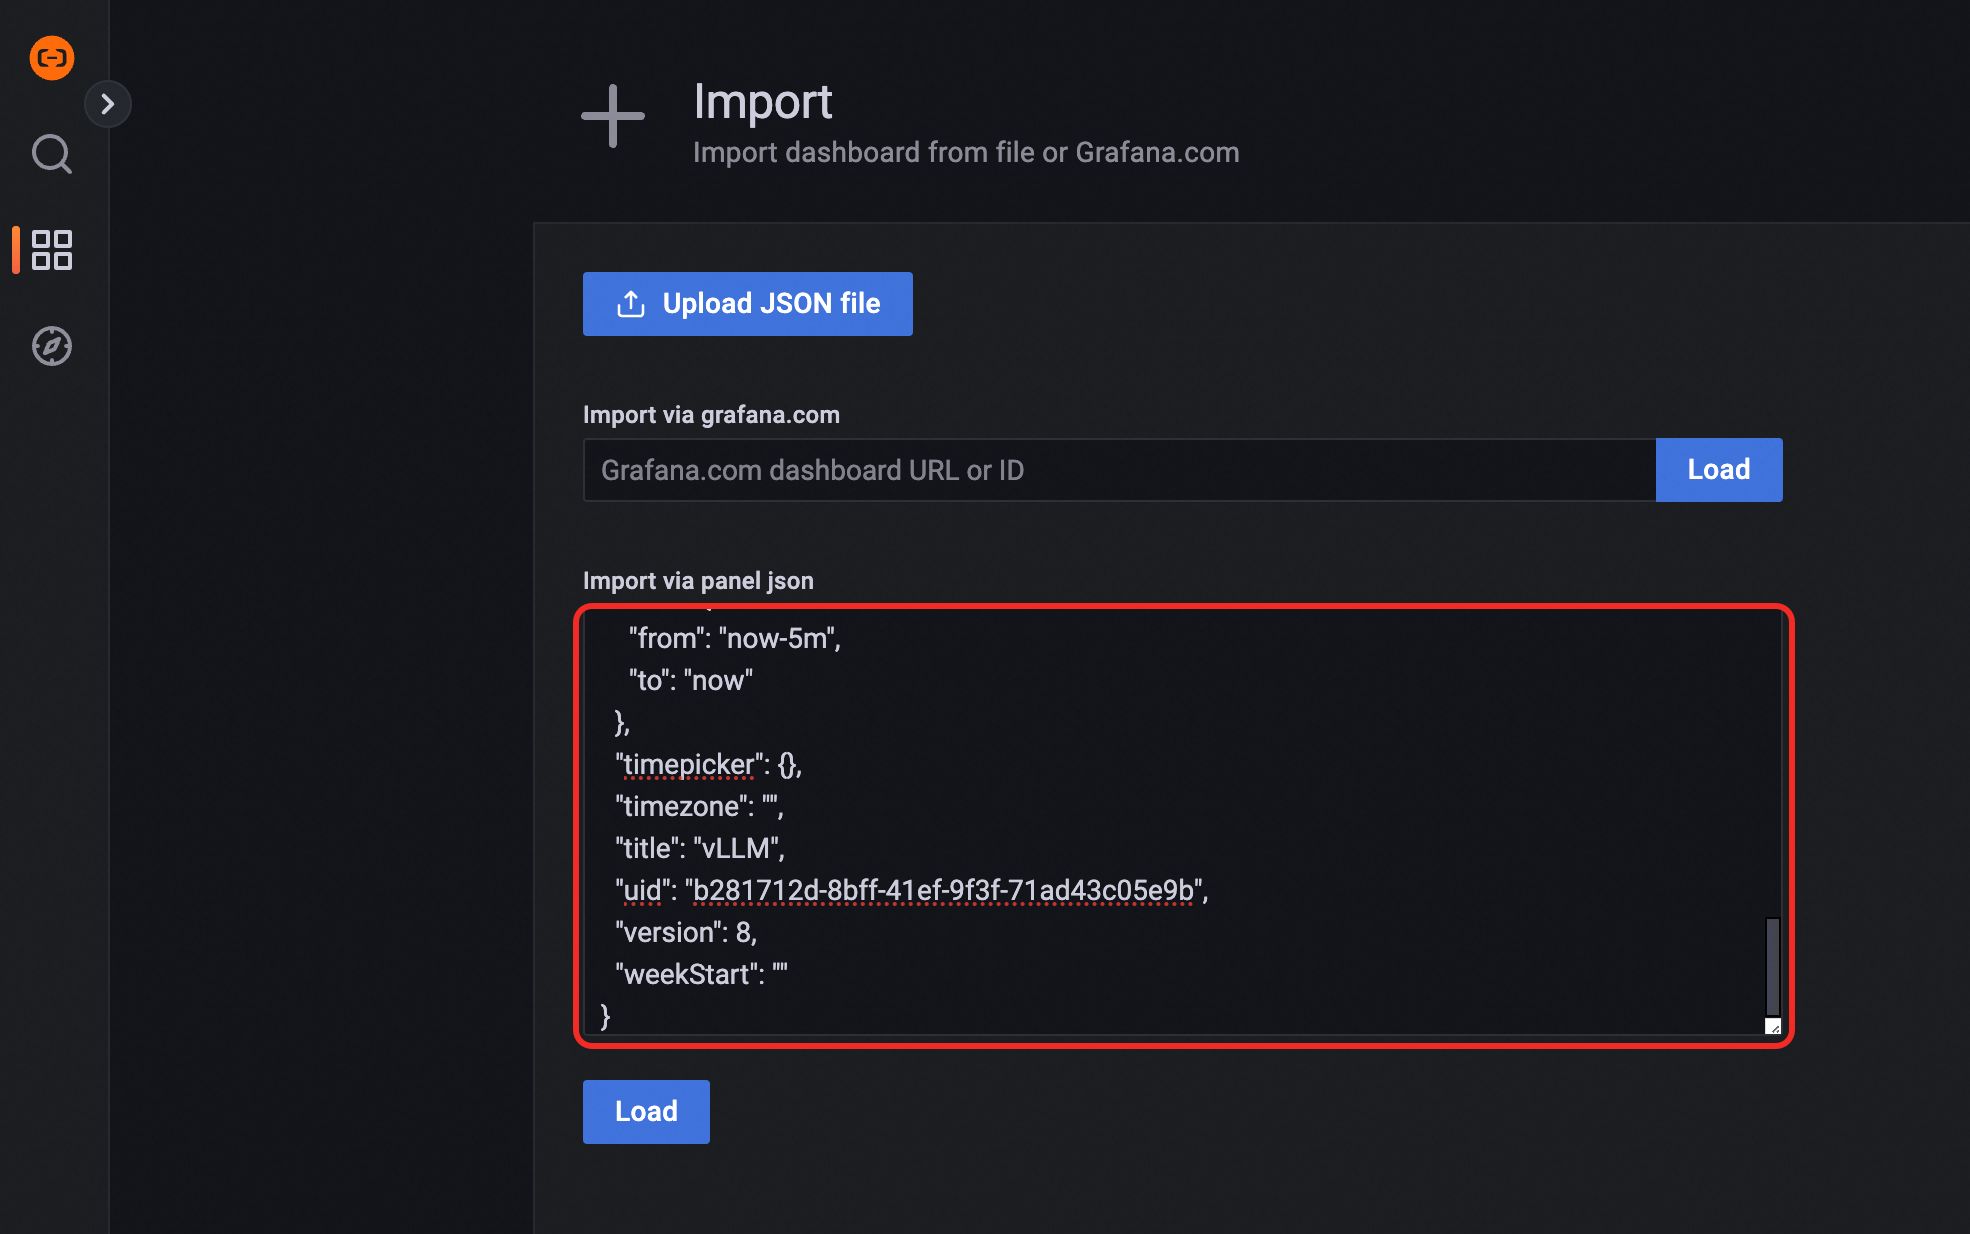
    Pastikan instans Prometheus yang digunakan sebagai sumber data untuk Grafana telah mengumpulkan metrik pemantauan vLLM. Untuk membuat dasbor, impor konten JSON berikut ke Grafana.
    image

    Konten JSON

    {
      "annotations": {
        "list": [
          {
            "builtIn": 1,
            "datasource": {
              "type": "grafana",
              "uid": "-- Grafana --"
            },
            "enable": true,
            "hide": true,
            "iconColor": "rgba(0, 211, 255, 1)",
            "name": "Annotations & Alerts",
            "target": {
              "limit": 100,
              "matchAny": false,
              "tags": [],
              "type": "dashboard"
            },
            "type": "dashboard"
          }
        ]
      },
      "description": "Monitoring vLLM Inference Server",
      "editable": true,
      "fiscalYearStartMonth": 0,
      "graphTooltip": 0,
      "id": 1,
      "links": [],
      "liveNow": false,
      "panels": [
        {
          "datasource": {
            "type": "prometheus",
            "uid": "${DS_PROMETHEUS}"
          },
          "description": "End to end request latency measured in seconds.",
          "fieldConfig": {
            "defaults": {
              "color": {
                "mode": "palette-classic"
              },
              "custom": {
                "axisBorderShow": false,
                "axisCenteredZero": false,
                "axisColorMode": "text",
                "axisLabel": "",
                "axisPlacement": "auto",
                "barAlignment": 0,
                "barWidthFactor": 0.6,
                "drawStyle": "line",
                "fillOpacity": 0,
                "gradientMode": "none",
                "hideFrom": {
                  "legend": false,
                  "tooltip": false,
                  "viz": false
                },
                "insertNulls": false,
                "lineInterpolation": "linear",
                "lineWidth": 1,
                "pointSize": 5,
                "scaleDistribution": {
                  "type": "linear"
                },
                "showPoints": "auto",
                "spanNulls": false,
                "stacking": {
                  "group": "A",
                  "mode": "none"
                },
                "thresholdsStyle": {
                  "mode": "off"
                }
              },
              "mappings": [],
              "thresholds": {
                "mode": "absolute",
                "steps": [
                  {
                    "color": "green",
                    "value": null
                  },
                  {
                    "color": "red",
                    "value": 80
                  }
                ]
              },
              "unit": "s"
            },
            "overrides": []
          },
          "gridPos": {
            "h": 8,
            "w": 12,
            "x": 0,
            "y": 0
          },
          "id": 9,
          "options": {
            "legend": {
              "calcs": [],
              "displayMode": "list",
              "placement": "bottom",
              "showLegend": true
            },
            "tooltip": {
              "mode": "single",
              "sort": "none"
            }
          },
          "targets": [
            {
              "datasource": {
                "type": "prometheus",
                "uid": "${DS_PROMETHEUS}"
              },
              "disableTextWrap": false,
              "editorMode": "builder",
              "expr": "histogram_quantile(0.99, sum by(le) (rate(vllm:e2e_request_latency_seconds_bucket{model_name=\"$model_name\"}[$__rate_interval])))",
              "fullMetaSearch": false,
              "includeNullMetadata": false,
              "instant": false,
              "legendFormat": "P99",
              "range": true,
              "refId": "A",
              "useBackend": false
            },
            {
              "datasource": {
                "type": "prometheus",
                "uid": "${DS_PROMETHEUS}"
              },
              "disableTextWrap": false,
              "editorMode": "builder",
              "expr": "histogram_quantile(0.95, sum by(le) (rate(vllm:e2e_request_latency_seconds_bucket{model_name=\"$model_name\"}[$__rate_interval])))",
              "fullMetaSearch": false,
              "hide": false,
              "includeNullMetadata": false,
              "instant": false,
              "legendFormat": "P95",
              "range": true,
              "refId": "B",
              "useBackend": false
            },
            {
              "datasource": {
                "type": "prometheus",
                "uid": "${DS_PROMETHEUS}"
              },
              "disableTextWrap": false,
              "editorMode": "builder",
              "expr": "histogram_quantile(0.9, sum by(le) (rate(vllm:e2e_request_latency_seconds_bucket{model_name=\"$model_name\"}[$__rate_interval])))",
              "fullMetaSearch": false,
              "hide": false,
              "includeNullMetadata": false,
              "instant": false,
              "legendFormat": "P90",
              "range": true,
              "refId": "C",
              "useBackend": false
            },
            {
              "datasource": {
                "type": "prometheus",
                "uid": "${DS_PROMETHEUS}"
              },
              "disableTextWrap": false,
              "editorMode": "builder",
              "expr": "histogram_quantile(0.5, sum by(le) (rate(vllm:e2e_request_latency_seconds_bucket{model_name=\"$model_name\"}[$__rate_interval])))",
              "fullMetaSearch": false,
              "hide": false,
              "includeNullMetadata": false,
              "instant": false,
              "legendFormat": "P50",
              "range": true,
              "refId": "D",
              "useBackend": false
            },
            {
              "datasource": {
                "type": "prometheus",
                "uid": "${DS_PROMETHEUS}"
              },
              "editorMode": "code",
              "expr": "rate(vllm:e2e_request_latency_seconds_sum{model_name=\"$model_name\"}[$__rate_interval])\n/\nrate(vllm:e2e_request_latency_seconds_count{model_name=\"$model_name\"}[$__rate_interval])",
              "hide": false,
              "instant": false,
              "legendFormat": "Average",
              "range": true,
              "refId": "E"
            }
          ],
          "title": "E2E Request Latency",
          "type": "timeseries"
        },
        {
          "datasource": {
            "type": "prometheus",
            "uid": "${DS_PROMETHEUS}"
          },
          "description": "Number of tokens processed per second",
          "fieldConfig": {
            "defaults": {
              "color": {
                "mode": "palette-classic"
              },
              "custom": {
                "axisBorderShow": false,
                "axisCenteredZero": false,
                "axisColorMode": "text",
                "axisLabel": "",
                "axisPlacement": "auto",
                "barAlignment": 0,
                "barWidthFactor": 0.6,
                "drawStyle": "line",
                "fillOpacity": 0,
                "gradientMode": "none",
                "hideFrom": {
                  "legend": false,
                  "tooltip": false,
                  "viz": false
                },
                "insertNulls": false,
                "lineInterpolation": "linear",
                "lineWidth": 1,
                "pointSize": 5,
                "scaleDistribution": {
                  "type": "linear"
                },
                "showPoints": "auto",
                "spanNulls": false,
                "stacking": {
                  "group": "A",
                  "mode": "none"
                },
                "thresholdsStyle": {
                  "mode": "off"
                }
              },
              "mappings": [],
              "thresholds": {
                "mode": "absolute",
                "steps": [
                  {
                    "color": "green",
                    "value": null
                  },
                  {
                    "color": "red",
                    "value": 80
                  }
                ]
              }
            },
            "overrides": []
          },
          "gridPos": {
            "h": 8,
            "w": 12,
            "x": 12,
            "y": 0
          },
          "id": 8,
          "options": {
            "legend": {
              "calcs": [],
              "displayMode": "list",
              "placement": "bottom",
              "showLegend": true
            },
            "tooltip": {
              "mode": "single",
              "sort": "none"
            }
          },
          "targets": [
            {
              "datasource": {
                "type": "prometheus",
                "uid": "${DS_PROMETHEUS}"
              },
              "disableTextWrap": false,
              "editorMode": "builder",
              "expr": "rate(vllm:prompt_tokens_total{model_name=\"$model_name\"}[$__rate_interval])",
              "fullMetaSearch": false,
              "includeNullMetadata": false,
              "instant": false,
              "legendFormat": "Prompt Tokens/Sec",
              "range": true,
              "refId": "A",
              "useBackend": false
            },
            {
              "datasource": {
                "type": "prometheus",
                "uid": "${DS_PROMETHEUS}"
              },
              "disableTextWrap": false,
              "editorMode": "builder",
              "expr": "rate(vllm:generation_tokens_total{model_name=\"$model_name\"}[$__rate_interval])",
              "fullMetaSearch": false,
              "hide": false,
              "includeNullMetadata": false,
              "instant": false,
              "legendFormat": "Generation Tokens/Sec",
              "range": true,
              "refId": "B",
              "useBackend": false
            }
          ],
          "title": "Token Throughput",
          "type": "timeseries"
        },
        {
          "datasource": {
            "type": "prometheus",
            "uid": "${DS_PROMETHEUS}"
          },
          "description": "Inter token latency in seconds.",
          "fieldConfig": {
            "defaults": {
              "color": {
                "mode": "palette-classic"
              },
              "custom": {
                "axisBorderShow": false,
                "axisCenteredZero": false,
                "axisColorMode": "text",
                "axisLabel": "",
                "axisPlacement": "auto",
                "barAlignment": 0,
                "barWidthFactor": 0.6,
                "drawStyle": "line",
                "fillOpacity": 0,
                "gradientMode": "none",
                "hideFrom": {
                  "legend": false,
                  "tooltip": false,
                  "viz": false
                },
                "insertNulls": false,
                "lineInterpolation": "linear",
                "lineWidth": 1,
                "pointSize": 5,
                "scaleDistribution": {
                  "type": "linear"
                },
                "showPoints": "auto",
                "spanNulls": false,
                "stacking": {
                  "group": "A",
                  "mode": "none"
                },
                "thresholdsStyle": {
                  "mode": "off"
                }
              },
              "mappings": [],
              "thresholds": {
                "mode": "absolute",
                "steps": [
                  {
                    "color": "green",
                    "value": null
                  },
                  {
                    "color": "red",
                    "value": 80
                  }
                ]
              },
              "unit": "s"
            },
            "overrides": []
          },
          "gridPos": {
            "h": 8,
            "w": 12,
            "x": 0,
            "y": 8
          },
          "id": 10,
          "options": {
            "legend": {
              "calcs": [],
              "displayMode": "list",
              "placement": "bottom",
              "showLegend": true
            },
            "tooltip": {
              "mode": "single",
              "sort": "none"
            }
          },
          "targets": [
            {
              "datasource": {
                "type": "prometheus",
                "uid": "${DS_PROMETHEUS}"
              },
              "disableTextWrap": false,
              "editorMode": "builder",
              "expr": "histogram_quantile(0.99, sum by(le) (rate(vllm:time_per_output_token_seconds_bucket{model_name=\"$model_name\"}[$__rate_interval])))",
              "fullMetaSearch": false,
              "includeNullMetadata": false,
              "instant": false,
              "legendFormat": "P99",
              "range": true,
              "refId": "A",
              "useBackend": false
            },
            {
              "datasource": {
                "type": "prometheus",
                "uid": "${DS_PROMETHEUS}"
              },
              "disableTextWrap": false,
              "editorMode": "builder",
              "expr": "histogram_quantile(0.95, sum by(le) (rate(vllm:time_per_output_token_seconds_bucket{model_name=\"$model_name\"}[$__rate_interval])))",
              "fullMetaSearch": false,
              "hide": false,
              "includeNullMetadata": false,
              "instant": false,
              "legendFormat": "P95",
              "range": true,
              "refId": "B",
              "useBackend": false
            },
            {
              "datasource": {
                "type": "prometheus",
                "uid": "${DS_PROMETHEUS}"
              },
              "disableTextWrap": false,
              "editorMode": "builder",
              "expr": "histogram_quantile(0.9, sum by(le) (rate(vllm:time_per_output_token_seconds_bucket{model_name=\"$model_name\"}[$__rate_interval])))",
              "fullMetaSearch": false,
              "hide": false,
              "includeNullMetadata": false,
              "instant": false,
              "legendFormat": "P90",
              "range": true,
              "refId": "C",
              "useBackend": false
            },
            {
              "datasource": {
                "type": "prometheus",
                "uid": "${DS_PROMETHEUS}"
              },
              "disableTextWrap": false,
              "editorMode": "builder",
              "expr": "histogram_quantile(0.5, sum by(le) (rate(vllm:time_per_output_token_seconds_bucket{model_name=\"$model_name\"}[$__rate_interval])))",
              "fullMetaSearch": false,
              "hide": false,
              "includeNullMetadata": false,
              "instant": false,
              "legendFormat": "P50",
              "range": true,
              "refId": "D",
              "useBackend": false
            },
            {
              "datasource": {
                "type": "prometheus",
                "uid": "${DS_PROMETHEUS}"
              },
              "editorMode": "code",
              "expr": "rate(vllm:time_per_output_token_seconds_sum{model_name=\"$model_name\"}[$__rate_interval])\n/\nrate(vllm:time_per_output_token_seconds_count{model_name=\"$model_name\"}[$__rate_interval])",
              "hide": false,
              "instant": false,
              "legendFormat": "Mean",
              "range": true,
              "refId": "E"
            }
          ],
          "title": "Time Per Output Token Latency",
          "type": "timeseries"
        },
        {
          "datasource": {
            "type": "prometheus",
            "uid": "${DS_PROMETHEUS}"
          },
          "description": "Number of requests in RUNNING, WAITING, and SWAPPED state",
          "fieldConfig": {
            "defaults": {
              "color": {
                "mode": "palette-classic"
              },
              "custom": {
                "axisBorderShow": false,
                "axisCenteredZero": false,
                "axisColorMode": "text",
                "axisLabel": "",
                "axisPlacement": "auto",
                "barAlignment": 0,
                "barWidthFactor": 0.6,
                "drawStyle": "line",
                "fillOpacity": 0,
                "gradientMode": "none",
                "hideFrom": {
                  "legend": false,
                  "tooltip": false,
                  "viz": false
                },
                "insertNulls": false,
                "lineInterpolation": "linear",
                "lineWidth": 1,
                "pointSize": 5,
                "scaleDistribution": {
                  "type": "linear"
                },
                "showPoints": "auto",
                "spanNulls": false,
                "stacking": {
                  "group": "A",
                  "mode": "none"
                },
                "thresholdsStyle": {
                  "mode": "off"
                }
              },
              "mappings": [],
              "thresholds": {
                "mode": "absolute",
                "steps": [
                  {
                    "color": "green",
                    "value": null
                  },
                  {
                    "color": "red",
                    "value": 80
                  }
                ]
              },
              "unit": "none"
            },
            "overrides": []
          },
          "gridPos": {
            "h": 8,
            "w": 12,
            "x": 12,
            "y": 8
          },
          "id": 3,
          "options": {
            "legend": {
              "calcs": [],
              "displayMode": "list",
              "placement": "bottom",
              "showLegend": true
            },
            "tooltip": {
              "mode": "single",
              "sort": "none"
            }
          },
          "targets": [
            {
              "datasource": {
                "type": "prometheus",
                "uid": "${DS_PROMETHEUS}"
              },
              "disableTextWrap": false,
              "editorMode": "builder",
              "expr": "vllm:num_requests_running{model_name=\"$model_name\"}",
              "fullMetaSearch": false,
              "includeNullMetadata": true,
              "instant": false,
              "legendFormat": "Num Running",
              "range": true,
              "refId": "A",
              "useBackend": false
            },
            {
              "datasource": {
                "type": "prometheus",
                "uid": "${DS_PROMETHEUS}"
              },
              "disableTextWrap": false,
              "editorMode": "builder",
              "expr": "vllm:num_requests_swapped{model_name=\"$model_name\"}",
              "fullMetaSearch": false,
              "hide": false,
              "includeNullMetadata": true,
              "instant": false,
              "legendFormat": "Num Swapped",
              "range": true,
              "refId": "B",
              "useBackend": false
            },
            {
              "datasource": {
                "type": "prometheus",
                "uid": "${DS_PROMETHEUS}"
              },
              "disableTextWrap": false,
              "editorMode": "builder",
              "expr": "vllm:num_requests_waiting{model_name=\"$model_name\"}",
              "fullMetaSearch": false,
              "hide": false,
              "includeNullMetadata": true,
              "instant": false,
              "legendFormat": "Num Waiting",
              "range": true,
              "refId": "C",
              "useBackend": false
            }
          ],
          "title": "Scheduler State",
          "type": "timeseries"
        },
        {
          "datasource": {
            "type": "prometheus",
            "uid": "${DS_PROMETHEUS}"
          },
          "description": "P50, P90, P95, and P99 TTFT latency in seconds.",
          "fieldConfig": {
            "defaults": {
              "color": {
                "mode": "palette-classic"
              },
              "custom": {
                "axisBorderShow": false,
                "axisCenteredZero": false,
                "axisColorMode": "text",
                "axisLabel": "",
                "axisPlacement": "auto",
                "barAlignment": 0,
                "barWidthFactor": 0.6,
                "drawStyle": "line",
                "fillOpacity": 0,
                "gradientMode": "none",
                "hideFrom": {
                  "legend": false,
                  "tooltip": false,
                  "viz": false
                },
                "insertNulls": false,
                "lineInterpolation": "linear",
                "lineWidth": 1,
                "pointSize": 5,
                "scaleDistribution": {
                  "type": "linear"
                },
                "showPoints": "auto",
                "spanNulls": false,
                "stacking": {
                  "group": "A",
                  "mode": "none"
                },
                "thresholdsStyle": {
                  "mode": "off"
                }
              },
              "mappings": [],
              "thresholds": {
                "mode": "absolute",
                "steps": [
                  {
                    "color": "green",
                    "value": null
                  },
                  {
                    "color": "red",
                    "value": 80
                  }
                ]
              },
              "unit": "s"
            },
            "overrides": []
          },
          "gridPos": {
            "h": 8,
            "w": 12,
            "x": 0,
            "y": 16
          },
          "id": 5,
          "options": {
            "legend": {
              "calcs": [],
              "displayMode": "list",
              "placement": "bottom",
              "showLegend": true
            },
            "tooltip": {
              "mode": "single",
              "sort": "none"
            }
          },
          "targets": [
            {
              "datasource": {
                "type": "prometheus",
                "uid": "${DS_PROMETHEUS}"
              },
              "disableTextWrap": false,
              "editorMode": "builder",
              "expr": "histogram_quantile(0.99, sum by(le) (rate(vllm:time_to_first_token_seconds_bucket{model_name=\"$model_name\"}[$__rate_interval])))",
              "fullMetaSearch": false,
              "hide": false,
              "includeNullMetadata": false,
              "instant": false,
              "legendFormat": "P99",
              "range": true,
              "refId": "A",
              "useBackend": false
            },
            {
              "datasource": {
                "type": "prometheus",
                "uid": "${DS_PROMETHEUS}"
              },
              "disableTextWrap": false,
              "editorMode": "builder",
              "expr": "histogram_quantile(0.95, sum by(le) (rate(vllm:time_to_first_token_seconds_bucket{model_name=\"$model_name\"}[$__rate_interval])))",
              "fullMetaSearch": false,
              "includeNullMetadata": false,
              "instant": false,
              "legendFormat": "P95",
              "range": true,
              "refId": "B",
              "useBackend": false
            },
            {
              "datasource": {
                "type": "prometheus",
                "uid": "${DS_PROMETHEUS}"
              },
              "disableTextWrap": false,
              "editorMode": "builder",
              "expr": "histogram_quantile(0.9, sum by(le) (rate(vllm:time_to_first_token_seconds_bucket{model_name=\"$model_name\"}[$__rate_interval])))",
              "fullMetaSearch": false,
              "hide": false,
              "includeNullMetadata": false,
              "instant": false,
              "legendFormat": "P90",
              "range": true,
              "refId": "C",
              "useBackend": false
            },
            {
              "datasource": {
                "type": "prometheus",
                "uid": "${DS_PROMETHEUS}"
              },
              "disableTextWrap": false,
              "editorMode": "builder",
              "expr": "histogram_quantile(0.5, sum by(le) (rate(vllm:time_to_first_token_seconds_bucket{model_name=\"$model_name\"}[$__rate_interval])))",
              "fullMetaSearch": false,
              "hide": false,
              "includeNullMetadata": false,
              "instant": false,
              "legendFormat": "P50",
              "range": true,
              "refId": "D",
              "useBackend": false
            },
            {
              "datasource": {
                "type": "prometheus",
                "uid": "${DS_PROMETHEUS}"
              },
              "editorMode": "code",
              "expr": "rate(vllm:time_to_first_token_seconds_sum{model_name=\"$model_name\"}[$__rate_interval])\n/\nrate(vllm:time_to_first_token_seconds_count{model_name=\"$model_name\"}[$__rate_interval])",
              "hide": false,
              "instant": false,
              "legendFormat": "Average",
              "range": true,
              "refId": "E"
            }
          ],
          "title": "Time To First Token Latency",
          "type": "timeseries"
        },
        {
          "datasource": {
            "type": "prometheus",
            "uid": "${DS_PROMETHEUS}"
          },
          "description": "Percentage of used cache blocks by vLLM.",
          "fieldConfig": {
            "defaults": {
              "color": {
                "mode": "palette-classic"
              },
              "custom": {
                "axisBorderShow": false,
                "axisCenteredZero": false,
                "axisColorMode": "text",
                "axisLabel": "",
                "axisPlacement": "auto",
                "barAlignment": 0,
                "barWidthFactor": 0.6,
                "drawStyle": "line",
                "fillOpacity": 0,
                "gradientMode": "none",
                "hideFrom": {
                  "legend": false,
                  "tooltip": false,
                  "viz": false
                },
                "insertNulls": false,
                "lineInterpolation": "linear",
                "lineWidth": 1,
                "pointSize": 5,
                "scaleDistribution": {
                  "type": "linear"
                },
                "showPoints": "auto",
                "spanNulls": false,
                "stacking": {
                  "group": "A",
                  "mode": "none"
                },
                "thresholdsStyle": {
                  "mode": "off"
                }
              },
              "mappings": [],
              "thresholds": {
                "mode": "absolute",
                "steps": [
                  {
                    "color": "green",
                    "value": null
                  },
                  {
                    "color": "red",
                    "value": 80
                  }
                ]
              },
              "unit": "percentunit"
            },
            "overrides": []
          },
          "gridPos": {
            "h": 8,
            "w": 12,
            "x": 12,
            "y": 16
          },
          "id": 4,
          "options": {
            "legend": {
              "calcs": [],
              "displayMode": "list",
              "placement": "bottom",
              "showLegend": true
            },
            "tooltip": {
              "mode": "single",
              "sort": "none"
            }
          },
          "targets": [
            {
              "datasource": {
                "type": "prometheus",
                "uid": "${DS_PROMETHEUS}"
              },
              "editorMode": "code",
              "expr": "vllm:gpu_cache_usage_perc{model_name=\"$model_name\"}",
              "instant": false,
              "legendFormat": "GPU Cache Usage({{ kubernetes_pod_name }})",
              "range": true,
              "refId": "A"
            },
            {
              "datasource": {
                "type": "prometheus",
                "uid": "${DS_PROMETHEUS}"
              },
              "editorMode": "code",
              "expr": "vllm:cpu_cache_usage_perc{model_name=\"$model_name\"}",
              "hide": false,
              "instant": false,
              "legendFormat": "CPU Cache Usage({{ kubernetes_pod_name }})",
              "range": true,
              "refId": "B"
            }
          ],
          "title": "Cache Utilization",
          "type": "timeseries"
        },
        {
          "datasource": {
            "type": "prometheus",
            "uid": "${DS_PROMETHEUS}"
          },
          "description": "Heatmap of request prompt length",
          "fieldConfig": {
            "defaults": {
              "custom": {
                "hideFrom": {
                  "legend": false,
                  "tooltip": false,
                  "viz": false
                },
                "scaleDistribution": {
                  "type": "linear"
                }
              }
            },
            "overrides": []
          },
          "gridPos": {
            "h": 8,
            "w": 12,
            "x": 0,
            "y": 24
          },
          "id": 12,
          "options": {
            "calculate": false,
            "cellGap": 1,
            "cellValues": {
              "unit": "none"
            },
            "color": {
              "exponent": 0.5,
              "fill": "dark-orange",
              "min": 0,
              "mode": "scheme",
              "reverse": false,
              "scale": "exponential",
              "scheme": "Spectral",
              "steps": 64
            },
            "exemplars": {
              "color": "rgba(255,0,255,0.7)"
            },
            "filterValues": {
              "le": 1e-9
            },
            "legend": {
              "show": true
            },
            "rowsFrame": {
              "layout": "auto",
              "value": "Request count"
            },
            "tooltip": {
              "mode": "single",
              "showColorScale": false,
              "yHistogram": true
            },
            "yAxis": {
              "axisLabel": "Prompt Length",
              "axisPlacement": "left",
              "reverse": false,
              "unit": "none"
            }
          },
          "pluginVersion": "11.2.0",
          "targets": [
            {
              "datasource": {
                "type": "prometheus",
                "uid": "${DS_PROMETHEUS}"
              },
              "disableTextWrap": false,
              "editorMode": "builder",
              "expr": "sum by(le) (increase(vllm:request_prompt_tokens_bucket{model_name=\"$model_name\"}[$__rate_interval]))",
              "format": "heatmap",
              "fullMetaSearch": false,
              "includeNullMetadata": true,
              "instant": false,
              "legendFormat": "{{le}}",
              "range": true,
              "refId": "A",
              "useBackend": false
            }
          ],
          "title": "Request Prompt Length",
          "type": "heatmap"
        },
        {
          "datasource": {
            "type": "prometheus",
            "uid": "${DS_PROMETHEUS}"
          },
          "description": "Heatmap of request generation length",
          "fieldConfig": {
            "defaults": {
              "custom": {
                "hideFrom": {
                  "legend": false,
                  "tooltip": false,
                  "viz": false
                },
                "scaleDistribution": {
                  "type": "linear"
                }
              }
            },
            "overrides": []
          },
          "gridPos": {
            "h": 8,
            "w": 12,
            "x": 12,
            "y": 24
          },
          "id": 13,
          "options": {
            "calculate": false,
            "cellGap": 1,
            "cellValues": {
              "unit": "none"
            },
            "color": {
              "exponent": 0.5,
              "fill": "dark-orange",
              "min": 0,
              "mode": "scheme",
              "reverse": false,
              "scale": "exponential",
              "scheme": "Spectral",
              "steps": 64
            },
            "exemplars": {
              "color": "rgba(255,0,255,0.7)"
            },
            "filterValues": {
              "le": 1e-9
            },
            "legend": {
              "show": true
            },
            "rowsFrame": {
              "layout": "auto",
              "value": "Request count"
            },
            "tooltip": {
              "mode": "single",
              "showColorScale": false,
              "yHistogram": true
            },
            "yAxis": {
              "axisLabel": "Generation Length",
              "axisPlacement": "left",
              "reverse": false,
              "unit": "none"
            }
          },
          "pluginVersion": "11.2.0",
          "targets": [
            {
              "datasource": {
                "type": "prometheus",
                "uid": "${DS_PROMETHEUS}"
              },
              "disableTextWrap": false,
              "editorMode": "builder",
              "expr": "sum by(le) (increase(vllm:request_generation_tokens_bucket{model_name=\"$model_name\"}[$__rate_interval]))",
              "format": "heatmap",
              "fullMetaSearch": false,
              "includeNullMetadata": true,
              "instant": false,
              "legendFormat": "{{le}}",
              "range": true,
              "refId": "A",
              "useBackend": false
            }
          ],
          "title": "Request Generation Length",
          "type": "heatmap"
        },
        {
          "datasource": {
            "type": "prometheus",
            "uid": "${DS_PROMETHEUS}"
          },
          "description": "Number of finished requests by their finish reason: either an EOS token was generated or the max sequence length was reached.",
          "fieldConfig": {
            "defaults": {
              "color": {
                "mode": "palette-classic"
              },
              "custom": {
                "axisBorderShow": false,
                "axisCenteredZero": false,
                "axisColorMode": "text",
                "axisLabel": "",
                "axisPlacement": "auto",
                "barAlignment": 0,
                "barWidthFactor": 0.6,
                "drawStyle": "line",
                "fillOpacity": 0,
                "gradientMode": "none",
                "hideFrom": {
                  "legend": false,
                  "tooltip": false,
                  "viz": false
                },
                "insertNulls": false,
                "lineInterpolation": "linear",
                "lineWidth": 1,
                "pointSize": 5,
                "scaleDistribution": {
                  "type": "linear"
                },
                "showPoints": "auto",
                "spanNulls": false,
                "stacking": {
                  "group": "A",
                  "mode": "none"
                },
                "thresholdsStyle": {
                  "mode": "off"
                }
              },
              "mappings": [],
              "thresholds": {
                "mode": "absolute",
                "steps": [
                  {
                    "color": "green"
                  },
                  {
                    "color": "red",
                    "value": 80
                  }
                ]
              }
            },
            "overrides": []
          },
          "gridPos": {
            "h": 8,
            "w": 12,
            "x": 0,
            "y": 32
          },
          "id": 11,
          "options": {
            "legend": {
              "calcs": [],
              "displayMode": "list",
              "placement": "bottom",
              "showLegend": true
            },
            "tooltip": {
              "mode": "single",
              "sort": "none"
            }
          },
          "targets": [
            {
              "datasource": {
                "type": "prometheus",
                "uid": "${DS_PROMETHEUS}"
              },
              "disableTextWrap": false,
              "editorMode": "builder",
              "expr": "sum by(finished_reason) (increase(vllm:request_success_total{model_name=\"$model_name\"}[$__rate_interval]))",
              "fullMetaSearch": false,
              "includeNullMetadata": true,
              "instant": false,
              "interval": "",
              "legendFormat": "__auto",
              "range": true,
              "refId": "A",
              "useBackend": false
            }
          ],
          "title": "Finish Reason",
          "type": "timeseries"
        },
        {
          "datasource": {
            "default": false,
            "type": "prometheus",
            "uid": "${DS_PROMETHEUS}"
          },
          "fieldConfig": {
            "defaults": {
              "color": {
                "mode": "palette-classic"
              },
              "custom": {
                "axisBorderShow": false,
                "axisCenteredZero": false,
                "axisColorMode": "text",
                "axisLabel": "seconds",
                "axisPlacement": "auto",
                "barAlignment": 0,
                "barWidthFactor": 0.6,
                "drawStyle": "line",
                "fillOpacity": 0,
                "gradientMode": "none",
                "hideFrom": {
                  "legend": false,
                  "tooltip": false,
                  "viz": false
                },
                "insertNulls": false,
                "lineInterpolation": "linear",
                "lineWidth": 1,
                "pointSize": 5,
                "scaleDistribution": {
                  "type": "linear"
                },
                "showPoints": "auto",
                "spanNulls": false,
                "stacking": {
                  "group": "A",
                  "mode": "none"
                },
                "thresholdsStyle": {
                  "mode": "off"
                }
              },
              "mappings": [],
              "thresholds": {
                "mode": "absolute",
                "steps": [
                  {
                    "color": "green"
                  },
                  {
                    "color": "red",
                    "value": 80
                  }
                ]
              }
            },
            "overrides": []
          },
          "gridPos": {
            "h": 8,
            "w": 12,
            "x": 12,
            "y": 32
          },
          "id": 14,
          "options": {
            "legend": {
              "calcs": [],
              "displayMode": "list",
              "placement": "bottom",
              "showLegend": true
            },
            "tooltip": {
              "mode": "single",
              "sort": "none"
            }
          },
          "targets": [
            {
              "datasource": {
                "type": "prometheus",
                "uid": "${DS_PROMETHEUS}"
              },
              "disableTextWrap": false,
              "editorMode": "code",
              "expr": "rate(vllm:request_queue_time_seconds_sum{model_name=\"$model_name\"}[$__rate_interval])",
              "fullMetaSearch": false,
              "includeNullMetadata": true,
              "instant": false,
              "legendFormat": "{{kubernetes_pod_name}}",
              "range": true,
              "refId": "A",
              "useBackend": false
            }
          ],
          "title": "Queue Time",
          "type": "timeseries"
        },
        {
          "datasource": {
            "default": false,
            "type": "prometheus",
            "uid": "${DS_PROMETHEUS}"
          },
          "fieldConfig": {
            "defaults": {
              "color": {
                "mode": "palette-classic"
              },
              "custom": {
                "axisBorderShow": false,
                "axisCenteredZero": false,
                "axisColorMode": "text",
                "axisLabel": "",
                "axisPlacement": "auto",
                "barAlignment": 0,
                "barWidthFactor": 0.6,
                "drawStyle": "line",
                "fillOpacity": 0,
                "gradientMode": "none",
                "hideFrom": {
                  "legend": false,
                  "tooltip": false,
                  "viz": false
                },
                "insertNulls": false,
                "lineInterpolation": "linear",
                "lineWidth": 1,
                "pointSize": 5,
                "scaleDistribution": {
                  "type": "linear"
                },
                "showPoints": "auto",
                "spanNulls": false,
                "stacking": {
                  "group": "A",
                  "mode": "none"
                },
                "thresholdsStyle": {
                  "mode": "off"
                }
              },
              "mappings": [],
              "thresholds": {
                "mode": "absolute",
                "steps": [
                  {
                    "color": "green"
                  },
                  {
                    "color": "red",
                    "value": 80
                  }
                ]
              }
            },
            "overrides": []
          },
          "gridPos": {
            "h": 8,
            "w": 12,
            "x": 0,
            "y": 40
          },
          "id": 15,
          "options": {
            "legend": {
              "calcs": [],
              "displayMode": "list",
              "placement": "bottom",
              "showLegend": true
            },
            "tooltip": {
              "mode": "single",
              "sort": "none"
            }
          },
          "targets": [
            {
              "datasource": {
                "type": "prometheus",
                "uid": "${DS_PROMETHEUS}"
              },
              "disableTextWrap": false,
              "editorMode": "code",
              "expr": "rate(vllm:request_prefill_time_seconds_sum{model_name=\"$model_name\"}[$__rate_interval])",
              "fullMetaSearch": false,
              "includeNullMetadata": true,
              "instant": false,
              "legendFormat": "Prefill",
              "range": true,
              "refId": "A",
              "useBackend": false
            },
            {
              "datasource": {
                "type": "prometheus",
                "uid": "${DS_PROMETHEUS}"
              },
              "editorMode": "code",
              "expr": "rate(vllm:request_decode_time_seconds_sum{model_name=\"$model_name\"}[$__rate_interval])",
              "hide": false,
              "instant": false,
              "legendFormat": "Decode",
              "range": true,
              "refId": "B"
            }
          ],
          "title": "Requests Prefill and Decode Time",
          "type": "timeseries"
        },
        {
          "datasource": {
            "default": false,
            "type": "prometheus",
            "uid": "${DS_PROMETHEUS}"
          },
          "fieldConfig": {
            "defaults": {
              "color": {
                "mode": "palette-classic"
              },
              "custom": {
                "axisBorderShow": false,
                "axisCenteredZero": false,
                "axisColorMode": "text",
                "axisLabel": "",
                "axisPlacement": "auto",
                "barAlignment": 0,
                "barWidthFactor": 0.6,
                "drawStyle": "line",
                "fillOpacity": 0,
                "gradientMode": "none",
                "hideFrom": {
                  "legend": false,
                  "tooltip": false,
                  "viz": false
                },
                "insertNulls": false,
                "lineInterpolation": "linear",
                "lineWidth": 1,
                "pointSize": 5,
                "scaleDistribution": {
                  "type": "linear"
                },
                "showPoints": "auto",
                "spanNulls": false,
                "stacking": {
                  "group": "A",
                  "mode": "none"
                },
                "thresholdsStyle": {
                  "mode": "off"
                }
              },
              "mappings": [],
              "thresholds": {
                "mode": "absolute",
                "steps": [
                  {
                    "color": "green"
                  },
                  {
                    "color": "red",
                    "value": 80
                  }
                ]
              }
            },
            "overrides": []
          },
          "gridPos": {
            "h": 8,
            "w": 12,
            "x": 12,
            "y": 40
          },
          "id": 16,
          "options": {
            "legend": {
              "calcs": [],
              "displayMode": "list",
              "placement": "bottom",
              "showLegend": true
            },
            "tooltip": {
              "mode": "single",
              "sort": "none"
            }
          },
          "targets": [
            {
              "datasource": {
                "type": "prometheus",
                "uid": "${DS_PROMETHEUS}"
              },
              "disableTextWrap": false,
              "editorMode": "code",
              "expr": "rate(vllm:request_max_num_generation_tokens_sum{model_name=\"$model_name\"}[$__rate_interval])",
              "fullMetaSearch": false,
              "includeNullMetadata": true,
              "instant": false,
              "legendFormat": "Tokens",
              "range": true,
              "refId": "A",
              "useBackend": false
            }
          ],
          "title": "Max Generation Token in Sequence Group",
          "type": "timeseries"
        }
      ],
      "refresh": "",
      "schemaVersion": 39,
      "tags": [],
      "templating": {
        "list": [
          {
            "current": {
              "selected": false,
              "text": "prometheus",
              "value": "edx8memhpd9tsa"
            },
            "hide": 0,
            "includeAll": false,
            "label": "datasource",
            "multi": false,
            "name": "DS_PROMETHEUS",
            "options": [],
            "query": "prometheus",
            "queryValue": "",
            "refresh": 1,
            "regex": "",
            "skipUrlSync": false,
            "type": "datasource"
          },
          {
            "current": {
              "selected": false,
              "text": "/share/datasets/public_models/Meta-Llama-3-8B-Instruct",
              "value": "/share/datasets/public_models/Meta-Llama-3-8B-Instruct"
            },
            "datasource": {
              "type": "prometheus",
              "uid": "${DS_PROMETHEUS}"
            },
            "definition": "label_values(model_name)",
            "hide": 0,
            "includeAll": false,
            "label": "model_name",
            "multi": false,
            "name": "model_name",
            "options": [],
            "query": {
              "query": "label_values(model_name)",
              "refId": "StandardVariableQuery"
            },
            "refresh": 1,
            "regex": "",
            "skipUrlSync": false,
            "sort": 0,
            "type": "query"
          }
        ]
      },
      "time": {
        "from": "now-5m",
        "to": "now"
      },
      "timepicker": {},
      "timezone": "",
      "title": "vLLM"
    }

    Pratinjau:

    image

  3. Di kluster ACK, gunakan vllm benchmark untuk melakukan uji stres terhadap layanan inferensi dan membandingkan load balancing antara HTTP Route dan LLM Route.

    1. Deploy workload benchmark.

      kubectl apply -f- <<EOF
      apiVersion: apps/v1
      kind: Deployment
      metadata:
        labels:
          app: vllm-benchmark
        name: vllm-benchmark
        namespace: default
      spec:
        progressDeadlineSeconds: 600
        replicas: 1
        revisionHistoryLimit: 10
        selector:
          matchLabels:
            app: vllm-benchmark
        strategy:
          rollingUpdate:
            maxSurge: 25%
            maxUnavailable: 25%
          type: RollingUpdate
        template:
          metadata:
            creationTimestamp: null
            labels:
              app: vllm-benchmark
          spec:
            containers:
            - command:
              - sh
              - -c
              - sleep inf
              image: registry-cn-hangzhou.ack.aliyuncs.com/dev/llm-benchmark:random-and-qa
              imagePullPolicy: IfNotPresent
              name: vllm-benchmark
              resources: {}
              terminationMessagePath: /dev/termination-log
              terminationMessagePolicy: File
            dnsPolicy: ClusterFirst
            restartPolicy: Always
            schedulerName: default-scheduler
            securityContext: {}
            terminationGracePeriodSeconds: 30
      EOF
    2. Jalankan uji stres.

      1. Ambil alamat IP internal Gateway.

        export GW_IP=$(kubectl get svc -n envoy-gateway-system -l gateway.envoyproxy.io/owning-gateway-namespace=default,gateway.envoyproxy.io/owning-gateway-name=qwen-inference-gateway -o jsonpath='{.items[0].spec.clusterIP}')
      2. Jalankan uji stres.

        HTTP route

        kubectl exec -it deploy/vllm-benchmark -- env GW_IP=${GW_IP} python3 /root/vllm/benchmarks/benchmark_serving.py \
        --backend vllm \
        --model /models/DeepSeek-R1-Distill-Qwen-7B \
        --served-model-name /model/qwen \
        --trust-remote-code \
        --dataset-name random \
        --random-prefix-len 10 \
        --random-input-len 1550 \
        --random-output-len 1800 \
        --random-range-ratio 0.2 \
        --num-prompts 3000 \
        --max-concurrency 200 \
        --host $GW_IP \
        --port 8080 \
        --endpoint /v1/completions \
        --save-result \
        2>&1 | tee benchmark_serving.txt

        LLM route

        kubectl exec -it deploy/vllm-benchmark -- env GW_IP=${GW_IP} python3 /root/vllm/benchmarks/benchmark_serving.py \
        --backend vllm \
        --model /models/DeepSeek-R1-Distill-Qwen-7B \
        --served-model-name /model/qwen \
        --trust-remote-code \
        --dataset-name random \
        --random-prefix-len 10 \
        --random-input-len 1550 \
        --random-output-len 1800 \
        --random-range-ratio 0.2 \
        --num-prompts 3000 \
        --max-concurrency 200 \
        --host $GW_IP \
        --port 8081 \
        --endpoint /v1/completions \
        --save-result \
        2>&1 | tee benchmark_serving.txt

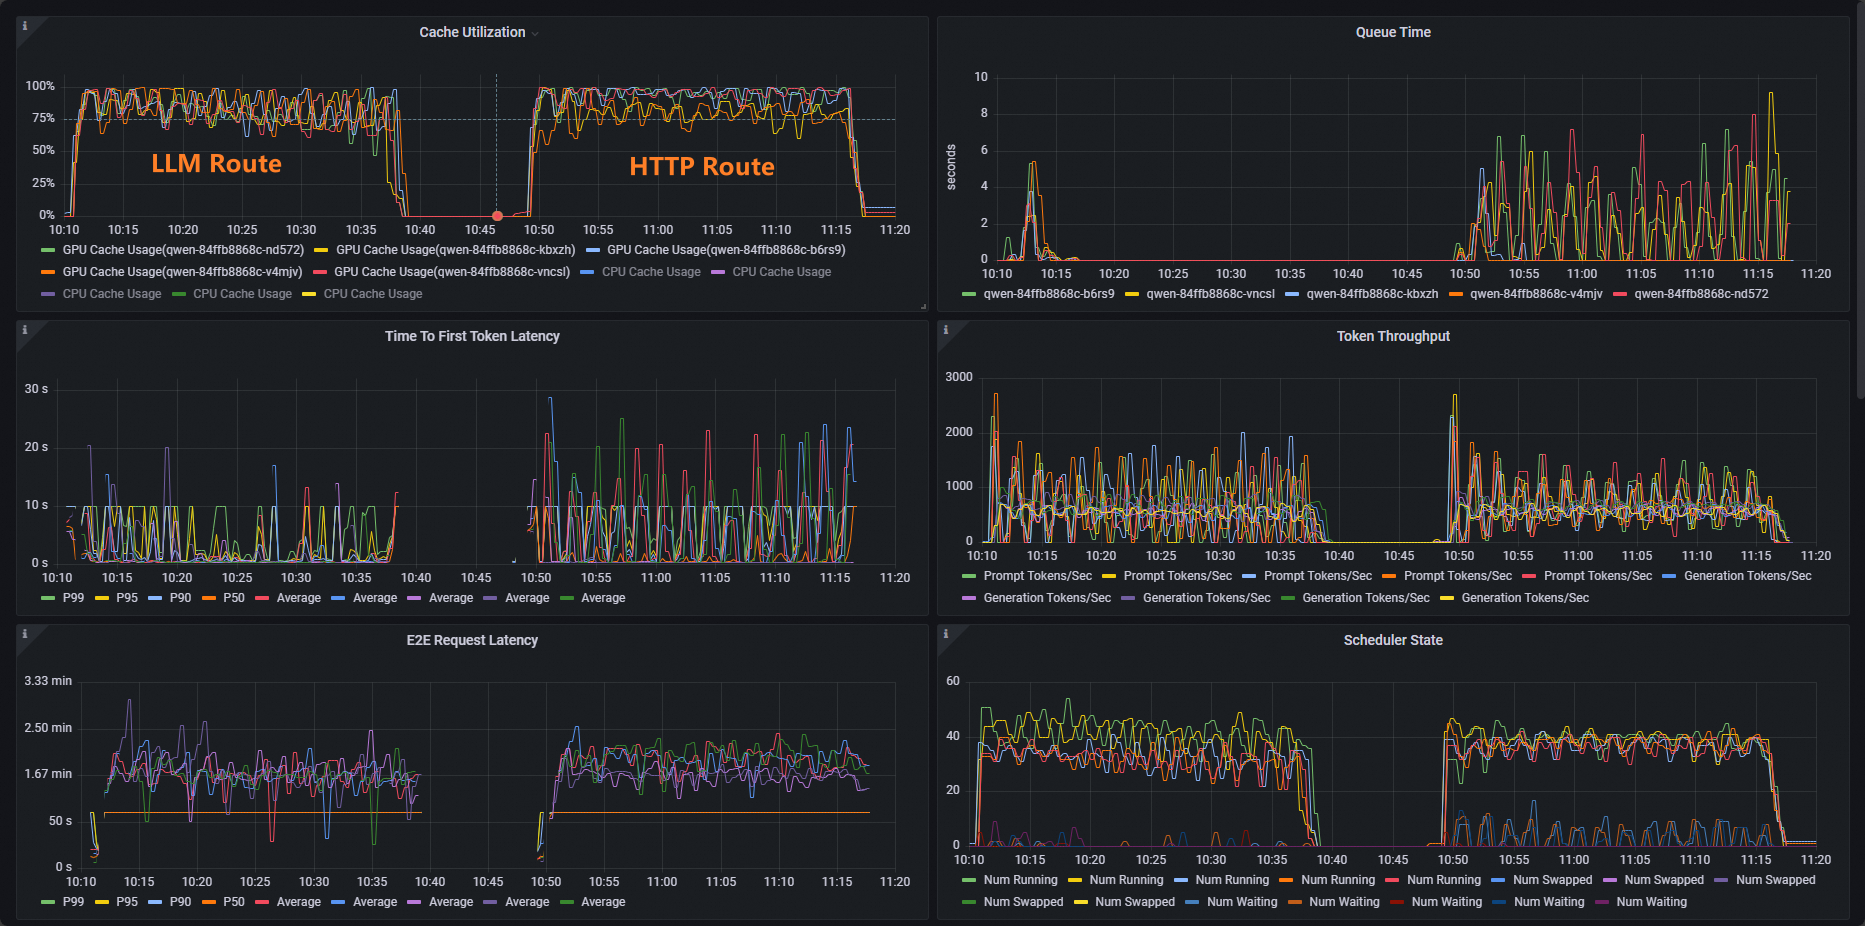
    Setelah menyelesaikan kedua pengujian, lihat dasbor untuk membandingkan performa routing antara HTTP Route dan LLM Route.
    49c8528de7c25b87093795a1bac152fc

    Dasbor menunjukkan bahwa workload HTTP Route memiliki distribusi Cache Utilization yang tidak merata, sedangkan workload LLM Route memiliki distribusi normal.

Operasi terkait

mendukung strategi load balancing berbeda untuk berbagai kasus penggunaan layanan inferensi. Untuk mengonfigurasi strategi load balancing bagi permintaan inferensi yang diarahkan ke pod dalam InferencePool, tambahkan anotasi inference.networking.x-k8s.io/routing-strategy ke resource InferencePool.

Contoh berikut menggunakan selektor app: vllm-app untuk memilih pod layanan inferensi dan menetapkan strategi load balancing ke strategi default berbasis metrik.

apiVersion: inference.networking.x-k8s.io/v1alpha2
kind: InferencePool
metadata:
  name: vllm-app-pool
  annotations:
    inference.networking.x-k8s.io/routing-strategy: "DEFAULT"
spec:
  targetPortNumber: 8000
  selector:
    app: vllm-app
  extensionRef:
    name: inference-gateway-ext-proc

Strategi load balancing berikut didukung:

Strategi

Deskripsi

DEFAULT

Strategi load balancing berbasis metrik. Strategi ini mengevaluasi status internal server inferensi menggunakan metrik multidimensi, seperti panjang antrian permintaan dan pemanfaatan cache GPU. Kemudian, strategi ini mendistribusikan traffic ke beberapa workload server inferensi berdasarkan status tersebut.

PREFIX_CACHE

Strategi load balancing yang menggunakan pencocokan awalan permintaan. Strategi ini berusaha mengarahkan permintaan yang memiliki awalan umum ke pod server inferensi yang sama. Strategi ini ideal untuk skenario dengan volume permintaan tinggi yang berbagi awalan, terutama ketika server inferensi telah mengaktifkan auto prefix caching.

Kasus penggunaan khas meliputi:

  • Kueri dokumen panjang: Pengguna berulang kali mengajukan kueri terhadap dokumen panjang yang sama, seperti manual perangkat lunak atau laporan tahunan, dengan pertanyaan berbeda.

  • Konversasi multi-turn: Pengguna berinteraksi dengan aplikasi beberapa kali dalam sesi chat yang sama.