Topik ini mencantumkan pertanyaan yang sering diajukan (FAQ) dan menyediakan solusi untuk ApsaraDB for ClickHouse.
Pemilihan dan pembelian
Scale-out dan scale-in
Koneksi
Migrasi dan sinkronisasi
Bagaimana cara menangani error "too many parts" saat mengimpor data?
Bagaimana cara mengimpor data dari instans ClickHouse yang ada ke instans ApsaraDB for ClickHouse?
Bagaimana cara menangani error "Too many partitions for single INSERT block (more than 100)"?
Bagaimana cara menangani masalah konektivitas jaringan antara kluster target dan sumber data?
Penulisan dan kueri data
Bagaimana cara menangani error kehabisan memori saat menjalankan pernyataan INSERT INTO SELECT?
Bagaimana cara menangani error kehabisan memori selama kueri?
Bagaimana cara menangani error batas konkurensi selama kueri?
Mengapa tabel yang baru dibuat kadang tidak terlihat dan hasil kueri berfluktuasi?
Apa yang harus dilakukan jika tabel tidak ada setelah dibuat?
Mengapa data tidak bertambah setelah tabel eksternal Kafka dibuat?
Mengapa waktu yang ditampilkan pada client berbeda dari waktu di zona waktu yang ditentukan?
Mengapa data tidak digabung berdasarkan primary key setelah tugas OPTIMIZE dijalankan?
Mengapa TTL data tidak berlaku setelah tugas OPTIMIZE dijalankan?
Mengapa operasi update dan delete tidak berlaku setelah tugas OPTIMIZE dijalankan?
Bagaimana cara menjalankan pernyataan DDL untuk menambah, menghapus, atau memodifikasi kolom?
Mengapa pernyataan DDL dieksekusi secara lambat dan sering macet?
Bagaimana cara menangani error sintaksis "set global on cluster default"?
Mengapa kata kunci FINAL untuk deduplikasi gagal karena JOIN di ClickHouse?
Penyimpanan data
Pemantauan, peningkatan, dan parameter sistem
Lainnya
Fitur apa saja yang ditawarkan ApsaraDB for ClickHouse dibandingkan dengan versi resmi?
ApsaraDB for ClickHouse terutama memperbaiki bug stabilitas yang ditemukan pada versi komunitas dan menyediakan antrian sumber daya yang memungkinkan Anda mengonfigurasi prioritas penggunaan sumber daya pada tingkat peran pengguna.
Saat membeli instans ApsaraDB for ClickHouse, versi mana yang direkomendasikan?
ApsaraDB for ClickHouse didasarkan pada versi kernel Long-Term Support (LTS) yang stabil dari komunitas open source. Versi biasanya ditawarkan sebagai layanan cloud setelah stabil selama kurang lebih tiga bulan. Kami merekomendasikan Anda membeli versi 21.8 atau yang lebih baru. Untuk informasi lebih lanjut tentang fitur berbagai versi, lihat Perbandingan fitur versi.
Apa saja fitur instans single-replica dan master-replica?
Instans single-replica tidak memiliki node replika untuk setiap shard dan karena itu tidak menyediakan ketersediaan tinggi. Instans ini memberikan efektivitas biaya tinggi dengan memastikan keamanan data melalui penyimpanan multi-replika pada disk cloud.
Instans master-replica memiliki node layanan replika untuk setiap shard. Node replika menyediakan pemulihan bencana jika node utama gagal.
Bagaimana cara menangani pesan "Insufficient resources in the current region" saat membeli sumber daya?
Anda dapat memilih zona lain di wilayah yang sama untuk melakukan pembelian. VPC mendukung konektivitas antar zona dalam wilayah yang sama, dan latensi jaringan dapat diabaikan.
Faktor apa saja yang memengaruhi waktu yang diperlukan untuk skalabilitas horizontal?
Skalabilitas horizontal melibatkan migrasi data. Semakin banyak data yang dimiliki instans, semakin lama proses migrasi berlangsung.
Bagaimana dampak penskalaan terhadap instans?
Untuk memastikan konsistensi data setelah migrasi, instans berada dalam status read-only selama proses penskalaan.
Apa rekomendasi untuk skalabilitas horizontal?
Skalabilitas horizontal membutuhkan waktu lama. Jika kinerja kluster tidak mencukupi, prioritaskan skalabilitas vertikal terlebih dahulu. Untuk informasi lebih lanjut tentang cara melakukan skalabilitas vertikal, lihat Skalabilitas vertikal dan horizontal untuk kluster Edisi Kompatibel-Komunitas.
Apa fungsi masing-masing port?
Protokol | Nomor port | Skenario |
TCP | 3306 | Gunakan untuk menghubungkan ke ApsaraDB For ClickHouse dengan tool clickhouse-client. Untuk informasi lebih lanjut, lihat Hubungkan ke ClickHouse melalui antarmuka baris perintah. |
HTTP | 8123 | Gunakan untuk menghubungkan ke ApsaraDB For ClickHouse menggunakan JDBC untuk pengembangan aplikasi. Untuk informasi lebih lanjut, lihat Hubungkan ke ClickHouse melalui JDBC. |
HTTPS | 8443 | Gunakan untuk mengakses ApsaraDB For ClickHouse menggunakan HTTPS. Untuk informasi lebih lanjut, lihat Hubungkan ke ClickHouse melalui protokol HTTPS. |
Port apa saja yang sesuai untuk menghubungkan ke ApsaraDB for ClickHouse menggunakan SDK dalam berbagai bahasa pemrograman?
Bahasa pemrograman | Protokol HTTP | Protokol TCP |
Java | 8123 | 3306 |
Python | ||
Go |
SDK apa yang direkomendasikan untuk Go dan Python?
Untuk informasi lebih lanjut, lihat pustaka pengembangan pihak ketiga.
Bagaimana cara mengatasi error "connect timed out" saat menghubungkan ke kluster menggunakan client?
Anda dapat menggunakan salah satu solusi berikut:
Periksa koneksi jaringan. Anda dapat menjalankan perintah
pinguntuk memeriksa konektivitas jaringan. Anda juga dapat menjalankan perintahtelnetuntuk memeriksa apakah port database 3306 dan 8123 terbuka.Periksa apakah daftar putih telah dikonfigurasi untuk ClickHouse. Untuk informasi lebih lanjut, lihat Konfigurasikan daftar putih.
Periksa apakah alamat IP client benar. Alamat IP komputer dalam jaringan perusahaan sering berubah, sehingga alamat IP yang ditampilkan mungkin salah. Anda dapat menggunakan layanan pencarian alamat IP profesional untuk menentukan alamat IP asal. Untuk informasi lebih lanjut, lihat whatsmyip.
Mengapa saya tidak dapat menghubungkan ke tabel eksternal seperti MySQL, HDFS, dan Kafka?
Versi 20.3 dan 20.8 secara otomatis memverifikasi koneksi saat Anda membuat tabel eksternal. Jika tabel berhasil dibuat, berarti jaringan terhubung. Jika tabel tidak dapat dibuat, penyebab umumnya adalah sebagai berikut:
Titik akhir tujuan dan kluster ClickHouse tidak berada dalam VPC yang sama, sehingga menyebabkan pemutusan jaringan.
Titik akhir MySQL memiliki pengaturan daftar putih. Anda harus menambahkan alamat IP kluster ClickHouse ke daftar putih titik akhir MySQL.
Dalam kasus tabel eksternal Kafka, tabel mungkin berhasil dibuat, tetapi kueri pada tabel tersebut tidak mengembalikan hasil apa pun. Penyebab umumnya adalah data di Kafka tidak dapat diurai berdasarkan bidang dan format yang ditentukan dalam skema tabel. Pesan error akan menunjukkan lokasi spesifik kegagalan penguraian.
Mengapa program saya tidak dapat terhubung ke ClickHouse?
Penyebab umum dan solusinya adalah sebagai berikut:
Penyebab 1: Lingkungan VPC atau jaringan publik tidak dikonfigurasi dengan benar. Anda dapat menggunakan koneksi jaringan internal jika program dan kluster berada dalam VPC yang sama. Jika tidak berada dalam VPC yang sama, Anda harus mengaktifkan Titik akhir publik untuk terhubung.
Solusi: Untuk informasi lebih lanjut tentang cara mengajukan Titik akhir publik, lihat Ajukan dan lepas Titik akhir publik.
Penyebab 2: Daftar putih tidak dikonfigurasi untuk kluster.
Solusi: Untuk informasi lebih lanjut tentang cara mengonfigurasi daftar putih, lihat Konfigurasikan daftar putih.
Penyebab 3: Port yang diperlukan tidak terbuka di grup keamanan ECS.
Solusi: Untuk informasi lebih lanjut tentang cara mengonfigurasi grup keamanan, lihat Operasi grup keamanan.
Penyebab 4: Firewall jaringan perusahaan memblokir koneksi.
Solusi: Modifikasi aturan firewall.
Penyebab 5: Kata sandi dalam string koneksi mengandung karakter khusus, seperti
!@#$%^&*()_+=. Karakter khusus ini mungkin tidak dikenali selama koneksi dan dapat menyebabkan kegagalan koneksi.Solusi: Anda harus melakukan escape karakter khusus dalam string koneksi. Aturan escape-nya adalah sebagai berikut:
! : %21
@ : %40
# : %23
$ : %24
% : %25
^ : %5e
& : %26
* : %2a
( : %28
) : %29
_ : %5f
+ : %2b
= : %3d
Contoh: Jika kata sandinya adalah
ab@#c, Anda harus melakukan escape karakter khusus dalam string koneksi. Kata sandinya menjadiab%40%23c.Penyebab 6: Secara default, ApsaraDB for ClickHouse memasang instans SLB, yang merupakan layanan bayar sesuai penggunaan. Jika akun Anda memiliki pembayaran tertunda, instans ApsaraDB for ClickHouse Anda mungkin tidak dapat diakses.
Solusi: Periksa apakah Akun Alibaba Cloud Anda memiliki pembayaran tertunda. Jika iya, segera lunasi saldo yang tertunda.
Bagaimana cara menangani masalah timeout pada ClickHouse?
Kernel ApsaraDB for ClickHouse memiliki banyak parameter terkait timeout dan mendukung berbagai protokol interaksi. Misalnya, Anda dapat mengatur parameter untuk protokol HTTP dan TCP guna menangani masalah timeout.
Protokol HTTP
Protokol HTTP adalah metode paling umum untuk berinteraksi dengan ApsaraDB for ClickHouse di lingkungan produksi. Protokol ini digunakan di backend oleh alat-alat seperti driver JDBC resmi, Alibaba Cloud DMS, dan DataGrip. Nomor port umum untuk protokol HTTP adalah 8123.
Menangani masalah distributed_ddl_task_timeout
Waktu tunggu default untuk kueri DDL terdistribusi yang mencakup `ON CLUSTER` adalah 180 detik. Anda dapat menjalankan perintah berikut di DMS untuk mengatur parameter global. Diperlukan restart kluster agar pengaturan baru berlaku.
set global on cluster default distributed_ddl_task_timeout = 1800;DDL terdistribusi menggunakan ZooKeeper untuk membangun antrian tugas asinkron. Timeout selama eksekusi tidak berarti kueri gagal. Ini hanya menunjukkan bahwa permintaan yang dikirim sebelumnya masih dalam antrian. Anda tidak perlu mengirim ulang tugas tersebut.
Menangani masalah timeout max_execution_time
Timeout eksekusi default untuk kueri umum adalah 7.200 detik di platform DMS, dan 30 detik untuk driver JDBC dan DataGrip. Kueri akan dibatalkan secara otomatis setelah melewati batas timeout. Anda dapat mengubahnya pada tingkat kueri. Misalnya, Anda dapat menjalankan
select * from system.numbers settings max_execution_time = 3600. Anda juga dapat menjalankan perintah berikut di DMS untuk mengatur parameter global:set global on cluster default max_execution_time = 3600;
Menangani masalah socket_timeout
Waktu tunggu default bagi protokol HTTP untuk menerima respons dari socket adalah 7.200 detik di platform DMS, dan 30 detik untuk driver JDBC dan DataGrip. Parameter ini bukan parameter sistem ClickHouse, melainkan parameter JDBC untuk protokol HTTP. Namun, parameter ini memengaruhi parameter max_execution_time karena menentukan waktu maksimum yang ditunggu client untuk menerima respons. Oleh karena itu, saat Anda menyesuaikan parameter max_execution_time, sesuaikan juga parameter socket_timeout agar sedikit lebih tinggi dari max_execution_time. Untuk mengatur parameter ini, tambahkan properti socket_timeout ke string koneksi JDBC dan tentukan nilainya dalam milidetik. Contoh: `jdbc:clickhouse://127.0.0.1:8123/default?socket_timeout=3600000`.
Client hang saat terhubung langsung ke alamat IP server ClickHouse
Saat instans ECS di Alibaba Cloud terhubung lintas grup keamanan, mereka mungkin mengalami error koneksi diam-diam. Hal ini terjadi karena daftar putih grup keamanan instans ECS tempat client JDBC berada belum dibuka untuk server ClickHouse. Saat permintaan client menerima hasil kueri setelah waktu yang sangat lama, pesan yang dikembalikan mungkin tidak terkirim ke client karena tabel rute yang tidak dapat diakses. Pada titik ini, client hang.
Solusi untuk masalah ini sama dengan masalah pemutusan koneksi SLB. Mengaktifkan `send_progress_in_http_headers` dapat menyelesaikan sebagian besar masalah. Dalam kasus langka di mana mengaktifkan `send_progress_in_http_headers` tidak menyelesaikan masalah, Anda harus mengonfigurasi daftar putih grup keamanan instans ECS tempat client JDBC berada. Tambahkan alamat server ClickHouse ke daftar putih.
Protokol TCP
Protokol TCP paling umum digunakan untuk analisis interaktif dengan antarmuka baris perintah bawaan ClickHouse. Port umum untuk kluster Edisi Kompatibel-Komunitas adalah 3306. Karena protokol TCP menggunakan pesan keep-alive koneksi, protokol ini tidak mengalami masalah timeout tingkat socket. Anda hanya perlu memantau timeout untuk parameter distributed_ddl_task_timeout dan max_execution_time. Parameter-parameter ini diatur dengan cara yang sama seperti pada protokol HTTP.
Mengapa terjadi error memori atau crash out-of-memory (OOM) saat mengimpor data dalam format seperti ORC dan PARQUET dari tabel eksternal OSS?
Masalah ini umumnya disebabkan oleh penggunaan memori yang tinggi.
Anda dapat menggunakan salah satu solusi berikut:
Pisahkan file di OSS menjadi file-file yang lebih kecil sebelum mengimpornya.
Tingkatkan memori instans Anda. Untuk informasi lebih lanjut tentang cara meningkatkan memori, lihat Skalabilitas vertikal dan horizontal untuk kluster Edisi Kompatibel-Komunitas.
Bagaimana cara menangani error "too many parts" saat mengimpor data?
ClickHouse menghasilkan bagian data untuk setiap operasi penulisan. Jika Anda menulis data dalam jumlah kecil sekaligus, banyak bagian data akan dibuat. Hal ini memberikan beban berat pada operasi penggabungan dan kueri. Untuk mencegah terlalu banyak bagian data dibuat, ClickHouse memiliki batasan internal yang menyebabkan error "too many parts". Jika error ini terjadi, Anda dapat meningkatkan ukuran batch untuk operasi penulisan. Jika Anda tidak dapat menyesuaikan ukuran batch, Anda dapat memodifikasi parameter merge_tree.parts_to_throw_insert di konsol dan mengaturnya ke nilai yang lebih besar.
Mengapa impor data DataX lambat?
Penyebab umum dan solusinya adalah sebagai berikut:
Penyebab 1: Pengaturan parameter tidak tepat. ClickHouse cocok untuk operasi penulisan yang menggunakan batch besar dan proses konkuren sedikit. Dalam kebanyakan kasus, ukuran batch bisa mencapai puluhan ribu atau bahkan ratusan ribu. Ukuran batch tergantung pada ukuran baris Anda. Anda dapat memperkirakan ukuran baris sekitar 100 byte per baris, tetapi Anda perlu menghitungnya berdasarkan karakteristik data aktual Anda.
Solusi: Kami merekomendasikan jumlah proses konkuren tidak melebihi 10. Anda dapat mencoba menyesuaikan parameter yang berbeda.
Penyebab 2: Spesifikasi instans ECS dari grup sumber daya eksklusif untuk DataWorks rendah. Misalnya, jika CPU dan memori sumber daya eksklusif terlalu kecil, jumlah proses konkuren dan bandwidth keluar terbatas. Jika ukuran batch terlalu besar dan memori terlalu kecil, garbage collection (GC) Java mungkin dipicu dalam proses DataWorks.
Solusi: Periksa spesifikasi instans ECS di log output DataWorks.
Penyebab 3: Data dibaca secara lambat dari sumber data.
Solusi: Cari `totalWaitReaderTime` dan `totalWaitWriterTime` di log output DataWorks. Jika `totalWaitReaderTime` jauh lebih besar daripada `totalWaitWriterTime`, bottleneck berada di sisi pembacaan, bukan sisi penulisan.
Penyebab 4: Titik akhir publik digunakan. Bandwidth Titik akhir publik terbatas dan tidak dapat mendukung impor dan ekspor data berkinerja tinggi.
Solusi: Ganti Titik akhir publik dengan Titik akhir VPC.
Penyebab 5: Terdapat data kotor. Tanpa data kotor, data ditulis dalam batch. Namun, jika ditemukan data kotor, operasi penulisan batch saat ini gagal dan kembali ke penulisan baris demi baris. Hal ini menghasilkan banyak bagian data dan secara signifikan mengurangi kecepatan penulisan.
Anda dapat menggunakan salah satu metode berikut untuk memeriksa data kotor:
Periksa pesan error. Jika pesan yang dikembalikan berisi
Cannot parse, berarti terdapat data kotor.Kodenya adalah sebagai berikut:
SELECT written_rows, written_bytes, query_duration_ms, event_time, exception
FROM system.query_log
WHERE event_time BETWEEN '2021-11-22 22:00:00' AND '2021-11-22 23:00:00' AND lowerUTF8(query) LIKE '%insert into <table_name>%' and type != 'QueryStart' and exception_code != 0
ORDER BY event_time DESC LIMIT 30;
Periksa jumlah baris dalam batch. Jika jumlah barisnya 1, berarti terdapat data kotor.
Kodenya adalah sebagai berikut:
SELECT written_rows, written_bytes, query_duration_ms, event_time
FROM system.query_log
WHERE event_time BETWEEN '2021-11-22 22:00:00' AND '2021-11-22 23:00:00' AND lowerUTF8(query) LIKE '%insert into <table_name>%' and type != 'QueryStart'
ORDER BY event_time DESC LIMIT 30;
Solusi: Hapus atau modifikasi data kotor di sumber data.
Mengapa jumlah baris di ClickHouse tidak sesuai dengan jumlah baris di Hive setelah mengimpor data dari Hive?
Anda dapat menggunakan metode berikut untuk memecahkan masalah:
Periksa tabel sistem `query_log` untuk melihat apakah terjadi error selama impor. Jika terjadi error, kemungkinan terjadi kehilangan data.
Tentukan apakah mesin tabel mendukung deduplikasi. Misalnya, jika Anda menggunakan mesin ReplacingMergeTree, jumlah baris di ClickHouse mungkin lebih kecil daripada di Hive.
Konfirmasi ulang keakuratan jumlah baris di Hive. Jumlah baris sumber mungkin telah ditentukan secara salah.
Mengapa jumlah baris di ClickHouse tidak sesuai dengan jumlah baris di Kafka setelah mengimpor data dari Kafka?
Anda dapat menggunakan metode berikut untuk memecahkan masalah:
Periksa tabel sistem `query_log` untuk melihat apakah terjadi error selama impor. Jika terjadi error, kemungkinan terjadi kehilangan data.
Tentukan apakah mesin tabel mendukung deduplikasi. Misalnya, jika Anda menggunakan mesin ReplacingMergeTree, jumlah baris di ClickHouse mungkin lebih kecil daripada di Kafka.
Periksa apakah parameter `kafka_skip_broken_messages` dikonfigurasi untuk tabel eksternal Kafka. Jika parameter ini ada, pesan Kafka yang gagal diurai mungkin dilewati. Hal ini menyebabkan jumlah total baris di ClickHouse lebih kecil daripada di Kafka.
Bagaimana cara mengimpor data menggunakan Spark atau Flink?
Untuk informasi lebih lanjut tentang cara mengimpor data menggunakan Spark, lihat Impor data dari Spark.
Untuk informasi lebih lanjut tentang cara mengimpor data menggunakan Flink, lihat Impor data dari Flink SQL.
Bagaimana cara mengimpor data dari instans ClickHouse yang ada ke instans ApsaraDB for ClickHouse?
Anda dapat menggunakan salah satu solusi berikut:
Migrasikan data dengan mengekspor file menggunakan client ClickHouse. Untuk informasi lebih lanjut, lihat Migrasikan data dari instans ClickHouse yang dikelola sendiri ke instans ApsaraDB for ClickHouse Edisi Kompatibel-Komunitas.
Migrasikan data menggunakan fungsi `remote`.
INSERT INTO <destination_table> SELECT * FROM remote('<connection_string>', '<database>', '<table>', '<username>', '<password>');
Saat menyinkronkan data MySQL menggunakan engine MaterializeMySQL, mengapa saya menerima error berikut: The slave is connecting using CHANGE MASTER TO MASTER_AUTO_POSITION = 1, but the master has purged binary logs containing GTIDs that the slave requires?
Penyebab umum: Engine MaterializeMySQL berhenti menyinkronkan terlalu lama, sehingga log biner MySQL kedaluwarsa dan dihapus.
Solusi: Hapus database yang mengalami error, lalu buat ulang database yang disinkronkan di ApsaraDB for ClickHouse.
Saat menyinkronkan data MySQL menggunakan engine MaterializeMySQL, mengapa sinkronisasi tabel berhenti? Mengapa field sync_failed_tables pada tabel sistem system.materialize_mysql tidak kosong?
Penyebab umum: Pernyataan DDL MySQL yang tidak didukung oleh ApsaraDB for ClickHouse digunakan selama sinkronisasi.
Solusi: Sinkronkan ulang data MySQL. Untuk melakukannya, ikuti langkah-langkah berikut:
Hapus tabel yang berhenti menyinkronkan.
DROP TABLE <table_name> ON cluster default;Catatantable_nameadalah nama tabel yang berhenti menyinkronkan. Jika tabel memiliki tabel terdistribusi, Anda harus menghapus tabel lokal dan tabel terdistribusi.Mulai ulang proses sinkronisasi.
ALTER database <database_name> ON cluster default MODIFY SETTING skip_unsupported_tables = 1;Catatan<database_name>adalah database di ApsaraDB for ClickHouse yang sedang disinkronkan.
Bagaimana cara menangani error "Too many partitions for single INSERT block (more than 100)"?
Penyebab umum: Operasi INSERT tunggal melebihi batas `max_partitions_per_insert_block`. Nilai defaultnya adalah 100. ClickHouse menghasilkan bagian data untuk setiap operasi penulisan. Partisi dapat berisi satu atau beberapa bagian data. Jika operasi INSERT tunggal memasukkan data ke terlalu banyak partisi, banyak bagian data akan dibuat di ClickHouse. Hal ini memberikan beban berat pada operasi penggabungan dan kueri. Untuk mencegah terlalu banyak bagian data, ClickHouse memiliki batasan internal.
Solusi: Sesuaikan jumlah partisi atau parameter `max_partitions_per_insert_block`.
Sesuaikan skema tabel, modifikasi metode partisi, atau cegah jumlah partisi berbeda dalam satu insert melebihi batas.
Untuk mencegah jumlah partisi berbeda dalam satu insert melebihi batas, Anda dapat memodifikasi parameter `max_partitions_per_insert_block` berdasarkan volume data untuk meningkatkan batas. Sintaksnya adalah sebagai berikut:
Instans standalone
SET GLOBAL max_partitions_per_insert_block = XXX;Deployment multi-node
SET GLOBAL ON cluster DEFAULT max_partitions_per_insert_block = XXX;CatatanKomunitas ClickHouse merekomendasikan nilai default 100. Jangan mengatur jumlah partisi terlalu tinggi karena dapat memengaruhi kinerja. Setelah impor data massal, Anda dapat mengembalikan nilai ke default.
Bagaimana cara menangani error kehabisan memori saat menjalankan pernyataan INSERT INTO SELECT?
Penyebab umum dan solusinya adalah sebagai berikut:
Penyebab 1: Penggunaan memori tinggi.
Solusi: Sesuaikan parameter `max_insert_threads` untuk mengurangi potensi penggunaan memori.
Penyebab 2: Anda menggunakan pernyataan
INSERT INTO SELECTuntuk mengimpor data dari satu kluster ClickHouse ke kluster lain.Solusi: Migrasikan data dengan mengimpor file. Untuk informasi lebih lanjut, lihat Migrasikan data dari instans ClickHouse yang dikelola sendiri ke instans ApsaraDB for ClickHouse Edisi Kompatibel-Komunitas.
Bagaimana cara mengkueri penggunaan CPU dan memori?
Anda dapat melihat log penggunaan CPU dan memori untuk kueri di tabel sistem `system.query_log`. Tabel ini berisi statistik penggunaan CPU dan memori untuk setiap kueri. Untuk informasi lebih lanjut, lihat system.query_log.
Bagaimana cara menangani error kehabisan memori selama kueri?
Server ClickHouse memiliki pelacak memori untuk setiap thread kueri. Pelacak untuk semua thread dalam kueri yang sama melapor ke `pelacak memori untuk kueri`. Di atasnya terdapat `pelacak memori untuk total`. Anda dapat menggunakan salah satu solusi berikut berdasarkan situasi Anda:
Jika Anda mengalami error
Memory limit (for query), berarti kueri menggunakan terlalu banyak memori (70% dari total memori instans) dan gagal. Dalam hal ini, Anda dapat melakukan peningkatan vertikal untuk meningkatkan memori instans.Jika Anda mengalami error
Memory limit (for total), berarti total penggunaan memori instans telah melebihi batas (90% dari total memori instans). Dalam hal ini, Anda dapat mencoba mengurangi konkurensi kueri. Jika masalah tetap ada, tugas asinkron latar belakang mungkin menggunakan banyak memori. Hal ini sering terjadi pada tugas penggabungan primary key setelah penulisan. Anda perlu melakukan peningkatan vertikal untuk meningkatkan memori instans.
Mengapa saya menerima error batas memori saat menjalankan pernyataan SQL pada kluster Edisi Perusahaan?
Penyebab: Di kluster ApsaraDB for ClickHouse Edisi Perusahaan, jumlah total ClickHouse Compute Unit (CCU) adalah jumlah CCU dari semua node. Satu node memiliki 32 core dan memori 128 GB (32 CCU), dengan batas memori 128 GB. Ini termasuk memori untuk sistem operasi, sehingga tersisa sekitar 115 GB memori yang tersedia. Secara default, satu pernyataan SQL dijalankan pada satu node. Oleh karena itu, jika satu pernyataan SQL mengonsumsi lebih dari 115 GB memori, error memory limit mungkin terjadi.
Jumlah node dalam kluster hanya ditentukan oleh batas atas CCU kluster. Saat batas atas CCU lebih besar dari 64, rumus untuk menghitung jumlah node dalam kluster Edisi Perusahaan adalah: batas atas CCU / 32. Saat batas atas CCU kurang dari 64, jumlah node dalam kluster Edisi Perusahaan adalah 2.
Solusi: Atur parameter berikut setelah pernyataan SQL untuk menjalankan kueri secara paralel di beberapa node. Hal ini dapat mengurangi beban dan mencegah error batas memori.
SETTINGS
    allow_experimental_analyzer = 1,
    allow_experimental_parallel_reading_from_replicas = 1;
Bagaimana cara menangani error SQL yang disebabkan oleh penggunaan memori berlebih saat menjalankan operasi GROUP BY pada set hasil yang besar?
Anda dapat mengatur parameter max_bytes_before_external_group_by untuk membatasi konsumsi memori operasi GROUP BY. Perhatikan bahwa parameter allow_experimental_analyzer memengaruhi apakah pengaturan ini berlaku.
Bagaimana cara menangani error batas konkurensi selama kueri?
Konkurensi kueri maksimum default untuk server adalah 100. Anda dapat memodifikasinya di konsol. Untuk memodifikasi nilai parameter yang sedang berjalan, ikuti langkah-langkah berikut:
Login ke konsol ApsaraDB for ClickHouse.
Pada halaman Cluster List, pilih List of Community Edition Instances, lalu klik ID kluster target.
Di panel navigasi sebelah kiri, klik Parameter Configuration.
Pada halaman Konfigurasi Parameter, klik tombol edit di sebelah Operating parameter value untuk parameter max_concurrent_queries.
Masukkan nilai target di kotak pop-up dan klik Confirm.
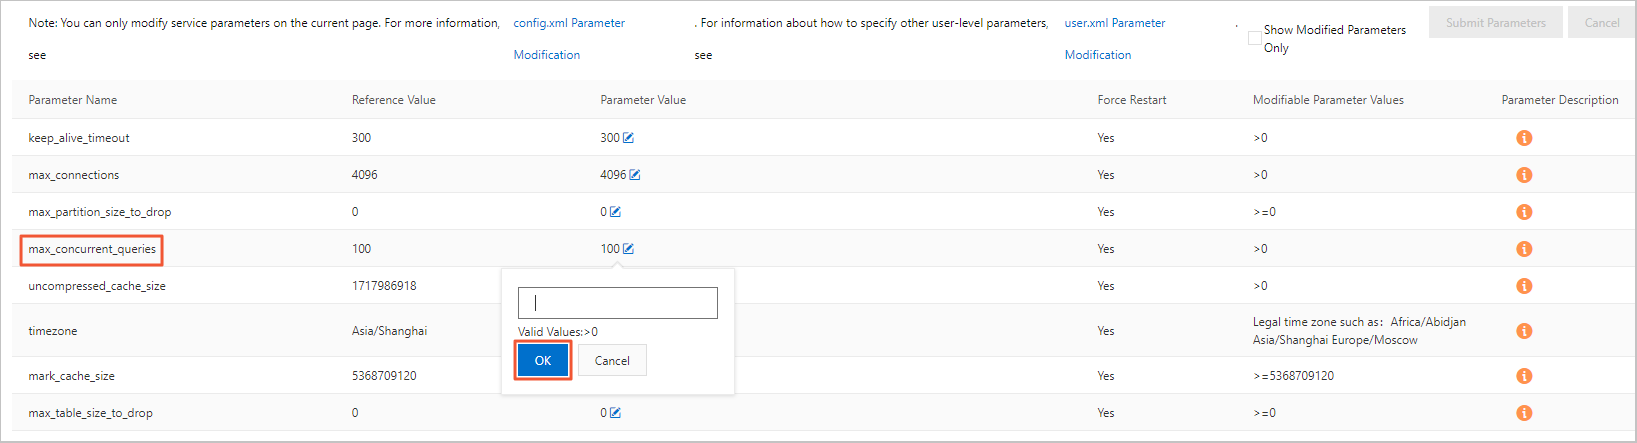
Klik Submit parameters.
Klik Submit parameters.
Bagaimana cara menangani hasil yang tidak konsisten untuk pernyataan kueri yang sama ketika penulisan data dihentikan?
Deskripsi masalah: Saat Anda mengkueri data menggunakan select count(*), hasilnya hanya sekitar separuh dari total data, atau volume data terus berfluktuasi.
Anda dapat menggunakan salah satu solusi berikut:
Periksa apakah ini kluster multi-node. Untuk kluster multi-node, Anda harus membuat tabel terdistribusi, menulis data ke dalamnya, dan mengkuerinya untuk mendapatkan hasil yang konsisten. Jika tidak, setiap kueri mengakses data dari shard yang berbeda, sehingga menghasilkan hasil yang tidak konsisten. Untuk informasi lebih lanjut tentang cara membuat tabel terdistribusi, lihat Buat tabel terdistribusi.
Periksa apakah ini kluster master-replica. Kluster master-replica memerlukan tabel dengan mesin tabel seri Replicated untuk menyinkronkan data antar replika. Jika tidak, setiap kueri mengakses replika yang berbeda, sehingga menghasilkan hasil yang tidak konsisten. Untuk informasi lebih lanjut tentang cara membuat tabel dengan mesin tabel seri Replicated, lihat Mesin tabel.
Mengapa saya kadang tidak dapat melihat tabel yang dibuat dan hasil kueri berfluktuasi?
Penyebab umum dan solusinya adalah sebagai berikut:
Penyebab 1: Masalah dalam proses pembuatan tabel. Kluster ClickHouse terdistribusi tidak memiliki semantik DDL terdistribusi native. Jika Anda menggunakan
create tableuntuk membuat tabel di kluster ClickHouse yang dikelola sendiri, kueri mungkin mengembalikan pesan sukses, tetapi tabel hanya dibuat di server tempat Anda saat ini terhubung. Jika Anda terhubung kembali ke server yang berbeda, Anda tidak akan melihat tabel ini.Solusi:
Saat membuat tabel, gunakan pernyataan
create table <table_name> on cluster default. Deklarasion cluster defaultmenyiarkan pernyataan ini ke semua node di kluster default untuk dieksekusi. Kode berikut memberikan contoh:CREATE TABLE test ON cluster default (a UInt64) Engine = MergeTree() ORDER BY tuple();Buat mesin tabel terdistribusi pada tabel `test`. Pernyataan pembuatan tabel adalah sebagai berikut:
CREATE TABLE test_dis ON cluster default AS test Engine = Distributed(default, default, test, cityHash64(a));
Penyebab 2: Masalah konfigurasi tabel penyimpanan ReplicatedMergeTree. Mesin tabel ReplicatedMergeTree adalah versi yang ditingkatkan dari mesin tabel MergeTree dengan sinkronisasi master-replica. Instans single-replica hanya dapat membuat tabel MergeTree. Instans master-replica hanya dapat membuat tabel ReplicatedMergeTree.
Solusi: Saat membuat tabel pada instans master-replica, gunakan
ReplicatedMergeTree('/clickhouse/tables/{database}/{table}/{shard}', '{replica}')atauReplicatedMergeTree()untuk mengonfigurasi mesin tabel ReplicatedMergeTree. KonfigurasiReplicatedMergeTree('/clickhouse/tables/{database}/{table}/{shard}', '{replica}')bersifat tetap dan tidak perlu dimodifikasi.
Bagaimana cara menangani masalah di mana hasil kueri data timestamp berbeda dari data yang sebenarnya ditulis ke tabel?
Anda dapat menjalankan pernyataan SELECT timezone() untuk memeriksa apakah zona waktu diatur ke zona waktu lokal Anda. Jika tidak, modifikasi nilai item konfigurasi `timezone` ke zona waktu lokal Anda. Untuk informasi lebih lanjut tentang cara memodifikasi nilai, lihat Modifikasi nilai parameter yang berjalan dari item konfigurasi.
Bagaimana cara menangani masalah di mana tabel tidak ada setelah dibuat?
Penyebab umum: Pernyataan DDL hanya dijalankan pada satu node.
Solusi: Periksa apakah pernyataan DDL mencakup kata kunci on cluster. Untuk informasi lebih lanjut, lihat Sintaks CREATE TABLE.
Mengapa data tidak bertambah setelah tabel eksternal Kafka dibuat?
Anda dapat menjalankan kueri select * from pada tabel eksternal Kafka. Jika kueri mengembalikan error, Anda dapat menentukan penyebab berdasarkan pesan error. Penyebabnya biasanya kegagalan penguraian data. Jika kueri mengembalikan hasil, periksa apakah bidang tabel tujuan (tabel penyimpanan untuk tabel eksternal Kafka) dan tabel sumber Kafka (tabel eksternal Kafka) sesuai. Jika penulisan data gagal, bidangnya tidak sesuai. Berikut adalah contoh pernyataan:
insert into <destination_table> as select * from <kafka_external_table>;Mengapa waktu yang ditampilkan pada client berbeda dari waktu di zona waktu yang ditentukan?
Client telah mengatur use_client_time_zone ke zona waktu yang salah.
Mengapa data tidak terlihat setelah ditulis?
Deskripsi masalah: Mengapa saya tidak dapat mengkueri data setelah ditulis?
Penyebab: Penyebab umumnya adalah sebagai berikut:
Skema tabel dari tabel terdistribusi dan tabel lokal tidak konsisten.
Setelah data ditulis ke tabel terdistribusi, file sementara tidak didistribusikan.
Setelah data ditulis ke salah satu replika dalam pengaturan master-replica, sinkronisasi replika belum lengkap.
Analisis penyebab dan solusi:
Skema tabel tidak konsisten antara tabel terdistribusi dan tabel lokal
Anda dapat mengkueri tabel sistem system.distribution_queue untuk memeriksa apakah terjadi error saat data ditulis ke tabel terdistribusi.
File sementara tidak didistribusikan setelah data ditulis ke tabel terdistribusi
Analisis penyebab: Di kluster ApsaraDB for ClickHouse multi-node, jika layanan Anda terhubung ke database menggunakan nama domain dan menjalankan pernyataan INSERT pada tabel terdistribusi, permintaan INSERT diteruskan oleh instans SLB frontend dan diarahkan ke node acak di kluster. Setelah node menerima permintaan INSERT, sebagian data ditulis langsung ke disk lokalnya. Data yang tersisa ditempatkan di node sebagai file sementara dan kemudian didistribusikan secara asinkron ke node lain di kluster. Jika proses distribusi ini belum lengkap, kueri berikutnya mungkin gagal mengambil data yang belum didistribusikan.
Solusi: Jika bisnis Anda memerlukan akurasi tinggi untuk hasil kueri segera setelah operasi INSERT, Anda dapat menambahkan settings insert_distributed_sync = 1 ke pernyataan INSERT. Setelah mengonfigurasi parameter ini, operasi INSERT pada tabel terdistribusi menjadi sinkron. Pernyataan INSERT mengembalikan pesan sukses hanya setelah semua node menyelesaikan distribusi. Untuk informasi lebih lanjut tentang cara mengonfigurasi parameter ini, lihat konten berikut:
Setelah mengatur parameter ini, waktu eksekusi pernyataan INSERT mungkin meningkat karena harus menunggu distribusi data selesai. Pertimbangkan persyaratan kinerja penulisan bisnis Anda sebelum mengatur parameter ini.
Parameter ini berlaku pada tingkat kluster dan harus dipertimbangkan dengan hati-hati. Kami merekomendasikan Anda menguji dengan menambahkan parameter ini ke kueri individual. Setelah memverifikasi kebenarannya, putuskan apakah akan menerapkannya pada tingkat kluster sesuai kebutuhan.
Untuk membuat pengaturan berlaku untuk satu kueri, Anda dapat menambahkannya setelah kueri. Berikut adalah contohnya:
INSERT INTO <table_name> values() settings insert_distributed_sync = 1;Untuk membuat pengaturan berlaku pada tingkat kluster, Anda dapat mengaturnya di file `user.xml`. Untuk informasi lebih lanjut, lihat Konfigurasikan parameter user.xml.
Sinkronisasi replika belum lengkap setelah data ditulis ke salah satu replika
Analisis penyebab: Di kluster ApsaraDB for ClickHouse master-replica, saat pernyataan INSERT dijalankan, hanya salah satu dari dua replika, yang dipilih secara acak, yang menjalankan pernyataan tersebut. Replika lainnya menyinkronkan data secara asinkron. Oleh karena itu, setelah pernyataan INSERT dijalankan, jika kueri SELECT ditangani oleh replika yang belum menyelesaikan sinkronisasi data, kueri mungkin tidak menemukan data yang diharapkan.
Solusi: Jika bisnis Anda memerlukan akurasi tinggi untuk hasil kueri segera setelah operasi INSERT, Anda dapat menambahkan settings insert_quorum = 2 ke pernyataan penulisan. Setelah parameter ini dikonfigurasi, sinkronisasi data antar replika menjadi sinkron. Pernyataan INSERT mengembalikan pesan sukses hanya setelah sinkronisasi selesai di semua replika.
Perhatikan hal berikut saat mengatur parameter ini:
Setelah mengatur parameter ini, waktu eksekusi pernyataan INSERT mungkin meningkat karena harus menunggu sinkronisasi data antar replika selesai. Pertimbangkan persyaratan kinerja penulisan bisnis Anda sebelum mengatur parameter ini.
Setelah mengatur parameter ini, pernyataan INSERT hanya dapat berhasil setelah data disinkronkan antar replika. Artinya, jika replika tidak tersedia, semua penulisan yang dikonfigurasi dengan `insert_quorum = 2` akan gagal. Hal ini bertentangan dengan jaminan keandalan kluster master-replica.
Parameter ini berlaku pada tingkat kluster dan harus dipertimbangkan dengan hati-hati. Kami merekomendasikan Anda menguji dengan menambahkan parameter ini ke kueri individual. Setelah memverifikasi kebenarannya, putuskan apakah akan menerapkannya pada tingkat kluster sesuai kebutuhan.
Untuk membuat pengaturan berlaku untuk satu kueri, Anda dapat menambahkannya setelah kueri. Berikut adalah contohnya:
INSERT INTO <table_name> values() settings insert_quorum = 2;Untuk membuat pengaturan berlaku pada tingkat kluster, Anda dapat mengaturnya di file `user.xml`. Untuk informasi lebih lanjut, lihat Konfigurasikan parameter user.xml.
Mengapa data kedaluwarsa tidak dihapus setelah TTL diatur di ClickHouse?
Deskripsi masalah
Time to Live (TTL) dikonfigurasi dengan benar untuk tabel, tetapi data kedaluwarsa di tabel tidak dihapus secara otomatis. Hal ini menunjukkan bahwa TTL tidak berlaku.
Pemecahan masalah
Periksa apakah pengaturan TTL untuk tabel masuk akal.
Atur TTL berdasarkan kebutuhan bisnis Anda. Kami merekomendasikan Anda mengatur TTL pada tingkat hari. Hindari mengatur TTL pada tingkat detik atau menit, seperti
TTL event_time + INTERVAL 30 SECOND.Periksa parameter
materialize_ttl_after_modify.Parameter ini mengontrol apakah aturan TTL baru diterapkan pada data historis setelah Anda menjalankan pernyataan
ALTER MODIFY TTL. Nilai defaultnya adalah 1, yang berarti aturan diterapkan. Nilai 0 berarti aturan hanya berlaku untuk data baru. Data historis tidak terpengaruh oleh batas TTL.Lihat pengaturan parameter.
SELECT * FROM system.settings WHERE name like 'materialize_ttl_after_modify';Modifikasi pengaturan parameter.
PentingPerintah ini memindai semua data historis, yang dapat mengonsumsi sumber daya signifikan. Gunakan dengan hati-hati.
ALTER TABLE $table_name MATERIALIZE TTL;
Periksa kebijakan pembersihan partisi.
Jika parameter
ttl_only_drop_partsdiatur ke1, partisi data hanya dihapus ketika semua data dalam partisi kedaluwarsa.Lihat pengaturan parameter
ttl_only_drop_parts.SELECT * FROM system.merge_tree_settings WHERE name LIKE 'ttl_only_drop';Lihat status kedaluwarsa partisi.
SELECT partition, name, active, bytes_on_disk, modification_time, min_time, max_time, delete_ttl_info_min, delete_ttl_info_max FROM system.parts c WHERE database = 'your_dbname' AND TABLE = 'your_tablename' LIMIT 100;delete_ttl_info_min: Nilai kunci tanggal dan waktu minimum dalam bagian yang digunakan untuk aturan TTL DELETE.
delete_ttl_info_max: Nilai kunci tanggal dan waktu maksimum dalam bagian yang digunakan untuk aturan TTL DELETE.
Jika aturan partisi tidak sesuai dengan aturan TTL, beberapa data mungkin tidak dibersihkan dalam waktu lama. Berikut ini menjelaskan bagaimana aturan partisi dan aturan TTL sesuai:
Jika aturan partisi sesuai dengan aturan TTL (misalnya, data dipartisi berdasarkan hari dan aturan TTL juga menghapus data berdasarkan hari), sistem dapat mengevaluasi TTL berdasarkan `partition_id` dan menghapus satu partisi sekaligus. Kebijakan ini memiliki biaya terendah. Kami merekomendasikan Anda menggabungkan partisi (seperti partisi harian) dengan pengaturan
ttl_only_drop_parts=1untuk menghapus data kedaluwarsa secara efisien dan meningkatkan kinerja.Jika aturan partisi tidak sesuai dengan aturan TTL dan
ttl_only_drop_parts = 1, pencocokan dilakukan berdasarkan `ttl_info` dari setiap bagian. Operasi TTL hanya dilakukan ketika seluruh bagian melebihi waktu `delete_ttl_info_max`.Jika aturan partisi tidak sesuai dengan aturan TTL dan
ttl_only_drop_parts = 0, sistem harus memindai data di setiap bagian untuk menemukan dan menghapus data yang perlu dihapus. Kebijakan ini memiliki biaya tertinggi.
Kontrol frekuensi pemicu penggabungan.
Data kedaluwarsa dihapus secara asinkron selama proses penggabungan data, bukan secara real time. Anda dapat menggunakan parameter
merge_with_ttl_timeoutuntuk mengontrol frekuensi penggabungan, atau menggunakan perintahALTER TABLE ... MATERIALIZE TTLuntuk memaksa penerapan TTL.Lihat parameter.
SELECT * FROM system.merge_tree_settings WHERE name = 'merge_with_ttl_timeout';CatatanUnitnya adalah detik. Nilai default untuk instans online adalah 7200 detik (2 jam).
Modifikasi parameter.
Jika
merge_with_ttl_timeoutdiatur terlalu tinggi, frekuensi penggabungan TTL berkurang, yang menyebabkan data kedaluwarsa tetap tidak dibersihkan dalam waktu lama. Anda dapat menurunkan parameter ini untuk meningkatkan frekuensi pembersihan. Untuk informasi lebih lanjut, lihat Deskripsi Parameter.
Periksa pengaturan parameter kolam thread.
Kedaluwarsa data berdasarkan TTL terjadi selama fase penggabungan bagian. Proses ini dibatasi oleh parameter
max_number_of_merges_with_ttl_in_pooldanbackground_pool_size. Nilai default untuk instans online masing-masing adalah 2 dan 16.Kueri aktivitas thread latar belakang saat ini.
SELECT * FROM system.metrics WHERE metric LIKE 'Background%';`BackgroundPoolTask` mewakili nilai pemantauan real-time dari metrik `background_pool_size`.
Modifikasi parameter.
Jika pengaturan parameter lain Anda normal dan CPU relatif menganggur, Anda dapat terlebih dahulu meningkatkan parameter
max_number_of_merges_with_ttl_in_pool, misalnya dari 2 menjadi 4, atau dari 4 menjadi 8. Jika penyesuaian ini tidak berpengaruh, Anda dapat meningkatkan parameterbackground_pool_size.PentingMenyesuaikan parameter
max_number_of_merges_with_ttl_in_poolmemerlukan restart kluster. Meningkatkan parameterbackground_pool_sizetidak memerlukan restart kluster, tetapi menurunkan parameterbackground_pool_sizememerlukannya.
Periksa apakah skema tabel dan desain partisi masuk akal.
Jika tabel tidak dipartisi dengan benar atau granularitas partisi terlalu besar, efisiensi pembersihan TTL berkurang. Untuk membersihkan data kedaluwarsa secara efisien, kami merekomendasikan Anda mencocokkan granularitas partisi dengan granularitas TTL (misalnya, keduanya berdasarkan hari). Untuk informasi lebih lanjut, lihat Praktik terbaik.
Periksa apakah kluster memiliki ruang disk yang cukup.
TTL dipicu di latar belakang bersamaan dengan operasi penggabungan, yang memerlukan ruang disk tertentu. Jika bagian besar ada atau ruang disk tidak mencukupi (penggunaan melebihi 90%), TTL mungkin gagal dijalankan.
Periksa pengaturan parameter sistem lainnya di
system.merge_tree_settings.merge_with_recompression_ttl_timeout: Penundaan minimum sebelum penggabungan ulang dengan TTL rekompresi. Untuk instans online, ini diatur ke 4 jam secara default. Secara default, aturan TTL diterapkan ke tabel setidaknya sekali setiap 4 jam. Untuk menerapkan aturan TTL lebih sering, Anda dapat memodifikasi pengaturan ini.max_number_of_merges_with_ttl_in_pool: Parameter yang mengontrol jumlah maksimum thread yang dapat digunakan untuk tugas TTL. Saat jumlah tugas penggabungan dengan TTL yang sedang berjalan di kolam thread latar belakang melebihi nilai parameter ini, tugas penggabungan baru dengan TTL tidak dialokasikan.
Mengapa tugas OPTIMIZE lambat?
Tugas OPTIMIZE mengonsumsi banyak CPU dan throughput disk. Kueri dan tugas OPTIMIZE saling memengaruhi. Saat beban node tinggi, tugas OPTIMIZE tampak lambat. Saat ini, tidak ada metode optimasi khusus.
Mengapa data tidak digabung berdasarkan primary key setelah tugas OPTIMIZE dijalankan?
Untuk memastikan data digabung dengan benar berdasarkan primary key, dua prasyarat berikut harus dipenuhi:
Bidang `PARTITION BY` yang ditentukan dalam tabel penyimpanan harus disertakan dalam klausa
ORDER BY. Data dari partisi yang berbeda tidak digabung berdasarkan primary key.Bidang algoritma hash yang ditentukan dalam tabel terdistribusi harus disertakan dalam klausa
ORDER BY. Data dari node yang berbeda tidak digabung berdasarkan primary key.
Perintah OPTIMIZE umum dan deskripsinya adalah sebagai berikut:
Perintah | Deskripsi |
| Mencoba memilih bagian data MergeTree untuk digabung. Mungkin mengembalikan tanpa menjalankan tugas apa pun. Bahkan jika dijalankan, tidak menjamin bahwa semua catatan dalam tabel digabung berdasarkan primary key. Perintah ini umumnya tidak digunakan. |
| Menentukan partisi dan memilih semua bagian data dalam partisi untuk digabung. Mungkin mengembalikan tanpa menjalankan tugas apa pun. Setelah tugas dijalankan, semua data dalam partisi digabung menjadi satu bagian data, dan penggabungan primary key selesai dalam partisi tersebut. Namun, data yang ditulis selama tugas tidak berpartisipasi dalam penggabungan. Jika hanya ada satu bagian data dalam partisi, tugas tidak dijalankan lagi. Catatan Untuk tabel tanpa kunci partisi, partisi default adalah `partition tuple()`. |
| Memaksa penggabungan untuk semua partisi di seluruh tabel. Bahkan jika partisi hanya memiliki satu bagian data, partisi tersebut digabung ulang. Hal ini dapat digunakan untuk memaksa menghapus catatan yang kedaluwarsa karena TTL. Tugas ini memiliki biaya eksekusi tertinggi, tetapi mungkin juga mengembalikan tanpa menjalankan tugas penggabungan apa pun. |
Untuk ketiga perintah tersebut, Anda dapat mengatur parameter optimize_throw_if_noop untuk mendeteksi apakah tugas dijalankan menggunakan pelaporan exception.
Mengapa TTL data tidak berlaku setelah tugas OPTIMIZE dijalankan?
Penyebab umum dan solusinya adalah sebagai berikut:
Penyebab 1: Kedaluwarsa data TTL ditangani selama fase penggabungan primary key. Jika bagian data tidak digabung berdasarkan primary key dalam waktu lama, data kedaluwarsa tidak dapat dihapus.
Solusi:
Picu tugas penggabungan secara manual menggunakan
OPTIMIZE FINALatauOPTIMIZE PARTITION.Atur parameter seperti `merge_with_ttl_timeout` dan `ttl_only_drop_parts` saat membuat tabel untuk meningkatkan frekuensi penggabungan bagian data yang berisi data kedaluwarsa.
Penyebab 2: TTL tabel telah dimodifikasi atau ditambahkan, dan bagian data yang ada tidak memiliki informasi TTL atau memiliki informasi yang salah. Hal ini juga dapat mencegah penghapusan data kedaluwarsa.
Solusi:
Buat ulang informasi TTL menggunakan perintah
ALTER TABLE ... MATERIALIZE TTL.Perbarui informasi TTL menggunakan
OPTIMIZE PARTITION.
Mengapa operasi update dan delete tidak berlaku setelah tugas OPTIMIZE dijalankan?
Update dan delete di ApsaraDB for ClickHouse dijalankan secara asinkron. Saat ini, tidak ada mekanisme untuk mengintervensi progresnya. Anda dapat melihat progres di tabel sistem `system.mutations`.
Bagaimana cara menjalankan pernyataan DDL untuk menambah, menghapus, atau memodifikasi kolom?
Modifikasi pada tabel lokal dapat dijalankan langsung. Untuk memodifikasi tabel terdistribusi, prosedurnya bervariasi tergantung situasi:
Jika tidak ada data yang ditulis, Anda dapat memodifikasi tabel lokal terlebih dahulu, lalu memodifikasi tabel terdistribusi.
Jika data sedang ditulis, Anda harus menangani berbagai jenis operasi secara berbeda:
Jenis
Prosedur
Tambahkan kolom `Nullable`
Modifikasi tabel lokal.
Modifikasi tabel terdistribusi.
Modifikasi tipe data kolom (jika tipe dapat dikonversi)
Hapus kolom `Nullable`
Modifikasi tabel terdistribusi.
Modifikasi tabel lokal.
Tambahkan kolom non-`Nullable`
Hentikan penulisan data.
Jalankan `SYSTEM FLUSH DISTRIBUTED` pada tabel terdistribusi.
Modifikasi tabel lokal.
Modifikasi tabel terdistribusi.
Lanjutkan penulisan data.
Hapus kolom non-`Nullable`
Modifikasi nama kolom
Mengapa pernyataan DDL dieksekusi secara lambat dan sering macet?
Penyebab umum: Pernyataan DDL global dijalankan secara berurutan. Kueri kompleks dapat menyebabkan deadlock.
Anda dapat menggunakan salah satu solusi berikut:
Tunggu hingga operasi selesai.
Coba hentikan kueri di konsol.
Bagaimana cara menangani error "longer than distributed_ddl_task_timeout (=xxx) seconds" untuk pernyataan DDL terdistribusi?
Anda dapat menggunakan perintah set global on cluster default distributed_ddl_task_timeout=xxx untuk memodifikasi timeout default. `xxx` adalah timeout kustom dalam detik. Untuk informasi lebih lanjut tentang cara memodifikasi parameter global, lihat Modifikasi parameter kluster.
Bagaimana cara menangani error sintaksis "set global on cluster default"?
Penyebab umum dan solusinya adalah sebagai berikut:
Penyebab 1: Client ClickHouse mengurai sintaksis, dan
set global on cluster defaultadalah sintaksis yang ditambahkan oleh server. Jika client belum diperbarui ke versi yang selaras dengan server, sintaksis ini diblokir oleh client.Solusi:
Gunakan alat yang tidak mengurai sintaksis di sisi client, seperti driver JDBC, DataGrip, atau DBeaver.
Tulis program JDBC untuk menjalankan pernyataan tersebut.
Penyebab 2: Dalam
set global on cluster default key = value;, `value` adalah string, tetapi tanda kutipnya hilang.Solusi: Tambahkan tanda kutip di kedua sisi nilai bertipe string.
Alat BI apa yang direkomendasikan?
Quick BI.
Alat IDE kueri data apa yang direkomendasikan?
DataGrip dan DBeaver.
Apakah ApsaraDB for ClickHouse mendukung pencarian vektor?
ApsaraDB for ClickHouse mendukung pencarian vektor. Untuk informasi lebih lanjut, lihat topik berikut:
Apa yang harus dilakukan jika error ON CLUSTER is not allowed for Replicated database muncul saat membuat tabel?
Jika kluster Anda adalah kluster Edisi Perusahaan dan pernyataan pembuatan tabel Anda mencakup ON CLUSTER default, Anda mungkin menerima error ON CLUSTER is not allowed for Replicated database. Anda dapat meningkatkan instans Anda ke versi terbaru. Beberapa versi minor memiliki bug ini. Untuk informasi lebih lanjut tentang cara meningkatkan versi, lihat Tingkatkan versi mesin minor.
Apa yang harus dilakukan jika error Double-distributed IN/JOIN subqueries is denied (distributed_product_mode = 'deny') muncul saat menggunakan subkueri (JOIN atau IN) dengan tabel terdistribusi?
Deskripsi masalah: Jika Anda memiliki kluster Edisi Kompatibel-Komunitas multi-node, Anda mungkin menerima error Exception: Double-distributed IN/JOIN subqueries is denied (distributed_product_mode = 'deny'). saat menggunakan subkueri JOIN atau IN pada beberapa tabel terdistribusi.
Analisis penyebab: Saat Anda menggunakan subkueri JOIN atau IN pada beberapa tabel terdistribusi, kueri diperbesar. Misalnya, dengan tiga node, subkueri tabel terdistribusi JOIN atau IN diperluas menjadi 3 × 3 subkueri tabel lokal. Hal ini menyebabkan pemborosan sumber daya dan peningkatan latensi. Oleh karena itu, sistem tidak mengizinkan kueri semacam ini secara default.
Prinsip solusi: Ganti IN atau JOIN dengan GLOBAL IN atau GLOBAL JOIN. Hal ini memungkinkan subkueri di sisi kanan GLOBAL IN atau GLOBAL JOIN diselesaikan pada satu node dan disimpan dalam tabel sementara. Tabel sementara tersebut kemudian dikirim ke node lain untuk kueri tingkat lebih tinggi.
Dampak mengganti IN atau JOIN dengan GLOBAL IN atau GLOBAL JOIN:
Tabel sementara dikirim ke semua server jarak jauh. Hindari menggunakan dataset besar.
Saat Anda menggunakan fungsi `remote` untuk mengkueri data dari instans eksternal, mengganti IN atau JOIN dengan GLOBAL IN atau GLOBAL JOIN menyebabkan subkueri yang seharusnya dijalankan pada instans eksternal dijalankan pada instans lokal. Hal ini dapat menyebabkan hasil kueri salah.
Misalnya, Anda dapat menjalankan pernyataan berikut pada instans `a` untuk mengkueri data dari instans eksternal
cc-bp1wc089c****menggunakan fungsi `remote`.SELECT * FROM remote('cc-bp1wc089c****.clickhouse.ads.aliyuncs.com:3306', `default`, test_tbl_distributed1, '<your_Account>', '<YOUR_PASSWORD>') WHERE id GLOBAL IN (SELECT id FROM test_tbl_distributed1);Berdasarkan prinsip solusi, instans `a` menjalankan subkueri di sebelah kanan GLOBAL IN,
SELECT id FROM test_tbl_distributed1, untuk menghasilkan tabel sementara A. Kemudian, data tabel sementara tersebut diteruskan ke instanscc-bp1wc089c****untuk kueri induk. Akhirnya, pernyataan yang dijalankan oleh instanscc-bp1wc089c****adalahSELECT * FROM default.test_tbl_distributed1 WHERE id IN (temporary_table_A);Ini adalah prinsip eksekusi GLOBAL IN atau GLOBAL JOIN. Melanjutkan contoh tersebut, mari kita pahami mengapa mengganti IN atau JOIN dengan GLOBAL IN atau GLOBAL JOIN dapat menyebabkan hasil salah saat Anda menggunakan fungsi `remote` untuk mengkueri data dari instans eksternal.
Seperti dijelaskan, pernyataan yang akhirnya dijalankan oleh instans
cc-bp1wc089c****adalahSELECT * FROM default.test_tbl_distributed1 WHERE id IN (temporary_table_A);. Namun, kondisi yang ditetapkan, tabel sementara A, dihasilkan pada instans `a`. Dalam contoh ini, instanscc-bp1wc089c****seharusnya menjalankanSELECT * FROM default.test_tbl_distributed1 WHERE id IN (SELECT id FROM test_tbl_distributed1 );. Kondisi yang ditetapkan seharusnya berasal dari instanscc-bp1wc089c****. Oleh karena itu, menggunakan GLOBAL IN atau GLOBAL JOIN menyebabkan subkueri mengambil kondisinya dari sumber yang salah, yang mengarah pada hasil yang salah.
Solusi:
Solusi 1: Modifikasi SQL dalam kode bisnis Anda. Ubah secara manual IN atau JOIN menjadi GLOBAL IN atau GLOBAL JOIN.
Misalnya, Anda dapat mengubah pernyataan berikut:
SELECT * FROM test_tbl_distributed WHERE id IN (SELECT id FROM test_tbl_distributed1);Tambahkan GLOBAL untuk memodifikasinya menjadi:
SELECT * FROM test_tbl_distributed WHERE id GLOBAL IN (SELECT id FROM test_tbl_distributed1);Solusi 2: Modifikasi parameter sistem `distributed_product_mode` atau `prefer_global_in_and_join` agar sistem secara otomatis mengganti IN atau JOIN dengan GLOBAL IN atau GLOBAL JOIN.
distributed_product_mode
Anda dapat menggunakan pernyataan berikut untuk mengatur `distributed_product_mode` ke `global`. Hal ini memungkinkan sistem secara otomatis mengganti kueri IN atau JOIN dengan GLOBAL IN atau GLOBAL JOIN.
SET GLOBAL ON cluster default distributed_product_mode='global';Petunjuk penggunaan distributed_product_mode
Fungsi: Pengaturan penting di ClickHouse yang mengontrol perilaku subkueri terdistribusi.
Deskripsi nilai:
`deny` (default): Melarang penggunaan subkueri IN dan JOIN dan melemparkan exception
"Double-distributed IN/JOIN subqueries is denied".`local`: Mengganti database dan tabel dalam subkueri dengan tabel lokal server tujuan (shard) dan mempertahankan IN atau JOIN biasa.
`global`: Mengganti kueri IN atau JOIN dengan GLOBAL IN atau GLOBAL JOIN.
`allow`: Mengizinkan penggunaan subkueri IN dan JOIN.
Skenario yang berlaku: Hanya berlaku untuk kueri yang menggunakan beberapa tabel terdistribusi dengan subkueri JOIN atau IN.
prefer_global_in_and_join
prefer_global_in_and_join
Anda dapat menggunakan pernyataan berikut untuk mengatur `prefer_global_in_and_join` ke 1. Hal ini memungkinkan sistem secara otomatis mengganti kueri IN atau JOIN dengan GLOBAL IN atau GLOBAL JOIN.
SET GLOBAL ON cluster default prefer_global_in_and_join = 1;Petunjuk penggunaan prefer_global_in_and_join
Fungsi: Pengaturan penting di ClickHouse yang mengontrol perilaku operator IN dan JOIN.
Deskripsi nilai:
0 (default): Melarang penggunaan subkueri IN dan JOIN dan melemparkan exception
"Double-distributed IN/JOIN subqueries is denied".1: Mengaktifkan subkueri IN dan JOIN dan mengganti kueri IN atau JOIN dengan GLOBAL IN atau GLOBAL JOIN.
Skenario yang berlaku: Hanya berlaku untuk kueri yang menggunakan beberapa tabel terdistribusi dengan subkueri JOIN atau IN.
Bagaimana cara melihat ruang disk yang digunakan oleh masing-masing tabel?
Anda dapat menggunakan kode berikut untuk melihat ruang disk yang digunakan oleh masing-masing tabel:
SELECT table, formatReadableSize(sum(bytes)) as size, min(min_date) as min_date, max(max_date) as max_date FROM system.parts WHERE active GROUP BY table; Bagaimana cara melihat ukuran data dingin?
Berikut adalah kode contoh:
SELECT * FROM system.disks;Bagaimana cara mengkueri data mana yang berada di penyimpanan dingin?
Berikut adalah kode contoh:
SELECT * FROM system.parts WHERE disk_name = 'cold_disk';Bagaimana cara memindahkan data partisi ke penyimpanan dingin?
Berikut adalah kode contoh:
ALTER TABLE table_name MOVE PARTITION partition_expr TO DISK 'cold_disk';Mengapa terjadi gangguan data dalam pemantauan?
Penyebab umumnya adalah sebagai berikut:
Kueri memicu error OOM.
Perubahan konfigurasi memicu restart.
Instans di-restart setelah peningkatan atau penurunan.
Apakah versi setelah 20.8 mendukung peningkatan versi lancar tanpa migrasi data?
Apakah kluster ClickHouse mendukung peningkatan versi lancar tergantung pada kapan kluster tersebut dibuat. Untuk kluster yang dibeli setelah 1 Desember 2021, Anda dapat melakukan peningkatan versi lancar di tempat ke versi mesin utama tanpa migrasi data. Untuk kluster yang dibeli sebelum 1 Desember 2021, Anda harus memigrasikan data untuk meningkatkan versi mesin utama. Untuk informasi lebih lanjut tentang cara meningkatkan versi, lihat Tingkatkan versi mesin utama.
Apa saja tabel sistem yang umum?
Tabel sistem umum dan fungsinya adalah sebagai berikut:
Nama | Fungsi |
system.processes | Mengkueri pernyataan SQL yang sedang berjalan. |
system.query_log | Mengkueri pernyataan SQL yang telah dijalankan. |
system.merges | Mengkueri informasi penggabungan di kluster. |
system.mutations | Mengkueri informasi mutasi di kluster. |
Bagaimana cara memodifikasi parameter tingkat sistem? Apakah diperlukan restart? Apa dampaknya?
Parameter tingkat sistem sesuai dengan beberapa item konfigurasi dalam file `config.xml`. Untuk memodifikasinya, ikuti langkah-langkah berikut:
Login ke konsol ApsaraDB for ClickHouse.
Pada halaman Cluster List, pilih List of Community Edition Instances, lalu klik ID kluster target.
Di panel navigasi sebelah kiri, klik Parameter Configuration.
Pada halaman Konfigurasi Parameter, klik tombol edit di sebelah Operating parameter value untuk parameter max_concurrent_queries.
Masukkan nilai target di kotak pop-up dan klik Confirm.
Klik Submit parameters.
Klik Submit parameters.
Setelah Anda mengklik OK, proses `clickhouse-server` secara otomatis di-restart. Hal ini menyebabkan pemutusan sementara sekitar 1 menit.
Bagaimana cara memodifikasi parameter tingkat pengguna?
Parameter tingkat pengguna sesuai dengan beberapa item konfigurasi dalam file `users.xml`. Anda dapat menjalankan pernyataan contoh berikut:
SET global ON cluster default ${key}=${value};Parameter tanpa instruksi khusus berlaku segera setelah dijalankan.
Bagaimana cara memodifikasi kuota?
Anda dapat menambahkannya ke pengaturan saat menjalankan pernyataan. Berikut adalah kode contoh:
settings max_memory_usage = XXX;Mengapa penggunaan CPU, penggunaan memori, dan penggunaan memori sangat bervariasi di antara node?
Jika kluster Anda adalah kluster master-replica atau kluster multi-node single-replica, penggunaan CPU dan memori node penulisan akan lebih tinggi daripada node lain saat Anda melakukan banyak operasi penulisan. Setelah data disinkronkan ke node lain, penggunaan CPU dan memori akan seimbang.
Bagaimana cara melihat informasi log sistem detail?
Deskripsi masalah:
Bagaimana cara melihat informasi log sistem detail untuk memecahkan error atau mengidentifikasi potensi masalah.
Solusi:
Periksa parameter `text_log.level` kluster dan lakukan operasi berikut:
Jika `text_log.level` kosong, `text_log` tidak diaktifkan. Anda dapat mengatur `text_log.level` untuk mengaktifkan `text_log`.
Jika `text_log.level` tidak kosong, periksa apakah level `text_log` memenuhi kebutuhan Anda saat ini. Jika tidak, Anda dapat memodifikasi parameter ini untuk mengatur level `text_log`.
Untuk informasi lebih lanjut tentang cara melihat dan memodifikasi parameter `text_log.level`, lihat Konfigurasikan parameter config.xml.
Login ke database tujuan. Untuk informasi lebih lanjut, lihat Hubungkan ke database.
Jalankan pernyataan berikut untuk analisis:
SELECT * FROM system.text_log;
Bagaimana cara menangani masalah konektivitas jaringan antara kluster target dan sumber data?
Jika kluster target dan sumber data menggunakan VPC yang sama dan berada dalam wilayah yang sama, periksa apakah keduanya telah menambahkan alamat IP satu sama lain ke daftar putih mereka. Jika belum, tambahkan alamat IP tersebut ke daftar putih.
Untuk informasi lebih lanjut tentang cara menambahkan alamat IP ke daftar putih di ClickHouse, lihat Konfigurasikan daftar putih.
Untuk informasi lebih lanjut tentang cara menambahkan alamat IP ke daftar putih untuk sumber data lain, lihat dokumentasi produk terkait.
Jika kluster target dan sumber data tidak memenuhi kondisi di atas, Anda dapat memilih solusi jaringan yang sesuai untuk menangani masalah jaringan. Kemudian, tambahkan alamat IP satu sama lain ke daftar putih.
Skenario | Solusi |
Konektivitas cloud-ke-on-premises | |
Koneksi VPC-to-VPC lintas wilayah dan lintas akun | |
Konektivitas antara VPC berbeda dalam wilayah yang sama | Gunakan Cloud Enterprise Network Edisi Dasar untuk menghubungkan VPC dalam wilayah yang sama |
Koneksi VPC-to-VPC lintas wilayah dan lintas akun | Gunakan Cloud Enterprise Network Edisi Dasar untuk menghubungkan VPC lintas wilayah dan akun |
Konektivitas Internet | Gunakan fitur SNAT gateway NAT Internet untuk mengakses Internet |
Dapatkah saya memigrasikan kluster ApsaraDB for ClickHouse Edisi Kompatibel-Komunitas ke kluster Edisi Perusahaan?
Ya, Anda dapat memigrasikan kluster ApsaraDB for ClickHouse Edisi Kompatibel-Komunitas ke kluster Edisi Perusahaan.
Ada dua metode utama untuk memigrasikan data antara kluster Edisi Perusahaan dan Edisi Kompatibel-Komunitas: menggunakan fungsi `remote` atau menggunakan ekspor dan impor file. Untuk informasi lebih lanjut, lihat Migrasikan data dari instans ClickHouse yang dikelola sendiri ke instans ApsaraDB for ClickHouse Edisi Kompatibel-Komunitas.
Bagaimana cara menangani ketidakkonsistenan skema database dan tabel di berbagai shard selama migrasi data?
Deskripsi masalah
Migrasi data memerlukan skema database dan tabel yang konsisten di semua shard. Jika tidak, beberapa skema mungkin gagal dimigrasikan.
Solusi
Skema tabel MergeTree (bukan tabel dalam dari materialized view) tidak konsisten di berbagai shard.
Periksa apakah logika bisnis Anda menyebabkan perbedaan skema antar shard:
Jika bisnis Anda mengharapkan semua skema tabel shard identik, Anda dapat membuat ulang tabel tersebut.
Jika bisnis Anda memerlukan skema tabel berbeda di berbagai shard, Submit a ticket untuk menghubungi dukungan teknis.
Skema tabel dalam dari materialized view tidak konsisten di berbagai shard.
Solusi 1: Ganti nama tabel dalam dan petakan secara eksplisit materialized view dan tabel terdistribusi ke tabel MergeTree target. Gunakan materialized view asli
up_down_votes_per_day_mvsebagai contoh. Lakukan langkah-langkah berikut:Daftar tabel yang jumlahnya tidak sama dengan jumlah node. `NODE_NUM = Jumlah shard × Jumlah replika`.
SELECT database,table,any(create_table_query) AS sql,count() AS cnt
FROM cluster(default, system.tables)
WHERE database NOT IN ('system', 'information_schema', 'INFORMATION_SCHEMA')
GROUP BY  database, table
HAVING cnt != <NODE_NUM>;
Lihat materialized view dengan jumlah tabel dalam yang abnormal.
SELECT substring(hostName(),38,8) AS host,*
FROM cluster(default, system.tables)
WHERE uuid IN (<UUID1>, <UUID2>, ...);
Nonaktifkan perilaku sinkronisasi kluster default. Hal ini diperlukan untuk ApsaraDB for ClickHouse tetapi tidak untuk ClickHouse yang dikelola sendiri. Kemudian, ganti nama tabel dalam agar nama tabel konsisten di setiap node. Untuk mengurangi risiko operasional, Anda dapat mendapatkan alamat IP setiap node, terhubung ke port 3005, dan menjalankan operasi satu per satu di setiap node.
SELECT count() FROM mv_test.up_down_votes_per_day_mv;
SET enforce_on_cluster_default_for_ddl=0;
RENAME TABLE `mv_test`.`.inner_id.9b40675b-3d72-4631-a26d-25459250****` TO `mv_test`.`up_down_votes_per_day`;
Hapus materialized view. Anda harus menjalankannya di setiap node.
SELECT count() FROM mv_test.up_down_votes_per_day_mv;
SET enforce_on_cluster_default_for_ddl=0;
DROP TABLE mv_test.up_down_votes_per_day_mv;
Buat materialized view baru yang secara eksplisit menunjuk ke tabel dalam yang diganti namanya. Anda harus menjalankannya di setiap node.
SELECT count() FROM mv_test.up_down_votes_per_day_mv; SET enforce_on_cluster_default_for_ddl=0; CREATE MATERIALIZED VIEW mv_test.up_down_votes_per_day_mv TO `mv_test`.`up_down_votes_per_day` ( `Day` Date, `UpVotes` UInt32, `DownVotes` UInt32 ) AS SELECT toStartOfDay(CreationDate) AS Day, countIf(VoteTypeId = 2) AS UpVotes, countIf(VoteTypeId = 3) AS DownVotes FROM mv_test.votes GROUP BY Day;Catatan: Anda harus mendefinisikan kolom tabel target dalam materialized view sesuai format aslinya. Jangan gunakan SELECT untuk menyimpulkan skema, karena hal ini dapat menyebabkan exception. Misalnya, jika kolom
tcp_cnmenggunakansumIfdalam pernyataanSELECT, kolom tersebut harus didefinisikan sebagaisumdalam tabel target.Penggunaan yang benar
CREATE MATERIALIZED VIEW net_obs.public_flow_2tuple_1m_local TO net_obs.public_flow_2tuple_1m_local_inner
(
 ...
tcp_cnt AggregateFunction(sum, Float64),
) AS
SELECT
...
sumIfState(pkt_cnt, protocol = '6') AS tcp_cnt,
FROM net_obs.public_flow_5tuple_1m_local
...
Penggunaan yang salah
CREATE MATERIALIZED VIEW net_obs.public_flow_2tuple_1m_local TO net_obs.public_flow_2tuple_1m_local_inner AS
SELECT
...
sumIfState(pkt_cnt, protocol = '6') AS tcp_cnt,
FROM net_obs.public_flow_5tuple_1m_local
...
Solusi 2: Ganti nama tabel dalam, bangun ulang materialized view secara global, dan migrasikan data tabel dalam.
Solusi 3: Tulis ganda ke materialized view dan tunggu selama 7 hari.
Pernyataan SQL yang sama berjalan tanpa error pada instans yang ada tetapi gagal pada instans Edisi Perusahaan versi 24.5 atau lebih baru. Bagaimana cara memperbaikinya?
Instans Edisi Perusahaan baru versi 24.5 atau lebih baru menggunakan analyzer baru sebagai mesin kueri default. Analyzer baru menawarkan kinerja kueri yang lebih baik tetapi mungkin tidak kompatibel dengan beberapa sintaksis SQL lama, yang dapat menyebabkan error penguraian. Jika Anda mengalami error ini, Anda dapat menjalankan pernyataan berikut untuk kembali ke analyzer lama. Untuk informasi lebih lanjut tentang analyzer baru, lihat Analyzer baru diaktifkan secara default.
SET allow_experimental_analyzer = 0;Bagaimana cara menjeda kluster ApsaraDB for ClickHouse?
Fitur jeda tidak didukung untuk kluster Edisi Komunitas ClickHouse, tetapi tersedia untuk kluster Edisi Perusahaan. Untuk menjeda kluster Edisi Perusahaan, buka halaman daftar kluster Edisi Perusahaan. Di pojok kiri atas, pilih wilayah tujuan, temukan kluster target, lalu klik  >Jeda di kolom Actions kluster target.
Bagaimana cara mengonversi tabel MergeTree menjadi tabel ReplicatedMergeTree di kluster?
Deskripsi masalah
Karena pengguna tidak familiar dengan fitur dan prinsip ClickHouse, mereka sering salah membuat tabel dengan mesin MergeTree saat menggunakan kluster multi-replika. Hal ini mencegah data disinkronkan antar node replika setiap shard, yang pada gilirannya menyebabkan hasil kueri tidak konsisten saat Anda mengkueri tabel terdistribusi. Anda kemudian perlu mengonversi tabel MergeTree asli menjadi tabel ReplicatedMergeTree.
Solusi
Di ClickHouse, tidak ada pernyataan DDL untuk memodifikasi langsung mesin penyimpanan tabel. Oleh karena itu, untuk mengonversi tabel MergeTree menjadi tabel ReplicatedMergeTree, Anda harus membuat tabel ReplicatedMergeTree dan mengimpor data dari tabel MergeTree ke dalamnya.
Misalnya, kluster multi-replika Anda memiliki tabel MergeTree bernama `table_src` dan tabel terdistribusi yang sesuai bernama `table_src_d`. Untuk mengonversinya menjadi tabel ReplicatedMergeTree, lakukan langkah-langkah berikut:
Buat tabel tujuan bernama `table_dst` dengan tipe ReplicatedMergeTree dan tabel terdistribusi yang sesuai `table_dst_d`. Untuk informasi lebih lanjut tentang cara membuat tabel, lihat CREATE TABLE.
Impor data dari tabel MergeTree `table_src` ke `table_dst_d`. Ada dua solusi:
Dalam kedua solusi, saat Anda mengkueri data sumber, kueri diarahkan ke tabel MergeTree lokal.
Saat Anda memasukkan data ke tabel tujuan, jika volume datanya tidak besar, Anda dapat memasukkannya langsung ke tabel terdistribusi `table_dst_d` untuk penyeimbangan data.
Jika tabel MergeTree asli `table_src` memiliki data yang seimbang di seluruh node dan volume datanya besar, Anda dapat memasukkan data langsung ke tabel lokal ReplicatedMergeTree `table_dst`.
Jika volume datanya besar, eksekusi memakan waktu lama. Saat Anda menggunakan fungsi `remote`, perhatikan pengaturan timeout fungsi tersebut.
Impor data menggunakan fungsi remote
Dapatkan alamat IP setiap node.
SELECT
    cluster,
    shard_num,
    replica_num,
    is_local,
    host_address
FROM system.clusters
WHERE cluster = 'default';
Gunakan fungsi remote untuk mengimpor data.
Masukkan alamat IP setiap node yang diperoleh pada langkah sebelumnya ke fungsi `remote` dan jalankannya.
INSERT INTO table_dst_d SELECT * FROM remote('node1', db.table_src) ;Misalnya, jika Anda menemukan dua alamat IP node, `10.10.0.165` dan `10.10.0.167`, Anda dapat menjalankan pernyataan INSERT berikut:
INSERT INTO table_dst_d SELECT * FROM remote('10.10.0.167', default.table_src) ;
INSERT INTO table_dst_d SELECT * FROM remote('10.10.0.165', default.table_src) ;
Setelah menjalankan pernyataan dengan semua alamat IP node, konversi tabel MergeTree ke tabel ReplicatedMergeTree di kluster selesai.
Impor data menggunakan tabel lokal
Jika Anda memiliki instans ECS di VPC Anda dengan client ClickHouse yang diinstal, Anda juga dapat login ke setiap node secara individual dan menjalankan operasi berikut.
Hubungkan ke kluster ClickHouse menggunakan antarmuka baris perintah.
Dapatkan alamat IP setiap node.
SELECT
    cluster,
    shard_num,
    replica_num,
    is_local,
    host_address
FROM system.clusters
WHERE cluster = 'default';
Impor data.
Gunakan alamat IP node untuk login ke setiap node secara individual dan jalankan pernyataan berikut:
INSERT INTO table_dst_d SELECT * FROM db.table_src ;Setelah login dan menjalankan pernyataan di semua node, konversi tabel MergeTree ke tabel ReplicatedMergeTree di kluster selesai.
Bagaimana cara mengeksekusi beberapa pernyataan SQL dalam sesi yang sama?
Dengan mengatur pengidentifikasi unik session_id, server ClickHouse mempertahankan konteks yang sama untuk permintaan dengan Session ID yang sama. Hal ini memungkinkan beberapa pernyataan SQL dijalankan dalam sesi yang sama. Gunakan ClickHouse Java Client (V2) untuk terhubung ke ClickHouse sebagai contoh. Langkah-langkah implementasi utamanya adalah sebagai berikut:
Tambahkan dependensi ke file `pom.xml` proyek Maven.
<dependency>
    <groupId>com.clickhouse</groupId>
    <artifactId>client-v2</artifactId>
    <version>0.8.2</version>
</dependency>
Tambahkan
Session IDkustom di `CommandSetting`.package org.example; import com.clickhouse.client.api.Client; import com.clickhouse.client.api.command.CommandSettings; public class Main { public static void main(String[] args) { Client client = new Client.Builder() // Tambahkan titik akhir instans. .addEndpoint("endpoint") // Tambahkan username. .setUsername("username") // Tambahkan password. .setPassword("password") .build(); try { client.ping(10); CommandSettings commandSettings = new CommandSettings(); // Atur session_id. commandSettings.serverSetting("session_id","examplesessionid"); // Atur parameter max_block_size ke 65409 dalam sesi. client.execute("SET max_block_size=65409 ",commandSettings); // Jalankan kueri. client.execute("SELECT 1 ",commandSettings); client.execute("SELECT 2 ",commandSettings); } catch (Exception e) { throw new RuntimeException(e); } finally { client.close(); } } }
Dalam contoh di atas, kedua pernyataan SELECT dieksekusi dalam sesi yang sama, dan keduanya memiliki parameter max_block_size diatur ke 65409. Untuk informasi lebih lanjut tentang cara menggunakan ClickHouse Java Client, lihat Java Client | Dokumentasi ClickHouse.
Mengapa kata kunci FINAL untuk deduplikasi gagal karena JOIN di ClickHouse?
Deskripsi masalah
Saat Anda menggunakan kata kunci FINAL untuk mendeduplikasi hasil kueri, jika pernyataan SQL berisi JOIN, deduplikasi gagal dan data duplikat masih ada dalam hasil. Berikut adalah contoh pernyataan SQL:
SELECT * FROM t1 FINAL JOIN t2 FINAL WHERE xxx;Penyebab
Ini adalah bug yang diketahui yang belum diperbaiki oleh ClickHouse. Deduplikasi gagal karena konflik antara logika eksekusi FINAL dan JOIN. Untuk informasi lebih lanjut, lihat issues ClickHouse.
Solusi
Solusi 1 (Direkomendasikan): Aktifkan optimizer eksperimental. Anda dapat menambahkan konfigurasi di akhir kueri untuk mengaktifkan
FINALtingkat kueri. Tidak diperlukan deklarasi tingkat tabel. Berikut adalah contohnya:Misalnya, pernyataan SQL aslinya adalah:
SELECT * FROM t1 FINAL JOIN t2 FINAL WHERE xxx;Anda perlu menghapus kata kunci
FINALsetelah nama tabel dan menambahkansettings allow_experimental_analyzer = 1,FINAL = 1di akhir SQL. Pernyataan yang disesuaikan adalah sebagai berikut:SELECT * FROM t1 JOIN t2 WHERE xxx SETTINGS allow_experimental_analyzer = 1, FINAL = 1;PentingParameter
allow_experimental_analyzerhanya didukung di versi 23.8 dan yang lebih baru. Jika versi Anda lebih awal dari 23.8, Anda harus meningkatkan versi Anda sebelum menyesuaikan pernyataan SQL. Untuk informasi lebih lanjut tentang cara meningkatkan, lihat Tingkatkan versi mesin utama.Solusi 2 (Gunakan dengan hati-hati):
Paksa penggabungan dan deduplikasi: Jalankan secara berkala
OPTIMIZE TABLE local_table_name FINALuntuk menggabungkan data terlebih dahulu. Gunakan dengan hati-hati untuk tabel besar karena overhead I/O yang tinggi.Sesuaikan kueri SQL: Hapus kata kunci
FINALdan andalkan pengkuerian data yang telah digabung untuk deduplikasi.
PentingBeroperasi dengan hati-hati. Operasi ini mengonsumsi sumber daya I/O yang signifikan dan memengaruhi kinerja saat tabel berisi banyak data.
Mengapa operasi DELETE atau UPDATE tetap belum selesai di kluster ApsaraDB for ClickHouse Edisi Kompatibel-Komunitas?
Deskripsi masalah
Di kluster ApsaraDB for ClickHouse Edisi Kompatibel-Komunitas, operasi DELETE atau UPDATE tetap dalam status belum selesai dalam waktu lama.
Analisis penyebab
Berbeda dengan operasi sinkron di MySQL, operasi DELETE dan UPDATE di kluster ApsaraDB for ClickHouse Edisi Kompatibel-Komunitas dijalankan secara asinkron berdasarkan mekanisme Mutation dan tidak berlaku secara real time. Alur inti Mutation adalah sebagai berikut:
Kirim tugas: Pengguna menjalankan
ALTER TABLE ... UPDATE/DELETEuntuk menghasilkan tugas asinkron.Tandai data: Proses latar belakang membuat file
mutation_*.txtuntuk mencatat rentang data yang akan dimodifikasi. Perubahan tidak berlaku segera.Tulis ulang latar belakang: ClickHouse secara bertahap menulis ulang
bagian datayang terpengaruh dan menerapkan perubahan selama penggabungan.Bersihkan data lama: Blok data lama ditandai untuk dihapus setelah penggabungan selesai.
Jika terlalu banyak operasi Mutation dikeluarkan dalam waktu singkat, tugas Mutation mungkin diblokir. Hal ini dapat menyebabkan operasi DELETE dan UPDATE tetap belum selesai. Sebelum mengeluarkan Mutation, Anda dapat menjalankan pernyataan SQL berikut untuk memeriksa apakah ada banyak Mutation yang sedang berjalan. Jika tidak, Anda dapat melanjutkan untuk menghindari penumpukan Mutation.
SELECT * FROM clusterAllReplicas('default', system.mutations) WHERE is_done = 0;Solusi
Periksa apakah ada terlalu banyak Mutation yang sedang berjalan di kluster.
Anda dapat menjalankan pernyataan SQL berikut untuk melihat status Mutation saat ini di kluster:
SELECT * FROM clusterAllReplicas('default', system.mutations) WHERE is_done = 0;Jika ada banyak Mutation yang sedang berjalan, Anda dapat menggunakan akun istimewa untuk membatalkan sebagian atau seluruhnya.
Batalkan semua tugas Mutation pada satu tabel.
KILL MUTATION WHERE database = 'default' AND table = '<table_name>'Batalkan tugas Mutation tertentu.
KILL MUTATION WHERE database = 'default' AND table = '<table_name>' AND mutation_id = '<mutation_id>'Anda dapat memperoleh `mutation_id` menggunakan pernyataan SQL berikut:
SELECT mutation_id, * FROM clusterAllReplicas('default', system.mutations) WHERE is_done = 0;
Mengapa hasil kueri berturut-turut tidak konsisten di kluster ApsaraDB for ClickHouse Edisi Kompatibel-Komunitas?
Deskripsi masalah
Di kluster ApsaraDB for ClickHouse Edisi Kompatibel-Komunitas, hasil kueri mungkin tidak konsisten saat Anda menjalankan pernyataan SQL yang sama beberapa kali.
Analisis penyebab
Ada dua alasan utama mengapa kueri SQL yang sama mengembalikan hasil tidak konsisten di kluster Edisi Kompatibel-Komunitas. Alasan spesifik dan analisisnya adalah sebagai berikut:
Tabel target dari beberapa kueri dalam kluster multi-shard adalah tabel lokal.
Saat Anda membuat tabel di kluster multi-shard Edisi Kompatibel-Komunitas, Anda harus membuat tabel lokal dan tabel terdistribusi. Dalam jenis kluster ini, alur penulisan data kira-kira sebagai berikut:
Saat data ditulis, data tersebut pertama-tama ditulis ke tabel terdistribusi. Tabel terdistribusi kemudian mendistribusikan data ke tabel lokal di shard yang berbeda untuk disimpan.
Saat Anda mengkueri data, jenis tabel yang berbeda menghasilkan sumber data yang berbeda:
Mengkueri tabel terdistribusi: Tabel terdistribusi mengumpulkan dan mengembalikan data dari tabel lokal di semua shard.
Mengkueri tabel lokal: Setiap kueri mengembalikan data dari tabel lokal di shard acak. Dalam kasus ini, setiap hasil kueri mungkin tidak konsisten dengan yang sebelumnya.
Kluster master-replica dibuat tanpa menggunakan mesin seri
Replicated*.Saat Anda membuat tabel di kluster master-replica Edisi Kompatibel-Komunitas, Anda perlu menggunakan mesin seri `Replicated*`, seperti mesin ReplicatedMergeTree. Mesin seri `Replicated*` memungkinkan sinkronisasi data antar replika.
Jika kluster master-replica tidak menggunakan mesin seri `Replicated*` saat membuat tabel, data tidak disinkronkan antar replika. Hal ini juga dapat menyebabkan hasil kueri tidak konsisten.
Solusi
Tentukan jenis kluster.
Anda dapat menentukan apakah kluster Anda adalah kluster multi-shard, kluster master-replica, atau kluster multi-shard master-replica berdasarkan informasi kluster. Lakukan langkah-langkah berikut:
Login ke konsol ApsaraDB for ClickHouse.
Di pojok kiri atas halaman, pilih List of Community Edition Instances.
Di daftar kluster, klik ID kluster target untuk membuka halaman informasi kluster.
Periksa Series di bawah Cluster Attributes dan Number of node groups di bawah Configuration Information. Tentukan jenis kluster. Logikanya adalah sebagai berikut:
Jumlah grup node lebih dari 1: Kluster multi-shard.
Seri adalah Edisi Ketersediaan Tinggi: Kluster master-replica.
Kedua kondisi di atas terpenuhi: Kluster multi-shard master-replica.
Pilih solusi berdasarkan jenis kluster.
Kluster multi-shard
Periksa jenis tabel yang sedang dikueri. Jika itu adalah tabel lokal, kueri tabel terdistribusi sebagai gantinya.
Jika Anda belum membuat tabel terdistribusi, Anda dapat membuatnya. Untuk informasi lebih lanjut, lihat Buat tabel.
Kluster master-replica
Periksa pernyataan pembuatan tabel target untuk melihat apakah mesinnya adalah mesin seri
Replicated*. Jika tidak, Anda harus membuat ulang tabel tersebut. Untuk informasi lebih lanjut, lihat Buat tabel.Kluster multi-shard master-replica
Periksa jenis tabel yang sedang dikueri.
Jika itu adalah tabel lokal, kueri tabel terdistribusi sebagai gantinya. Jika Anda belum membuat tabel terdistribusi, Anda dapat membuatnya.
Jika Anda mengkueri tabel terdistribusi, periksa apakah mesin tabel lokal yang sesuai dengan tabel terdistribusi adalah mesin seri
Replicated*. Jika tidak, Anda harus membuat ulang tabel lokal dan menggunakan mesin seriReplicated*. Untuk informasi lebih lanjut, lihat Buat tabel.
Mengapa engine ReplacingMergeTree gagal melakukan deduplikasi data setelah penggabungan data paksa menggunakan perintah OPTIMIZE di kluster ApsaraDB for ClickHouse Edisi Kompatibel-Komunitas?
Deskripsi masalah
Tabel engine ReplacingMergeTree di ClickHouse melakukan deduplikasi pada data dengan primary key yang sama selama proses penggabungan data. Setelah Anda menggunakan perintah berikut untuk memaksa penggabungan data, Anda masih dapat menemukan data duplikat dengan primary key yang sama:
optimize TABLE <table_name> FINAL ON cluster default;Analisis penyebab
Deduplikasi engine ReplacingMergeTree hanya berlaku pada satu node. Jika data dengan primary key yang sama didistribusikan ke node yang berbeda karena ekspresi sharding sharding_key tidak ditentukan secara eksplisit (secara default rand() untuk alokasi acak), tidak dapat dijamin bahwa data tidak duplikat saat Anda mengkueri seluruh kluster. Hal ini karena engine ReplacingMergeTree tidak dapat melakukan deduplikasi lintas node.
Solusi
Buat ulang tabel lokal dan tabel terdistribusi. Saat membuat tabel terdistribusi, atur ekspresi sharding sharding_key ke primary key tabel lokal. Untuk informasi lebih lanjut tentang sintaksis pembuatan tabel, lihat CREATE TABLE.
Kedua tabel terdistribusi dan tabel lokal perlu dibuat ulang. Jika Anda hanya membangun ulang tabel terdistribusi, hal ini hanya berlaku untuk data yang baru dimasukkan. Data historis tidak dapat dideduplikasi.