Web Application Firewall (WAF) provides dashboards that display log query and analysis results in charts. The Log Service for WAF feature provides the following three built-in dashboards based on common service and security scenarios: Operation Center, Access Center, and Security Center. If you want to view the service and security data of your website, you need to only specify a time range on the dashboards. You do not need to enter a query statement.
Background information
A dashboard displays real-time data analysis results. You can view multiple charts that are generated based on query and analysis results on a dashboard. If you enable the Log Service for WAF feature and also enable log collection for your website, you can view the service and security data of your website on the built-in dashboards.
Dashboard | Description |
Operation Center | Displays the overall status of the website, such as traffic protection data and overview of attacks. |
Access Center | Displays the access information of the website, such as access metrics, access trends, and request distribution. |
Security Center | Displays the attack information of the website, such as attack targets, attack trends, and distribution of attack sources. |
A dashboard consists of multiple charts. For more information about the charts that are supported by the built-in dashboards, see Charts supported by the built-in dashboards.
You can manually create dashboards based on service-related query and analysis scenarios. Then, you can add custom charts to the dashboards based on your commonly used query statements. For more information, see Overview of visualization.
Prerequisites
The Log Service for WAF feature is enabled. For more information, see Get started with the Simple Log Service for WAF feature.
Procedure
Log on to the WAF console. In the top navigation bar, select the resource group and the region in which the WAF instance is deployed. The region can be Chinese Mainland or Outside Chinese Mainland.
In the left-side navigation pane, choose .
Select a domain name from the domain name drop-down list and turn on Status to enable log collection for the domain name.
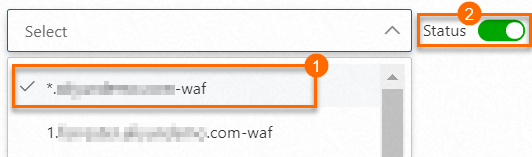
The domain name drop-down list, which is marked as 1 in the preceding figure, contains only the domain names that are protected by WAF. If the domain name for which you want to enable log collection is not included in the drop-down list, you must add the domain name to WAF. For more information, see Tutorial.
Click the Log Analysis tab.
Click the dashboard that you want to view and specify a time range in which you want to query the data. You can click the Operation Center, Access Center, or Security Center tab.
For more information about the chart types that are supported by different dashboards, see Charts supported by the built-in dashboards.
For more information about the common operations that are supported by dashboards, see What to do next.
What to do next
Operation | Application scope | Description |
Specify a time range by using a time selector | Dashboard and chart | Each dashboard contains multiple charts that are generated based on raw log data in a specific time range. You can configure a time selector to specify the time range. Time selectors are classified into the following types:
|
Subscribe to a dashboard | Dashboard | You can subscribe to a dashboard. After you subscribe to a dashboard, the chart data on the dashboard is automatically sent to specified recipients by using emails or DingTalk group messages on a regular basis. In the upper-right corner of a dashboard, click Subscribe and complete the Create Subscription wizard to subscribe to the dashboard. For more information, see Subscribe to a dashboard. |
Drill down into data across charts | Chart | Drill-down is automatically configured for specific charts. This allows you to view underlying data details. Find a chart and move the pointer over the You can click an underlined number in a chart for which drill-down is configured to view underlying data details. For example, if you click the underlined number in the Attacked Hosts chart of the Security Center dashboard, you can identify the domain names that are attacked and the number of attacks. Note You can also switch to the Raw Logs tab to view the raw log data. For more information, see Configure an interaction occurrence for a dashboard to perform drill-down analysis. |
Download logs | Chart | Find a chart whose logs you want to download, move the pointer over the |
Preview the query statement of a chart | Chart | Find a chart whose query statement you want to preview, move the pointer over the |
 icon in the upper-right corner of the chart, and then select Select Time Range. In the Time panel, you can select a time range for the chart.
  icon is displayed. If the icon is displayed, drill-down is configured for the chart.
  icon to preview the query statement that is used for the chart.
 Charts supported by the built-in dashboards
The Log Service of WAF feature provides the built-in Operation Center, Access Center, and Security Center dashboards. These dashboards display the operational status, access information, and attack details of a website. The preceding dashboards display different charts.
Operation Center: displays the overall status of a website, such as traffic protection data and overview of attacks.
Chart name
Chart type
Default time range
Description
Example value
User Request
Single value chart
Compared with last day
Displays the numbers of page views (PVs) and unique visitors (UVs).
48,300
Peak Traffic
Single value chart
Compared with last day
Displays the peak inbound and outbound traffic over the Internet and the peak attack traffic. Unit: Kbit/s.
4.6
Valid Request Ratio
Single value chart
Compared with last hour
Displays the percentage of valid requests that are routed over the Internet and forwarded by WAF.
98.41%
Valid Traffic
Single value chart
Compared with last hour
Displays the volume of network traffic that is forwarded by WAF to the origin server. Unit: MB.
10.7
Request Trend
Line chart
1 week (relative)
Displays the trends in the number of requests, the ratio of valid requests, and the inbound and outbound network bandwidths in Kbit/s.
None
Attack Statistics
Single-value chart, world map, and China map
Compared with last hour
Displays the number of attacks, traffic volume in KB, and attack distribution on the world map and China map.
None
Attacker List
Table
1 hour (relative)
Displays the IP addresses from which attacks are launched.
None
Top 100 Attacked Websites
Table
1 hour (relative)
Displays the top 100 domain names that suffered the most attacks.
None
Access Center: displays the access information of a website, such as access metrics, access trends, and request distribution.
Chart name
Chart type
Default time range
Description
Example value
PV
Single value chart
1 hour (relative)
Displays the total number of PVs.
100,000
UV
Single value chart
1 hour (relative)
Displays the total number of UVs.
100
Traffic In
Single value chart
1 hour (relative)
Displays the total volume of inbound traffic. Unit: MB.
300 MB
Peak Network In Traffic
Single value chart
Today (time frame)
Displays the peak inbound traffic. Unit: Kbit/s.
0.5 KB/s
Peak Network Out Traffic
Single value chart
Today (time frame)
Displays the peak outbound traffic. Unit: Kbit/s.
1.3 KB/s
Traffic Network Trend
Area chart
Today (time frame)
Displays the trends of inbound and outbound traffic. Unit: Kbit/s.
None
PV/UV Trends
Line chart
Today (time frame)
Displays the trends of PVs and UVs.
None
Access Status Distribution
Flow chart
Today (time frame)
Displays the trends of requests with different HTTP status codes such as 400, 304, and 200. Unit: count/h.
None
Access Source
World map
1 hour (relative)
Displays the distribution of requests by country.
None
Traffic In Source (World)
World map
1 hour (relative)
Displays the distribution of inbound traffic by country.
None
Traffic In Source (China)
China map
1 hour (relative)
Displays the distribution of inbound traffic by province in China.
None
Access Heatmap
AMAP
1 hour (relative)
Displays the heat map that shows the source distribution of requests by geographical location.
None
Network Provider Source
Pie chart
1 hour (relative)
Displays the source distribution of requests by Internet service provider, such as China Telecom, China Unicom, China Mobile, and China Education and Research Network.
None
Referer
Table
1 hour (relative)
Displays the information about the top 100 Referers that are most frequently forwarded. The information includes Referer URLs, Referer hosts, and the number of times that the Referer is detected.
None
Mobile Client Distribution
Pie chart
1 hour (relative)
Displays the distribution of requests from mobile clients by client type.
None
PC Client Distribution
Pie chart
1 hour (relative)
Displays the distribution of requests from PC clients by client type.
None
Request Content Type Distribution
Pie chart
1 hour (relative)
Displays the distribution of requested resources by content type, such as HTML, form, JSON, and streaming data.
None
Accessed Sites
Treemap chart
1 hour (relative)
Displays the top 30 domain names that are most frequently accessed.
None
Top Clients
Table
1 hour (relative)
Displays the information about the top 100 clients that frequently visit your domain names. The information includes the client IP address, region and city, network information, request method, inbound traffic, number of access errors, and number of attacks.
None
URL With Slowest Response
Table
1 hour (relative)
Displays the information about the top 100 URLs that have long response time. The information includes the domain name, URL, average response time, and number of access requests.
None
Security Center: displays the attack information of a website, such as attack targets, attack trends, and distribution of attack sources
Chart name
Chart type
Default time range
Description
Example value
Peak Attack Size
Single value chart
1 hour (relative)
Displays the peak attack traffic. Unit: bit/s.
100 Bps
Attacked Hosts
Single value chart
Today (time frame)
Displays the number of attacked websites.
3
Source Country Of Attack
Single value chart
Today (time frame)
Displays the number of countries from which attacks are launched.
2
Attack Traffic
Single value chart
1 hour (relative)
Displays the total volume of traffic that is generated by attacks. Unit: bytes.
1 B
Attacker UV
Single value chart
1 hour (relative)
Displays the number of UVs.
40
Attack type distribution
Flow chart
Today (time frame)
Displays the distribution of attacks by attack type.
None
Intercepted Attack
Single value chart
1 hour (relative)
Displays the total number of attacks that are blocked by WAF.
100
CC Attack Interception
Single value chart
1 hour (relative)
Displays the number of HTTP flood attacks that are blocked by WAF.
10 times
Web Attack Interception
Single value chart
1 hour (relative)
Displays the number of web application attacks that are blocked by WAF.
80
Access Control Event
Single value chart
1 hour (relative)
Displays the number of requests that are blocked by custom protection policies (ACL policies) of WAF.
10 times
CC Attack (World)
World map
1 hour (relative)
Displays the distribution of HTTP flood attacks by country.
None
CC Attack (China)
China map
1 hour (relative)
Displays the distribution of HTTP flood attacks by province in China.
None
Web Attack (World)
World map
1 hour (relative)
Displays the distribution of web application attacks by country.
None
Web Attack (China)
China map
1 hour (relative)
Displays the distribution of web application attacks by province in China.
None
Access Control Attack (World)
World map
1 hour (relative)
Displays the distribution of requests that are blocked by custom protection policies (ACL policies) by country.
None
Access Control Attack (China)
China map
1 hour (relative)
Displays the distribution of requests that are blocked by custom protection policies (ACL policies) by province in China.
None
Attacked Hosts
Treemap chart
1 hour (relative)
Displays the websites that are most frequently attacked.
None
CC Attack Strategy Distribution
Pie chart
1 hour (relative)
Displays the distribution of attacks that trigger HTTP flood protection policies.
None
Web Attack Type Distribution
Pie chart
1 hour (relative)
Displays the distribution of web attacks by attack type.
None
Top Attackers
Table
1 hour (relative)
Displays the IP addresses, province information, and carriers of the first 100 clients that launch the most recent attacks. It also displays the number of attacks for each attack type and the volume of traffic that is generated by these attacks.
None
Attacker Referer
Table
1 hour (relative)
Displays the Referer information of attacks, including Referer URLs, Referer hosts, and the number of times that the Referer is detected.
None
For more information, see Chart overview.