VPC flow logs capture inbound and outbound traffic for elastic network interfaces (ENIs). Use flow logs to monitor network performance, troubleshoot connectivity issues, and optimize traffic costs.
How flow logs work

Flow logs collect traffic at three levels:
| Resource type | Scope |
|---|---|
| ENI | Traffic for a single elastic network interface. |
| vSwitch | Traffic for all ENIs in the vSwitch, including ENIs created after the flow log. |
| VPC | Traffic for all ENIs in the VPC, including ENIs created after the flow log. |
The system aggregates traffic data into flow log entries within each capture window, which defaults to 10 minutes, and delivers the entries to Simple Log Service. Each entry records a 5-tuple network stream within a specific capture window: source IP address, destination IP address, source port, destination port, and protocol.
The following example shows two flow log entries for a single TCP connection:
| eni-id | direction | srcaddr | srcport | protocol | dstaddr | dstport | ... |
|---|---|---|---|---|---|---|---|
| eni-xxx | in | 10.0.0.1 | 53870 | 6 | 10.0.0.2 | 80 | ... |
| eni-xxx | out | 10.0.0.2 | 80 | 6 | 10.0.0.1 | 53870 | ... |
For all fields, see Flow log field descriptions.
Traffic collection paths
To reduce costs, collect traffic only from specific paths instead of all traffic.
| Path | Description |
|---|---|
| IPv4 Gateway | Traffic to the Internet through an IPv4 gateway |
| NAT Gateway | Traffic through a NAT Gateway |
| VPN Gateway | Traffic through a VPN Gateway |
| Transit Routers (TRs) | Traffic through a transit router (TR) |
| Gateway Endpoint | Traffic to Alibaba Cloud services through a gateway endpoint |
| Virtual Border Router (VBR) | Traffic to an Express Connect circuit through a virtual border router (VBR) |
| Express Connect Router (ECR) | Traffic through an Express Connect Router (ECR) |
| GWLB Endpoint | Traffic through a Gateway Load Balancer (GWLB) endpoint |
| Internet | Traffic to the Internet |
Internet-facing Classic Load Balancer (CLB) is not supported.
Use cases
Network monitoring: Monitor VPC throughput and performance. Analyze traffic trends, troubleshoot issues, and verify the effectiveness of security groups or network ACLs.
Traffic cost reduction: Identify ECS instances that generate high traffic volumes. Analyze traffic from a VPC to other regions, public IP addresses, or on-premises data centers.
Network security analysis: Identify suspicious IP addresses. Investigate intrusion records during security incidents.
Prerequisites
Before you begin, complete the following one-time setup:
On the Flow Log page, click Activate Now. If you created flow log instances during the public preview, you must still click Activate Now to view and manage these instances.
On the Flow Log page, click Authorize Now, and then click Authorize. This creates a Resource Access Management (RAM) role named
AliyunVPCLogArchiveRoleand a RAM policy namedAliyunVPCLogArchiveRolePolicy. VPC uses this role and policy to access Simple Log Service and deliver flow logs.Activate Simple Log Service on the Simple Log Service product page.
Create a flow log
Console
Go to the Flow Log page in the VPC console and click Create a flow log. Configure the following parameters in the Create a flow log panel.
Collection Configuration
Region: Select the region of the resource to monitor.
Resource Type and Resource Instance: Set the collection type to ENI, vSwitch, or VPC. If you select VPC or vSwitch, the system monitors traffic for all ENIs within the selected resource.
Data Transfer Type: Select whether to capture traffic that is allowed or rejected by access control rules, such as security group and network ACL rules.
IP Version: Select IPv4 to capture only IPv4 traffic, or Dual-stack to capture both IPv4 and IPv6 traffic. The following regions support IPv6: China (Hangzhou), China (Shanghai), China (Qingdao), China (Beijing), China (Hohhot), China (Shenzhen), Singapore, US (Silicon Valley), and US (Virginia).
Sampling Interval (Minutes): Set the capture window duration. Valid values: 1, 5, or 10 minutes. A shorter interval generates logs more frequently and helps you locate issues faster. A longer interval produces fewer entries and reduces costs but provides less timely data. For example, for a TCP session with a persistent connection, a 1-minute capture window produces 60 entries per hour while a 10-minute window produces 6.
If multiple flow log instances in a VPC collect traffic from the same ENI, the shortest sampling interval among all instances is used as the actual capture window.
Sampling Path: Select specific collection paths to reduce costs. Deselect the default All Scenarios option first. Available paths: IPv4 Gateway, NAT Gateway, VPN Gateway, Transit Routers (TRs), Gateway Endpoint, virtual border router (VBR), Express Connect Router (ECR), Gateway Load Balancer (GWLB) Endpoint, and traffic to the Internet.
Analysis and Delivery
Select one or more delivery destinations:
Deliver to Log Service: Select a project and a Logstore. For the first flow log, click Create Project and Create Logstore to isolate the data. To consolidate multiple flow logs, select the same Logstore.
Enable Log Analysis Report: Automatically creates indexes and creates dashboards for the Logstore. This enables SQL queries and visualization analysis. When enabled, this feature incurs charges from Simple Log Service.
Enable NIS Traffic Analysis: Not yet available.
After you create the flow log, traffic collection starts automatically.
API
Before creating a flow log, activate the feature and create a project and Logstore in Simple Log Service:
Call OpenFlowLogService to enable the flow log feature.
Call CreateProject to create a project, and call CreateLogStore to create a Logstore.
Then perform the following operations:
| Operation | API |
|---|---|
| Create a flow log | CreateFlowLog |
| Create an index (optional) | CreateIndex |
| Stop a flow log | DeactiveFlowLog |
| Start a flow log | ActiveFlowLog |
| Delete a flow log | DeleteFlowLog |
Terraform
Resources: alicloud_log_project, alicloud_log_store, alicloud_vpc_flow_log
# Specify the region where you want to create the flow log.
provider "alicloud" {
  region = "cn-hangzhou"
}

# Specify the description of the project, and the names of the Logstore and flow log.
variable "name" {
  default = "vpc-flowlog-example"
}

# Generate a random number to create a project name.
resource "random_uuid" "example" {
}

# Create a Simple Log Service project.
resource "alicloud_log_project" "example" {
  project_name = substr("tf-example-${replace(random_uuid.example.result, "-", "")}", 0, 16)
  description  = var.name
}

# Create a Simple Log Service Logstore.
resource "alicloud_log_store" "example" {
  project_name          = alicloud_log_project.example.project_name
  logstore_name         = var.name
  shard_count           = 3
  auto_split            = true
  max_split_shard_count = 60
  append_meta           = true
}

# Create a VPC flow log.
resource "alicloud_vpc_flow_log" "example" {
  flow_log_name        = var.name
  log_store_name       = alicloud_log_store.example.logstore_name
  description          = var.name
  traffic_path         = ["all"] # Collect traffic from all scenarios.
  project_name         = alicloud_log_project.example.project_name
  resource_type        = "VPC" # The resource type is VPC.
  resource_id          = "vpc-bp1ekmgzch0bo3hxXXXXXX" # The ID of the VPC.
  aggregation_interval = "1" # The capture window is 1 minute.
  traffic_type         = "All" # Collect all traffic, regardless of whether it is allowed or rejected by access control.
}
Start or stop a flow log
On the Flow Log page in the VPC console, find the target flow log and click Start or Stop in the Actions column.
After you stop a flow log, VPC no longer charges flow log generation fees. Simple Log Service continues to charge for storing existing flow logs.
Delete a flow log
On the Flow Log page in the VPC console, find the target flow log and click Delete in the Actions column.
After you delete a flow log, VPC no longer charges flow log generation fees. Simple Log Service continues to charge for storing existing flow logs. To stop all charges, delete the Logstore in the Simple Log Service console.
Analyze flow logs
Custom analysis through a Logstore
Go to the Flow Log page in the VPC console. In the Simple Log Service column of the target flow log, click the Logstore to open the details page. On this page, you can:
View flow log entry details in Raw Logs.
Enter a statement to query and analyze flow logs.

Analysis using Flow Log Center templates
The Flow Log Center provides visualization templates for VPC flow logs, including VPC policy statistics, ENI traffic statistics, and inter-CIDR block traffic statistics.
Go to the Flow Log Center and click Add in the upper-right corner.
In the Create Instance panel, enter an Instance Name, select the Project and Logstore that contain the flow log, and click OK.
Click the instance ID in the Flow Log Center. On the Flow Log Details page, view and analyze the flow log data.

The Monitoring Center provides the following dashboards:
| Dashboard | Description |
|---|---|
| Overview | Trends for accepted and rejected flow logs, inbound and outbound traffic, total packets and bytes for each VPC and ENI, and geographical distribution of source and destination IP addresses. |
| Policy Statistics | Trends for accepted and rejected connections based on 5-tuple (source IP, source port, protocol type, destination IP, and destination port). Accept: traffic allowed by security groups and network ACLs. Reject: traffic rejected by security groups and network ACLs. |
| ENI Traffic | Inbound and outbound traffic for ENIs. |
| Inter-ECS Traffic | Traffic between ECS instances. |
| Custom Query | See Get started with log query and analysis. |
Enable inter-domain analysis (optional)
On the Flow Log Details page, click CIDR Block Settings. On the CIDR Block Settings tab, turn on Inter-Domain Analysis.
After you enable inter-domain analysis, the system creates a data transformation task that generates VPC flow logs with CIDR block details for traffic analysis between CIDR blocks. The data transformation feature incurs charges.
Simple Log Service includes predefined CIDR blocks, as shown in the following figure. You can also add custom CIDR blocks.

The Inter-Domain Analysis feature provides the following dashboards:
| Dashboard | Description |
|---|---|
| Inter-domain Traffic | Traffic between CIDR blocks. |
| ECS-to-Domain Traffic | Traffic from ECS instances to destination CIDR blocks. |
| Threat Intelligence | Threat intelligence about source and destination IP addresses. |
| Custom Query | Query and analyze CIDR block data in VPC flow logs. |
Analysis through API
Call GetLogsV2 to query and analyze flow logs.
Examples
Identify source IPs accessing a specific port

Assume you have a web server accessible from the Internet over port 80, and you use security group rules to restrict access from certain source IPs. Create a flow log to query the source IPs that access port 80 and count the requests allowed or rejected by the security group.
Step 1: Create a flow log
For Resource Instance, select the web server's ENI.
Set Data Transfer Type to All Traffic.
For delivery, select Deliver to Log Service and Enable Log Analysis Report.
Retain the default values for other parameters.
Step 2: Analyze the flow logs
Filter source IPs that access port 80 of 10.0.0.1, and count how many times each IP is allowed or rejected:
dstaddr:10.0.0.1 AND dstport:80 | SELECT -- Filter logs where the destination IP address is 10.0.0.1 and the destination port is 80.
srcaddr,
SUM(CASE WHEN action = 'ACCEPT' THEN 1 ELSE 0 END) AS accept_count, -- Count 1 for each ACCEPT (allowed) action.
SUM(CASE WHEN action = 'REJECT' THEN 1 ELSE 0 END) AS reject_count -- Count 1 for each REJECT (denied) action.
FROM log
GROUP BY srcaddr -- Group by source IP address.
ORDER BY accept_count + reject_count DESC -- Sort the results in descending order based on the total number of allowed and denied actions.
Results

The srcaddr column lists the source IPs that accessed port 80. The accept_count and reject_count columns show the number of entries allowed and rejected by the security group within the query time range.
Five source IPs accessed port 80: 120.26.XX.XX, 121.43.XX.XX, 154.212.XX.XX, 176.65.XX.XX, and 198.235.XX.XX.
All requests from 120.26.XX.XX were allowed. All requests from the other public IP addresses were rejected.
Analyze traffic between ECS instances
| Item | ECS instances in a VPC | ECS instances in different VPCs |
|---|---|---|
| Diagram |  |  |
| Description | Three ECS instances are deployed in one VPC with traffic between them. Use flow logs to analyze the traffic rate and trends between these instances. | Two VPCs in different regions, each with multiple ECS instances, are connected through a VPC peering connection. The peering connection is billed on a pay-as-you-go basis for Cloud Data Transfer (CDT). The inter-region data transfer fee has significantly increased. Use flow logs to identify the ECS instances that generate high traffic volumes and reduce costs. |
| Flow log configuration | For Resource Instance, select the ENI associated with ECS1. For Analysis and Delivery, select Deliver to Log Service and Enable Log Analysis Report. Retain the default values for other parameters. | For Resource Instance, select VPC VPC1. In the Analysis and Delivery section, select Deliver to Log Service and Enable Log Analysis Report. Retain the default values for other parameters. |
| Query statement | Query the traffic rate trends between ECS1 and other ECS instances: | Query the session traffic rate trends between the two VPCs: |
Same-VPC query:
(srcaddr:10.0.0.1 AND dstaddr:10.0.0.*) OR (srcaddr:10.0.0.* AND dstaddr:10.0.0.1)  | select --Filter traffic trends between ECS1 and other ECS instances.
date_format(from_unixtime(__time__ - __time__% 60), '%H:%i:%S') as time, -- Convert the UNIX timestamp to a readable time format.
concat(srcaddr,'->', dstaddr) as src_to_dst, -- Concatenate IP session pairs in the "source_ip->destination_ip" format.
sum(bytes*8/60) as bandwidth -- Convert bytes to bits and divide by the 1-minute capture window.
group by time,srcaddr,dstaddr -- Group by time, source IP address, and destination IP address.
order by time asc  -- Sort by time in ascending order.
limit 100 -- Display the first 100 results.
Cross-VPC query:
(srcaddr:10.0.* AND dstaddr:172.16.*) OR (srcaddr:172.16.* AND dstaddr:10.0.*)  | select --Filter sessions between the two VPCs.
date_format(from_unixtime(__time__ - __time__% 60), '%H:%i:%S') as time, -- Convert the UNIX timestamp to a readable time format.
concat(srcaddr,'->', dstaddr) as src_to_dst, -- Concatenate IP session pairs in the "source_ip->destination_ip" format.
sum(bytes*8/60) as bandwidth -- Convert bytes to bits and divide by the 1-minute capture window.
group by time,srcaddr,dstaddr -- Group by time, source IP address, and destination IP address.
order by time asc  -- Sort by time in ascending order.
limit 100 -- Display the first 100 results.
Results
| Same-VPC | Cross-VPC |
|---|---|
 |  |
| The traffic rate from 10.0.0.1 to 10.0.0.2 is the highest at approximately 1.4 Mbps. The traffic rate from 10.0.0.1 to 10.0.0.3 is approximately 700 Kbps. Other traffic accounts for a small proportion. | The traffic from 10.0.0.1 to 172.16.0.1 shows a traffic spike of approximately 6 Mbps. |
Identify high-traffic ECS instances behind an Internet NAT gateway

Multiple ECS instances are deployed in the same vSwitch and access the Internet through the SNAT feature of an Internet NAT gateway. NAT traffic to the Internet has significantly increased, causing slow server responses. Use flow logs to identify which ECS instances generate the most traffic.
Step 1: Create a flow log
For Resource Instance, select
vSwitch 2, the vSwitch for the Internet NAT gateway.For delivery, select Deliver to Log Service and Enable Log Analysis Report.
Retain the default values for other parameters.
Step 2: Filter specific traffic paths
To filter traffic on specific paths, specify conditions in the query statement:
| Diagram | No. | Filter method |
|---|---|---|
 | 1 | Filter traffic from an ECS instance to the NAT gateway: Set direction to in and srcaddr to the private IP address of the ECS instance. |
| 2 | Filter traffic from the NAT gateway to the Internet: Set direction to out and srcaddr to the private IP address of the NAT gateway. | |
| 3 | Filter traffic from the Internet to the NAT gateway: Set direction to in and dstaddr to the private IP address of the NAT gateway. | |
| 4 | Filter traffic from the NAT gateway to an ECS instance: Set direction to out and dstaddr to the private IP address of the ECS instance. |
Step 3: Analyze the flow logs
On the path from an ECS instance to the NAT gateway, analyze traffic to a specific public IP address:
direction: 'in' and srcaddr: 10.0.0.* and dstaddr: 120.26.XX.XX | select -- Filter logs of ECS instances that access a specific public IP address.
date_format(from_unixtime(__time__ - __time__% 60), '%H:%i:%S') as time, srcaddr,  -- Convert the UNIX timestamp to a readable time format.
sum(bytes*8/60) as bandwidth  -- Convert bytes to bits and divide by the 1-minute capture window.
group by time,srcaddr -- Group by time and source IP address.
order by time asc  -- Sort by time in ascending order.
limit 100 -- Display the first 100 results.
Other common queries
Filter inbound traffic from a specific public IP address to all ECS instances (NAT gateway to ECS path):
direction: 'out' and dstaddr: 10.0.0.* and srcaddr: 120.26.XX.XX | select -- Filter logs of ECS instances that access a specific public IP address.
date_format(from_unixtime(__time__ - __time__% 60), '%H:%i:%S') as time,   -- Convert the UNIX timestamp to a readable time format.
dstaddr,
sum(bytes*8/60) as bandwidth  -- Convert bytes to bits and divide by the 1-minute capture window.
group by time,dstaddr -- Group by time and destination IP address.
order by time asc  -- Sort by time in ascending order.
limit 100 -- Display the first 100 results.
Filter outbound traffic from ECS instances to all public IP addresses (ECS to NAT gateway path):
direction: 'in' and srcaddr: 10.0.0.*  | select -- Filter logs of ECS instances that access all public IP addresses.
date_format(from_unixtime(__time__ - __time__% 60), '%H:%i:%S') as time,  -- Convert the UNIX timestamp to a readable time format.
concat(srcaddr,'->', dstaddr), -- Concatenate IP session pairs in the "source_ip->destination_ip" format.
sum(bytes*8/60) as bandwidth  -- Convert bytes to bits and divide by the 1-minute capture window.
group by time,srcaddr,dstaddr -- Group by time, source IP address, and destination IP address.
order by time asc  -- Sort by time in ascending order.
limit 100 -- Display the first 100 results.
Results

On the path from the ECS instance to the NAT gateway, the traffic rate from 10.0.0.1 (ECS1) to the public IP address 120.26.XX.XX is the highest at approximately 12 Kbps.
Analyze Express Connect circuit traffic distribution

An enterprise uses two VPCs in a region to deploy different services. It connects its on-premises data center to Alibaba Cloud using an Express Connect circuit and CEN. The IT department plans to use flow logs to monitor how traffic from different services in the VPCs uses the Express Connect circuit for network resource planning and performance improvements.
Step 1: Create flow logs
Create two flow logs that deliver data to the same Logstore. Configure each flow log with the following parameters:
For Resource Instance, under VPC, select VPC1 and VPC2.
Set Sampling Path to Traffic Through Transit Routers.
For delivery, select Deliver to Log Service, choose the same Logstore for both flow logs, and select Enable Log Analysis Report.
Retain the default values for other parameters.
Step 2: Analyze the flow logs
Analyze the proportion of traffic from each VPC that flows to the on-premises data center:
action: ACCEPT and srcaddr: 192.168.* and dstaddr:10.1.* |
WITH
    vpc1_traffic AS (
        SELECT
            date_trunc('minute',__time__) AS minute,
            SUM(bytes*8/(case WHEN "end"-start=0 THEN 1 else "end"-start end)) AS total_vpc1_traffic
        FROM
            log
        WHERE
            srcaddr LIKE '192.168.20.%'
        GROUP BY
            date_trunc('minute',__time__)
    ),
    vpc2_traffic AS (
        SELECT
            date_trunc('minute',__time__) AS minute,
            SUM(bytes*8/(case WHEN "end"-start=0 THEN 1 else "end"-start end)) AS total_vpc2_traffic
        FROM
            log
        WHERE
            srcaddr LIKE '192.168.10.%'
        GROUP BY
            date_trunc('minute',__time__)
    )
SELECT
    COALESCE(vpc1_traffic.minute, vpc2_traffic.minute) AS minute,
    (COALESCE(vpc1_traffic.total_vpc1_traffic, 0) * 100/ NULLIF((COALESCE(vpc1_traffic.total_vpc1_traffic, 0) + COALESCE(vpc2_traffic.total_vpc2_traffic, 0)), 0)) AS vpc1_percentage,
    (COALESCE(vpc2_traffic.total_vpc2_traffic, 0) * 100/ NULLIF((COALESCE(vpc1_traffic.total_vpc1_traffic, 0) + COALESCE(vpc2_traffic.total_vpc2_traffic, 0)), 0)) AS vpc2_percentage
FROM vpc1_traffic FULL OUTER JOIN vpc2_traffic ON vpc1_traffic.minute = vpc2_traffic.minute
ORDER BY minute
Click to view an explanation of the SQL statement.
Filter conditions:
srcaddr: 192.168.* filters logs from source addresses that start with 192.168.*.dstaddr: 10.1.* filters logs where the destination address starts with 10.1.*.action: ACCEPT filters logs where the value of theactionfield is ACCEPT.
Main query
A FULL OUTER JOIN is used to combine the results of
vpc1_trafficandvpc2_trafficbased on theminutefield.Calculates the percentage of traffic for each VPC per minute:
vpc1_percentagerepresents the percentage of traffic from VPC1 in the total traffic.vpc2_percentagerepresents the percentage of traffic from VPC2 in the total traffic.
The query results are sorted in ascending order by
minute.
WITH subquery: The SQL statement contains two subqueries:
vpc1_trafficandvpc2_traffic. The following describes thevpc1_trafficsubquery:The date_trunc function truncates the UNIX timestamp in the
__time__field to the minute, and the result is aliased asminute.The SUM function is used to calculate the total traffic rate in bit/s over a one-minute period, and the result is named
total_vpc1_traffic.Filters traffic records with source addresses of 192.168.20.*, which is the CIDR block of VPC1.
Groups the results by minute.
Results
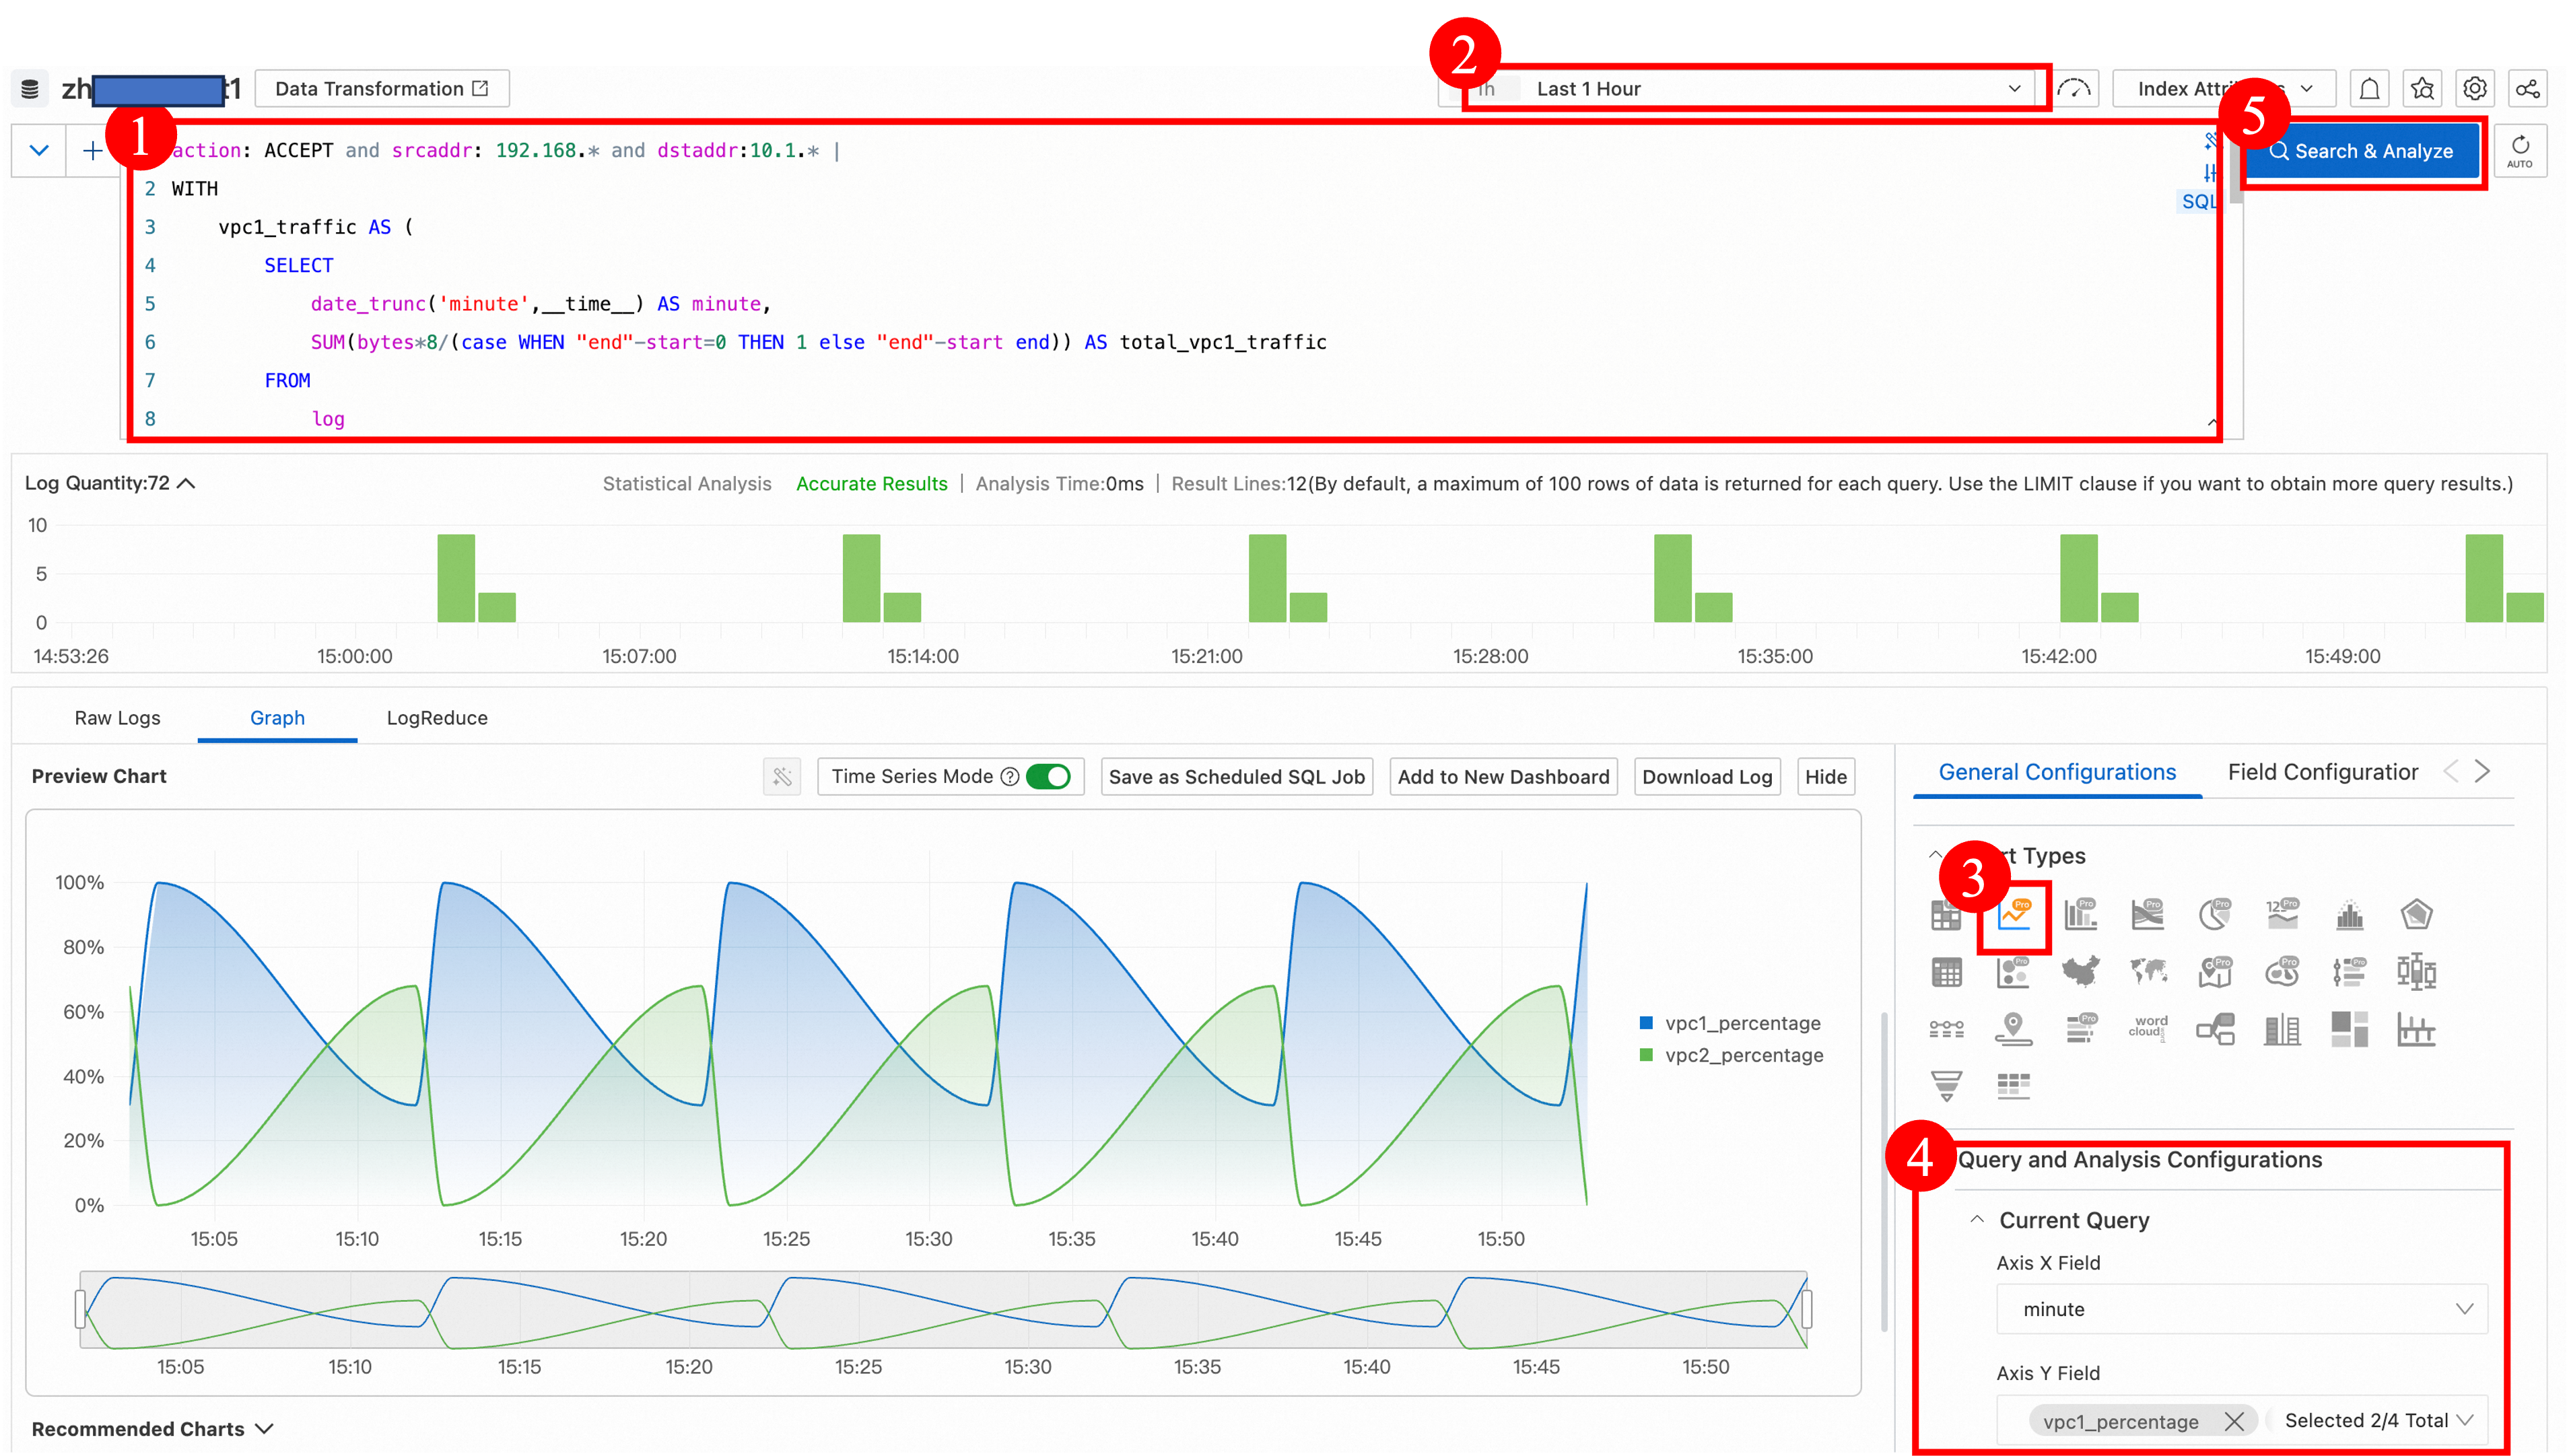
During the period from 14:50 to 15:50, the proportion of traffic from VPC1 flowing to the on-premises data center is high.
Flow log field descriptions
Fields that are not applicable display - as the value.
| Field | Description |
|---|---|
| version | The flow log version. The version of all log entries is 1. |
| account-id | The ID of the Alibaba Cloud account. |
| eni-id | The ID of the ENI. |
| vm-id | The ID of the ECS instance to which the ENI is attached. |
| vswitch-id | The ID of the vSwitch to which the ENI belongs. |
| vpc-id | The ID of the VPC to which the ENI belongs. |
| type | The traffic type: IPv4 or IPv6. The following regions support Dual-stack traffic collection: China (Hangzhou), China (Shanghai), China (Qingdao), China (Beijing), China (Hohhot), China (Shenzhen), Singapore, US (Silicon Valley), and US (Virginia). |
| protocol | The IANA protocol number. Common values: 1 (ICMP), 6 (TCP), 17 (UDP). |
| srcaddr | The source IP address. |
| srcport | The source port. |
| dstaddr | The destination IP address. |
| dstport | The destination port. |
| direction | The traffic direction: in (inbound to the ENI) or out (outbound from the ENI). |
| action | Whether access is allowed by a security group or network ACL: ACCEPT or REJECT. |
| packets | The number of packets. |
| bytes | The number of bytes. |
| start | The time when the first packet was received in the capture window. Format: UNIX timestamp. |
| end | For a persistent connection, the time when the capture window ends. For a short-lived connection, the time when the connection closes. Format: UNIX timestamp. |
| tcp-flags | The TCP flags represented in decimal, reflecting the combination of flags (SYN, ACK, FIN, and others) in the TCP protocol. A flow log entry in a capture window may correspond to multiple TCP packets. This value is the result of a bitwise OR operation on the flag fields of all related packets. For example, if two packets have SYN (2) and SYN-ACK (18) flags, the recorded TCP flag is 18 (2 | 18 = 18). Common TCP flag values: FIN (1), SYN (2), RST (4), PSH (8), SYN-ACK (18), URG (32). For more information, see RFC 793. |
| log-status | The log record status: OK (data recorded as expected), NODATA (no traffic during the capture window), SKIPDATA (some flow log entries were skipped due to high traffic volume or system overload). |
| traffic_path | The path where the traffic occurs. See the traffic_path values table. |
traffic_path values
| Value | Description |
|---|---|
| 0 | Traffic collected in paths other than those listed below. |
| 1 | Traffic through other resources in the same VPC. |
| 2 | Private network traffic that accesses ECS instances in the same VPC. |
| 3 | Traffic through an ENI. |
| 4 | Traffic through a high-availability virtual IP address (HaVip). |
| 5 | Traffic that accesses Alibaba Cloud services in the same region. |
| 6 | Traffic to Alibaba Cloud services through a gateway endpoint. |
| 7 | Traffic through a NAT gateway. |
| 8 | Traffic through a transit router (TR). |
| 9 | Traffic through a VPN gateway. |
| 10 | Traffic to a leased line through a virtual border router (VBR). |
| 11 | Traffic that accesses a VPC in the same region through CEN Basic Edition. |
| 12 | Traffic through CEN Basic Edition in paths other than 11, 18, 19, and 20. Examples: traffic that accesses cross-region Alibaba Cloud services or Cloud Connect Network (CCN) through CEN Basic Edition. |
| 13 | Traffic to the Internet through an IPv4 gateway. |
| 14 | Traffic to the Internet through an IPv6 gateway. |
| 15 | Traffic to the Internet through a public IP address. |
| 17 | Traffic through a VPC peering connection. |
| 18 | Traffic that accesses a cross-region VPC through CEN Basic Edition. |
| 19 | Traffic that accesses a VBR in the same region through CEN Basic Edition. |
| 20 | Traffic that accesses a cross-region VBR through CEN Basic Edition. |
| 21 | Traffic through an Express Connect Router (ECR). |
| 22 | Traffic through a Gateway Load Balancer (GWLB) endpoint. |
Flow log entry examples
Allowed traffic
In this example, the Alibaba Cloud account ID is 1210123456\*\*\*\*\*\* and the VPC flow log version is 1. During the 1-minute interval between 17:10:20 and 17:11:20 on July 12, 2024, the ENI eni-bp166tg9uk1ryf****** allowed the following outbound traffic:
The source address 172.31.16.139 and port 1332 transmitted 10 packets to the destination address 172.31.16.21 and port 80 over TCP (protocol 6). The total packet size is 2,048 bytes. The log status is normal.
{
  "account-id": "1210123456******",
  "action": "ACCEPT",
  "bytes": "2048",
  "direction": "out",
  "dstaddr": "172.31.16.21",
  "dstport": "80",
  "end": "1720775480",
  "eni-id": "eni-bp166tg9uk1ryf******",
  "log-status": "OK",
  "packets": "10",
  "protocol": "6",
  "srcaddr": "172.31.16.139",
  "srcport": "1332",
  "start": "1720775420",
  "tcp-flags": "22",
  "traffic_path": "-",
  "version": "-",
  "vm-id": "1",
  "vpc-id": "-",
  "vswitch-id": "vpc-bp1qf0c43jb3maz******"
}
Rejected traffic
In this example, the Alibaba Cloud account ID is 1210123456\*\*\*\*\*\* and the VPC flow log version is 1. During the 10-minute interval between 10:20:00 and 10:30:00 on July 15, 2024, the ENI eni-bp1ftp5sm9oszt****** rejected the following inbound traffic:
The source address 172.31.16.139 and port 1332 transmitted 20 packets to the destination address 172.31.16.21 and port 80 over TCP (protocol 6). The total packet size is 4,208 bytes. The log status is normal.
{
  "account-id": "1210123456******",
  "action": "REJECT",
  "bytes": "4208",
  "direction": "in",
  "dstaddr": "172.31.16.21",
  "dstport": "80",
  "end": "1721010600",
  "eni-id": "eni-bp1ftp5sm9oszt******",
  "log-status": "OK",
  "packets": "20",
  "protocol": "6",
  "srcaddr": "172.31.16.139",
  "srcport": "1332",
  "start": "1721010000",
  "tcp-flags": "22",
  "traffic_path": "-",
  "version": "-",
  "vm-id": "1",
  "vpc-id": "-",
  "vswitch-id": "vpc-bp1qf0c43jb3maz******"
}
No data
In this example, the Alibaba Cloud account ID is 1210123456\*\*\*\*\*\* and the VPC flow log version is 1. During the 3-minute period from 10:52:20 to 10:55:20 on July 15, 2024, no traffic data (NODATA) was recorded for the ENI eni-bp1j7mmp34jlve******.
{
  "account-id": "1210123456******",
  "action": "-",
  "bytes": "-",
  "direction": "-",
  "dstaddr": "-",
  "dstport": "-",
  "end": "1721012120",
  "eni-id": "eni-bp1j7mmp34jlve******",
  "log-status": "NODATA",
  "packets": "-",
  "protocol": "-",
  "srcaddr": "-",
  "srcport": "-",
  "start": "1721011940",
  "tcp-flags": "-",
  "traffic_path": "-",
  "version": "-",
  "vm-id": "1",
  "vpc-id": "-",
  "vswitch-id": "vpc-bp1qf0c43jb3maz******"
}
Skipped entries
In this example, the Alibaba Cloud account ID is 1210123456\*\*\*\*\*\* and the VPC flow log version is 1. During the 3-minute period from 16:20:30 to 16:23:30 on July 12, 2024, flow log entries for the ENI eni-bp1dfm4xnlpruv****** were skipped (SKIPDATA).
{
  "account-id": "1210123456******",
  "action": "-",
  "bytes": "-",
  "direction": "-",
  "dstaddr": "-",
  "dstport": "-",
  "end": "1720772610",
  "eni-id": "eni-bp1dfm4xnlpruv******",
  "log-status": "SKIPDATA",
  "packets": "-",
  "protocol": "-",
  "srcaddr": "-",
  "srcport": "-",
  "start": "1720772430",
  "tcp-flags": "-",
  "traffic_path": "-",
  "version": "-",
  "vm-id": "1",
  "vpc-id": "-",
  "vswitch-id": "vpc-bp1qf0c43jb3maz******"
}
Billing
Billing components
Flow log fees consist of two components:
Flow log fees = Flow log generation fees + Simple Log Service fees
Flow log generation fee: Charged by VPC before flow logs are delivered to Simple Log Service. Based on the monthly volume of logs collected in each region, using tiered pricing. Each Alibaba Cloud account receives a free quota of 5 GB per month in each region.
| Monthly log volume | Price (USD/GB) |
|---|---|
| 0 TB to 10 TB (inclusive) | 0.37 |
| 10 TB to 30 TB (inclusive) | 0.185 |
| 30 TB to 50 TB (inclusive) | 0.074 |
| More than 50 TB | 0.037 |
The billing cycle and bill generation cycle are both 1 hour. Bills are typically generated 3 to 4 hours after a billing cycle ends.
Simple Log Service fee: Charged by Simple Log Service after flow logs are delivered. Includes charges for data writes and storage.
Two billing methods are available: pay-by-data-volume and pay-by-feature. If you create a flow log in the VPC console and choose to create a new Logstore, the pay-by-feature billing method is used by default.
Billing examples
Example 1: You enable flow logs in a region on September 1, 2022. During the month, 3 GB of logs are delivered to Simple Log Service. Because 3 GB falls within the free quota of 5 GB per month, the total flow log fee equals only the Simple Log Service fee.
Example 2: You enable flow logs in the China (Shanghai) region on September 1, 2022. During the month, 100 GB of logs are delivered. The flow log generation fee is (100 - 5) x 0.37 = USD 35.15. The total flow log fee is USD 35.15 + Simple Log Service fee.
Example 3: You enable flow logs in the China (Beijing) region on September 1, 2022. During the month, 60 TB of logs are delivered. The flow log generation fee is calculated using tiered pricing:
| Tier | Calculation | Fee (USD) |
|---|---|---|
| 0 TB to 10 TB (inclusive) | (10 x 1024 - 5) x 0.37 | 3,786.95 |
| 10 TB to 30 TB (inclusive) | 20 x 1024 x 0.185 | 3,788.80 |
| 30 TB to 50 TB (inclusive) | 20 x 1024 x 0.074 | 1,515.52 |
| More than 50 TB | 10 x 1024 x 0.037 | 378.88 |
| Total | 9,470.15 |
The total flow log fee is USD 9,470.15 + Simple Log Service fee.
Overdue payments
Overdue payment policy
The system calculates the average bill for the last 24 hours and checks whether your account balance can cover the estimated bill for the next three billing cycles. If your account balance is insufficient, the system sends a notification by text message and email.
A VPC flow log continues to provide services for 15 days after the payment becomes overdue.
If the outstanding amount is not paid within 15 days after the payment becomes overdue, the VPC flow log instance enters a suspended state. No operations can be performed on the flow log instance in this state.
Renewal policy
If you top up your Alibaba Cloud account within 15 days after a payment becomes overdue, your service is not interrupted.
If you top up your account within 30 days after the payment becomes overdue, the system automatically pays the outstanding amount. After payment is completed, the VPC flow log instance automatically resumes services.
If the outstanding amount is not paid 15 days after the VPC flow log is suspended, the VPC flow log is automatically deleted. An email notification is sent one day before deletion. After the flow log is deleted, its configurations and data are permanently lost and cannot be recovered.
Limits
After you enable flow logs, the first traffic capture for a newly created ENI may be delayed, typically by less than 10 minutes.
Flow logs do not support collecting multicast traffic.
Supported regions
| Area | Regions |
|---|---|
| Asia Pacific - China | China (Hangzhou), China (Shanghai), China (Qingdao), China (Beijing), China (Zhangjiakou), China (Hohhot), China (Ulanqab), China (Shenzhen), China (Heyuan), China (Guangzhou), China (Chengdu), China (Hong Kong), and China (Fuzhou - Local Region, Closing Down) |
| Asia Pacific - Others | Japan (Tokyo), South Korea (Seoul), Singapore, Malaysia (Kuala Lumpur), Indonesia (Jakarta), Philippines (Manila), and Thailand (Bangkok) |
| Europe & Americas | Germany (Frankfurt), UK (London), US (Silicon Valley), and US (Virginia) |
| Middle East | UAE (Dubai) and SAU (Riyadh - Partner Region) |
Quotas
| Quota name | Description | Default limit | How to increase |
|---|---|---|---|
| vpc_quota_flowlog_inst_nums_per_user | The number of flow log instances that can be created by a user. | 10 | Go to the Quota Management page or Quota Center to request a quota increase. |
FAQ
How long are VPC flow logs retained?
VPC flow logs are delivered to Simple Log Service and are subject to its data retention policy.
If you select Enable Log Analysis Report when creating a VPC flow log, the default data retention period for the Logstore is 7 days.
Without Enable Log Analysis Report, the default retention period is 300 days.
You can check and modify the data retention period of an existing Logstore in the Simple Log Service console.