On the Trace Analysis page of an application in the Tracing Analysis console, you can view the analysis charts of different monitoring metrics for traces, the trace list, the application topology, and the table of aggregated traces.
Procedure
Log on to the Managed Service for OpenTelemetry console. In the left-side navigation pane, click Applications.
On the Applications page, select a region in the top navigation bar and click the name of the application that you want to manage.
In the left-side navigation pane, click Trace Analysis.
Enable the real-time full data analysis feature
After you specify a sampling ratio for span data, you can enable the real-time full data analysis feature to analyze the complete sampled data in real time. The analysis results show the detailed information about the relevant traces.
If you have not specified a sampling ratio or you set the sampling ratio to 100%, after you enable this feature, all the collected span data within your Alibaba Cloud account is displayed in the console.
On the Trace Analysis page, click Enable full real-time analysis in the upper-right corner.
Select a time range as needed.
After you select a time range, the Trace Analysis page displays the complete data that is sampled in the specified time range and updates the data in real time.
Filter traces
On the Trace Analysis page, select a predefined or custom time range that is used to filter traces in the upper-right corner.
Click the search box in the upper part of the Trace Analysis page. In the drop-down list that appears, perform the following operations as needed and click Search:
Enter values in the Min and Max fields next to the Time consumed parameter to query the information about the traces whose duration is between the specified value range.
Select Exception to query the information about the exceptional traces.
Set the Span name, Machine/IP, and Label (Tag) parameters as needed to query the information about the traces that meet the specified filter conditions. Each time when you specify filter conditions, you can specify multiple span names, servers, IP addresses, and tags.
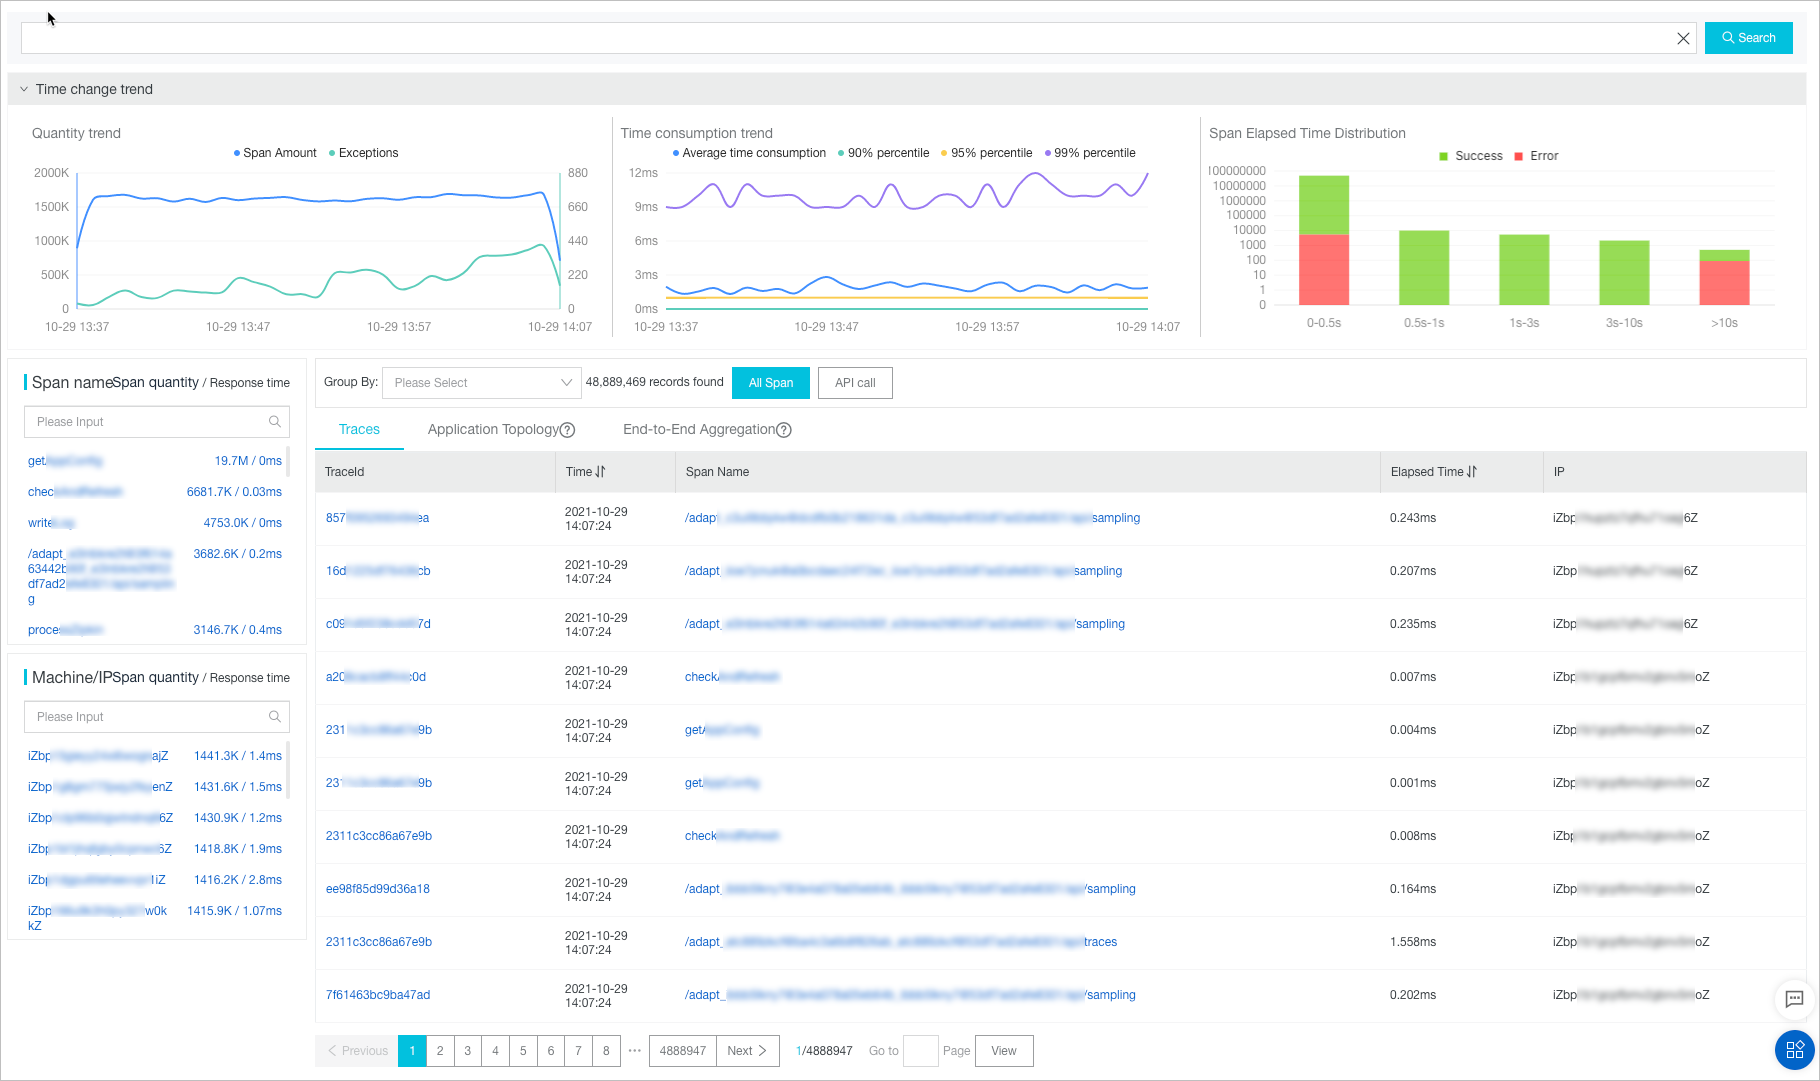
View the analysis charts
The Time change trend section displays three analysis charts. The charts show the trends in the total number of spans and number of exceptional spans, the trend in the duration of spans, and the duration distribution of spans.
In the Time change trend section, perform the following operations as needed:
Move the pointer over a chart and view the detailed statistics.
Select a time range to view the statistics in the specified time range.
Click the legend to hide or show the data.
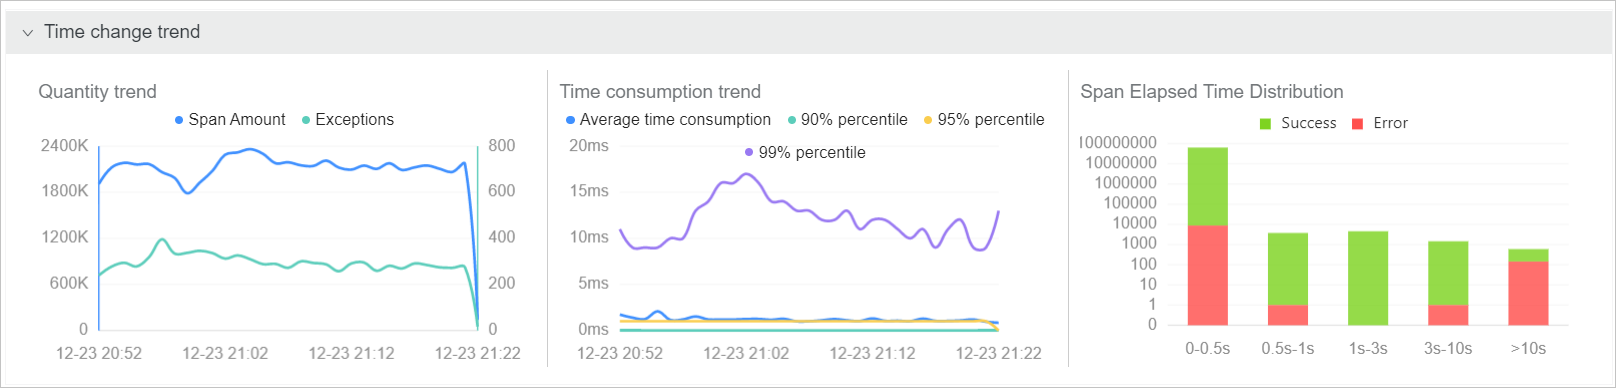
View spans and servers in lists
The Span name and Machine/IP lists display all the spans and servers within your Alibaba Cloud account.
In the Span name or Machine/IP list, perform the following operations as needed:
In the search box in a list, enter a keyword and click the search icon to search for spans or servers.
Click Span quantity or Response time in the upper-right corner of a list to sort the items in the list in descending order based on the number of spans or duration.
Click the name of a span or the IP address of a server to use the name or IP address as a filter condition.
Group traces by field
On the Trace Analysis page, select a field from the Group By drop-down list.
Click All Span or API call on the right side.
If you click All Span, traces are grouped based on the selected field for all spans.
If you click API call, traces are grouped based on the selected field for the first span.
You can click the field name to view the relevant traces.
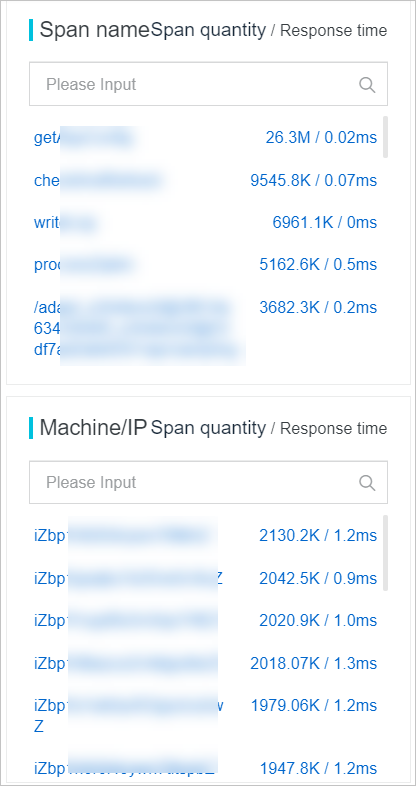
View information on the Traces tab
The Traces tab displays the ID, start time, span name, duration, and server IP address of each trace.
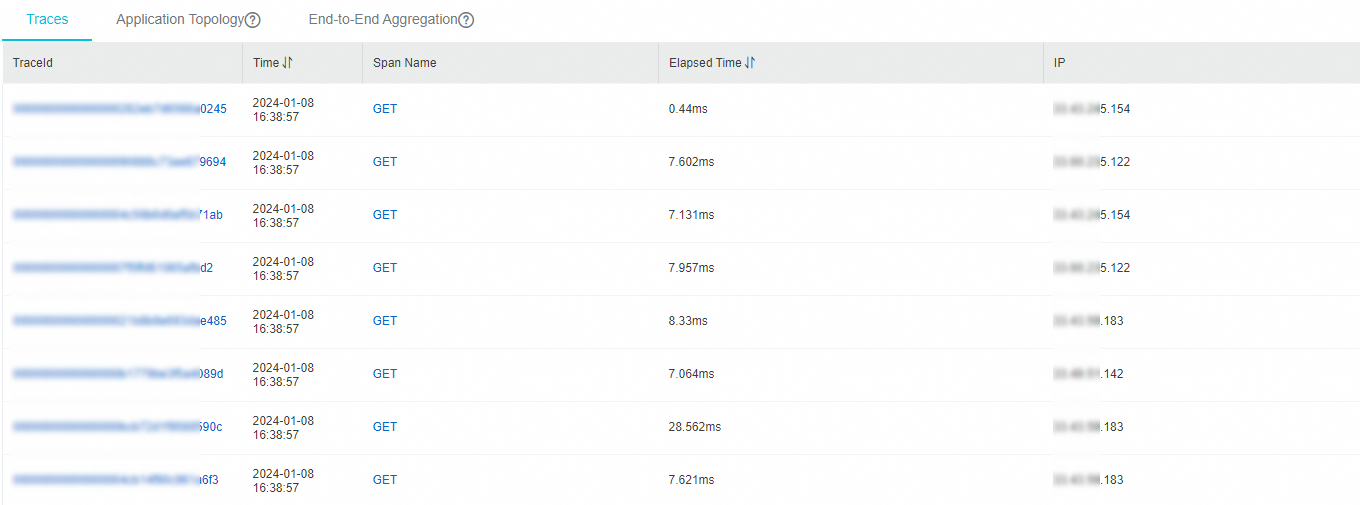
On the Traces tab, perform the following operations as needed:
Click the ID of a trace to view the waterfall chart of the trace. For more information, see View the waterfall chart of a trace.
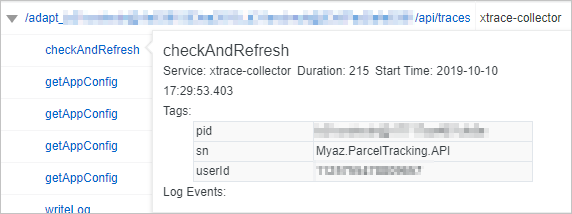
Move the pointer over the name of a span to view the information about the span, including the duration, start time, tags, and log events.
View the application topology
On the Application Topology tab, you can view the application topology that displays the dependencies between the current application and other applications. You can also view the request percentage, call multiplier, and duration ratio between applications. For the best performance, the application topology feature can aggregate the request data of up to 5,000 traces for the current application.
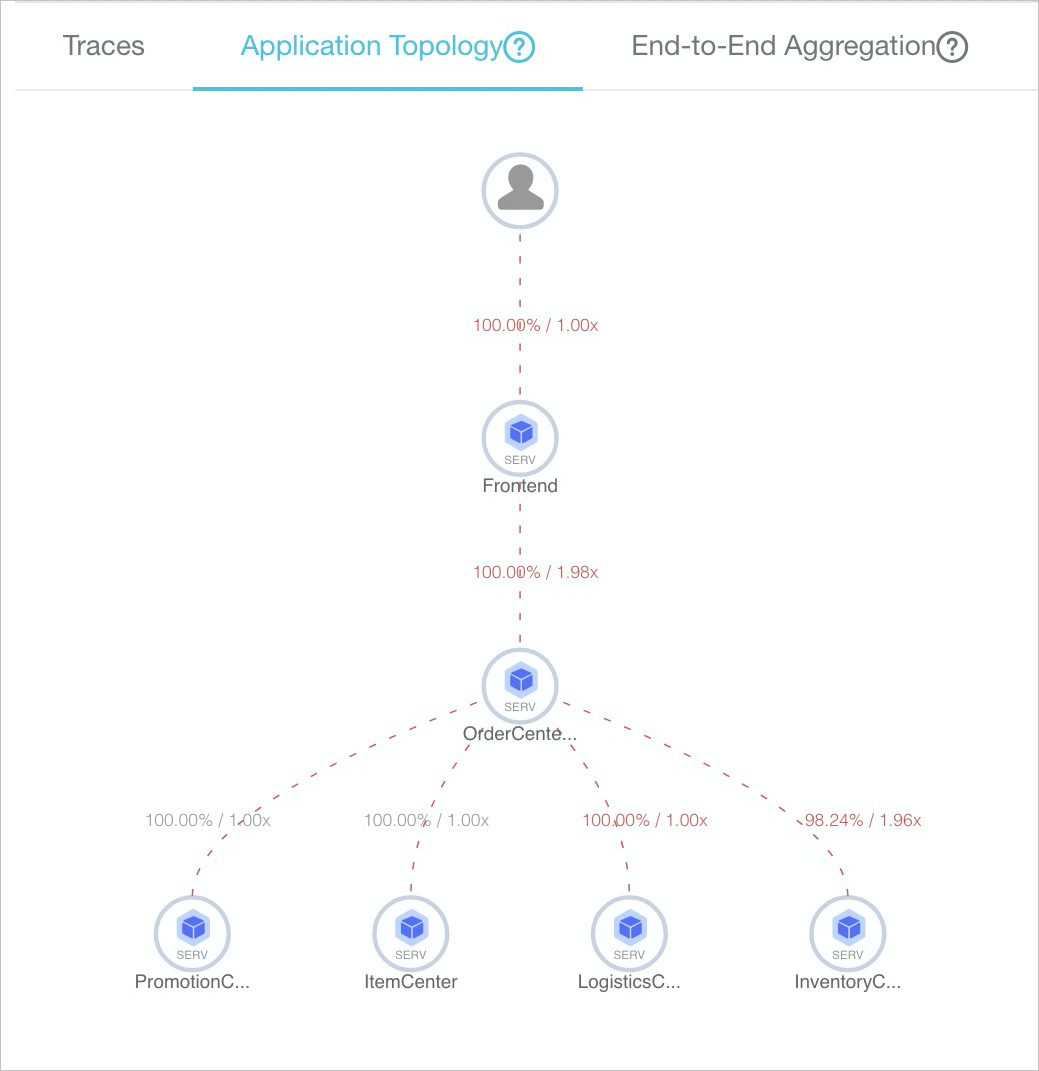
The request percentage is calculated by dividing the number of requests involved when Application A calls Application B by the total number of requests received by Application A. For example, 100 requests are received by Application A, but only 90 requests are involved when Application A calls Application B. In this case, the request percentage of A to B is 90%. Some requests are sent to Application B because Application A may filter all the requests based on an IF statement.
The call multiplier is calculated by dividing the number of spans involved when Application A calls Application B by the total number of spans received by Application A. For example, 100 spans are received by Application A, and 300 spans are involved when Application A calls Application B. In this case, the call multiplier of A to B is three. If the dependency from A to B is marked as 90%/3x, 90% of the requests in Application A are sent to call Application B, and Application A calls Application B three times on average.
Trace aggregation details
The End-to-End Aggregation tab aggregates traces based on span names and application names. For the best performance, the end-to-end aggregation feature can aggregate the request data of up to 5,000 traces for the current application.
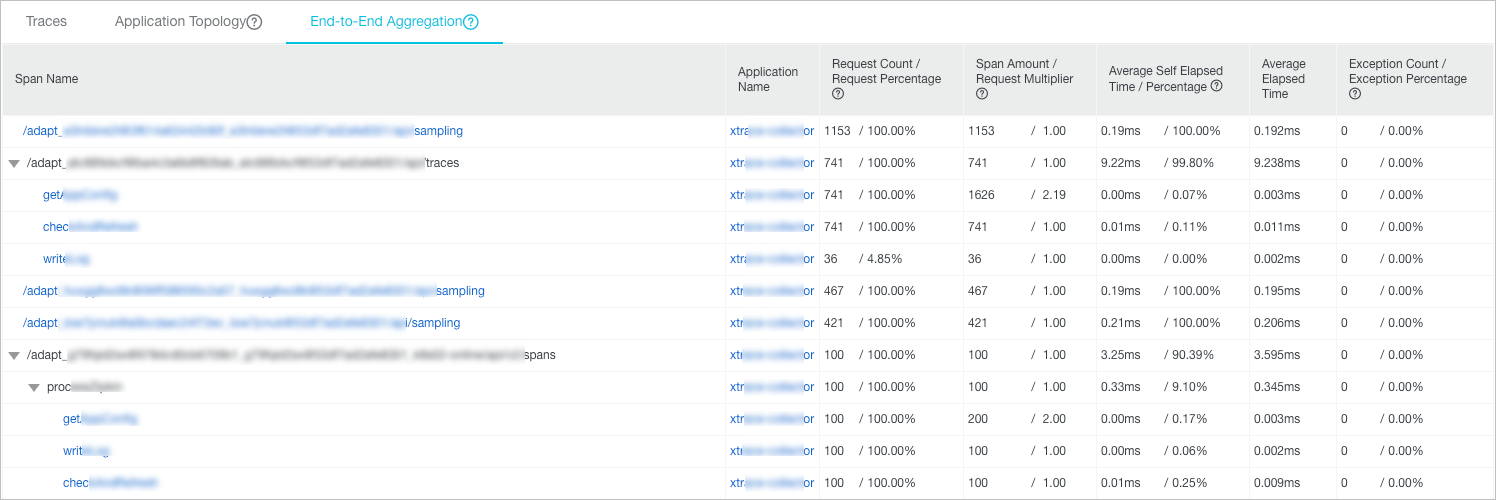
Request Count / Request Percentage: The request percentage is the ratio of the request count of the current span to the total request count. For example, the total request count is 100, and the request percentage is 10%. In this case, 10 requests are sent to call the current span. The request percentage is calculated by dividing the request count of the current span by the total request count.
Span Amount / Request Multiplier: The request multiplier indicates how many times each request calls the current span on average. For example, 1.5x indicates that each request calls the current span 1.5 times on average. The request multiplier is calculated by dividing the span count by the request count of spans.
Average Self Elapsed Time / Percentage: The average exclusive duration of a span excludes the average duration of its child spans. For example, Span B is a child span of Span A. If the duration of Span A is 10 ms and that of Span B is 8 ms, the exclusive duration of Span A is 2 ms. The exclusive duration of a span is calculated by deducting the sum of duration of its child spans from the duration of the span. For asynchronous calls, the duration of child spans is not deducted.
Exception Count / Exception Percentage: The exception percentage is the ratio of the count of exceptional requests to the total request count. For example, 3% indicates that 3% of all requests are exceptional. The exception percentage is calculated by dividing the number of exceptional requests by the total request count. The number of exceptional requests does not equal the exception count. When the request multiplier is greater than 1, an exceptional request may have multiple exceptions.
On the End-to-End Aggregation tab, perform the following operations as needed:
Move the pointer over the name of a span in blue to view the traces that are related to the span. Click the ID of a trace to view the waterfall chart of the trace. For more information, see View the waterfall chart of a trace.
Click the name of an application to obtain an overview of the application. For more information, see Application overview.
View the waterfall chart of a trace
The Traces tab displays the span name, timeline chart, application name, start time, server IP address, and status of each trace.
The IP Address column may display IP addresses or server names. The information displayed depends on the display settings that are configured on the Application Settings page. For more information, see Manage applications and tags.

In the Span Name column, move the pointer over the name of a span to view the information about the span. The information includes the duration, start time, tags, and log events.