You can get started with Tunnel Service in the Tablestore console.
Procedure
Step 1: Create a tunnel
Go to the Tunnels page.
Log on to the Tablestore console.
In the top navigation bar, select a resource group and a region.
On the Overview page, click the instance name or click Manage Instance in the Actions column of the instance.
On the Instance Details tab, click the Tables tab. Then, click the data table name and select the Tunnels tab. Alternatively, you can click
 and select Tunnels from the shortcut menu in the Actions column of the data table.
On the Tunnels tab, click Create Tunnel.
In the Create Tunnel dialog box, configure the parameters. The following table describes the parameters.
Parameter
Description
Tunnel Name
The name of the tunnel.
Type
The type of the tunnel. Valid values:
Full: Only full data can be consumed and processed.
Incremental: Only incremental data can be consumed and processed.
Differential: After full data is consumed and processed, incremental data is consumed and processed.
Start Time
If you set the Type parameter to Incremental or Differential, the system considers the data that is written to the data table after the tunnel is created incremental. If you want to consume incremental data that is written to the data table after a specific point in time, configure the Start Time parameter for incremental data. You can also configure the End Time parameter for incremental data based on your business requirements.
Valid value range of the Start Time and End Time parameters:
[Current system time - Stream validity period + 5 minutes, Current system time]. The values of the two parameters is a 64-bit timestamp in milliseconds. The value of the End Time parameter must be greater than the value of the Start Time parameter.ImportantThe Stream validity period is the validity period of incremental logs in milliseconds. The maximum Stream validity period is seven days. You can specify the Stream validity period when you enable Stream for the data table. You cannot modify the Stream validity period after you specify it.
End Time
Click OK.
After the tunnel is created, click Show Channels in the Actions column of the tunnel. You can view the data content in the tunnel, consumption latency monitoring information, and the number of consumed data rows in each channel.
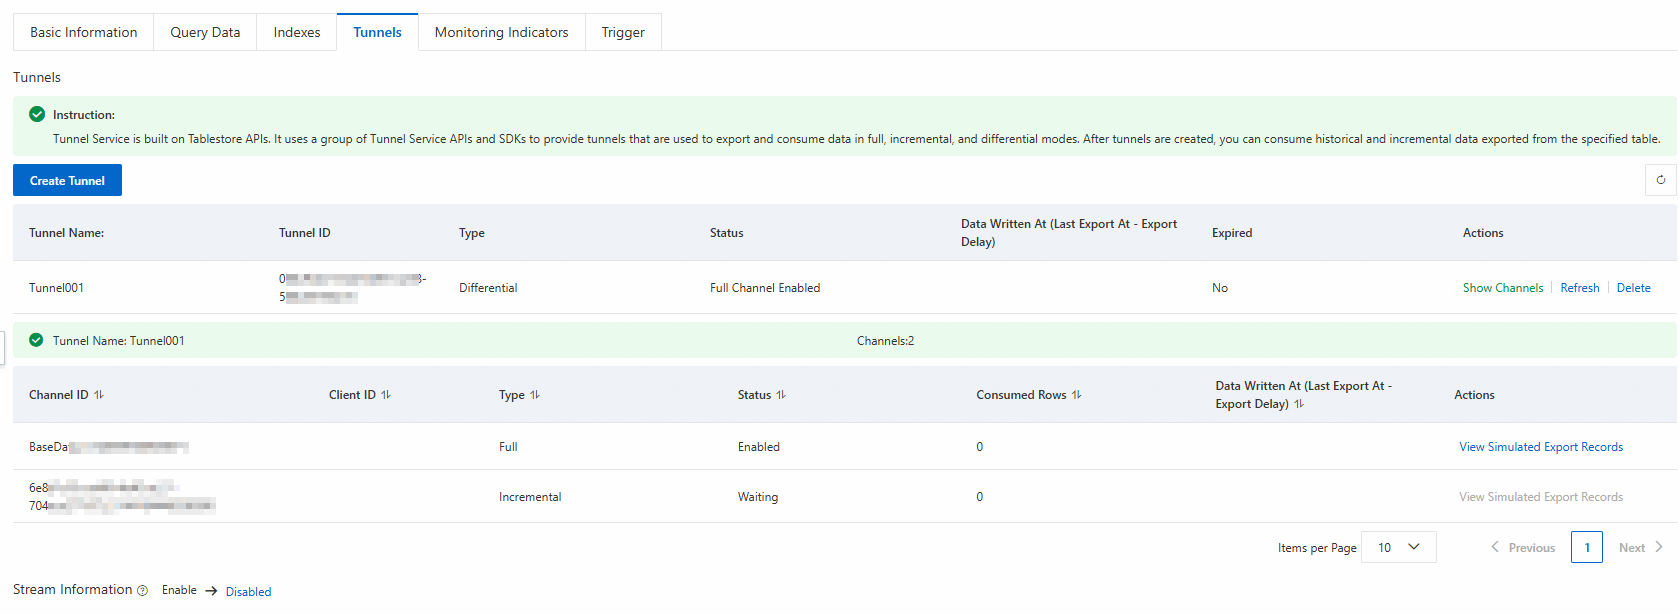
Step 2: (Optional) Preview the data format in the tunnel
After you create a tunnel, you can simulate data consumption to preview the data types in the tunnel.
Write data to or delete data from the table.
On the Tunnels tab of the table, click Show Channels in the Actions column of the tunnel.
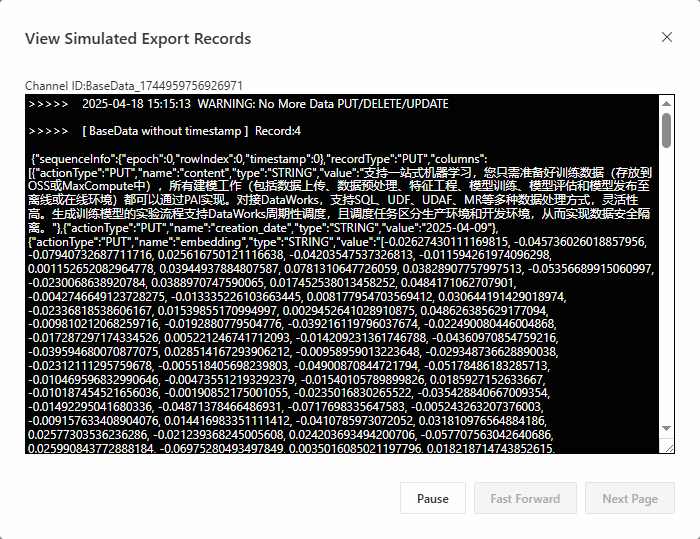
In the Actions column of the channel, click View Simulated Export Records.
In the View Simulated Export Records dialog box, click Start.
The information of the consumed data is displayed in the dialog box, as shown in the following figure.
Step 3: Use the tunnel to consume data
Copy the tunnel ID from the tunnel list on the Tunnels tab.
Use Tablestore SDK for Java or Tablestore SDK for Go to quickly consume data by using the tunnel.
After data consumption, you can view the incremental data consumption logs, such as consumption statistics and the latest synchronization time of incremental channels. You can also view consumption latency and the number of consumed data rows in each channel in the Tablestore console.
Development integration
You can use the Tablestore CLI or Tablestore SDKs to perform tunnel operations.
Feature | Invocation method |
Create a tunnel | |
Query information about all tunnels of a data table | |
Query information about a tunnel | |
Simulate data consumption by using a tunnel | |
Delete a tunnel |