Monitoring and logging can ensure the availability of your Tablestore resources and the normal running and health of your business. You can use monitoring services to collect monitoring data. Alibaba Cloud provides various monitoring and log audit-related services, such as CloudMonitor and ActionTrail, to help you monitor the usage of cloud resources, monitor the business running status in real time, and respond to alerts at the earliest opportunity.
Resource data monitoring
You can monitor data of the following Tablestore resources in the Tablestore console: instances, tables, and search indexes. The monitoring data varies based on the type of the resource. For more information, see View monitoring data in the Tablestore console.
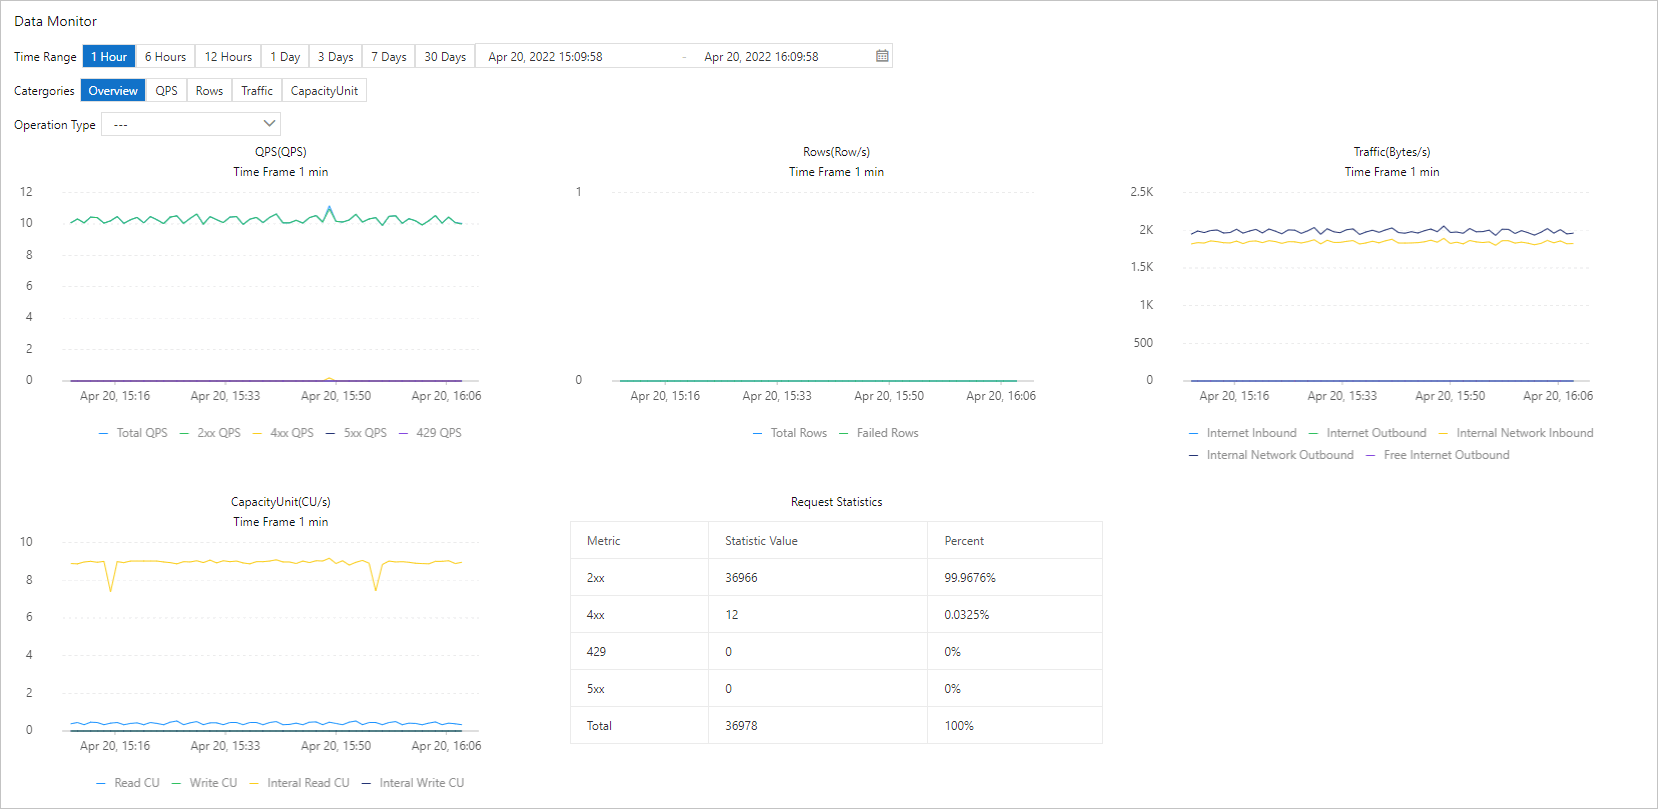
Instance monitoring data
On the Instance Monitoring tab of a Tablestore instance, you can view the monitoring data, such as queries per second (QPS), rows, traffic, and capacity units (CUs), of the instance.
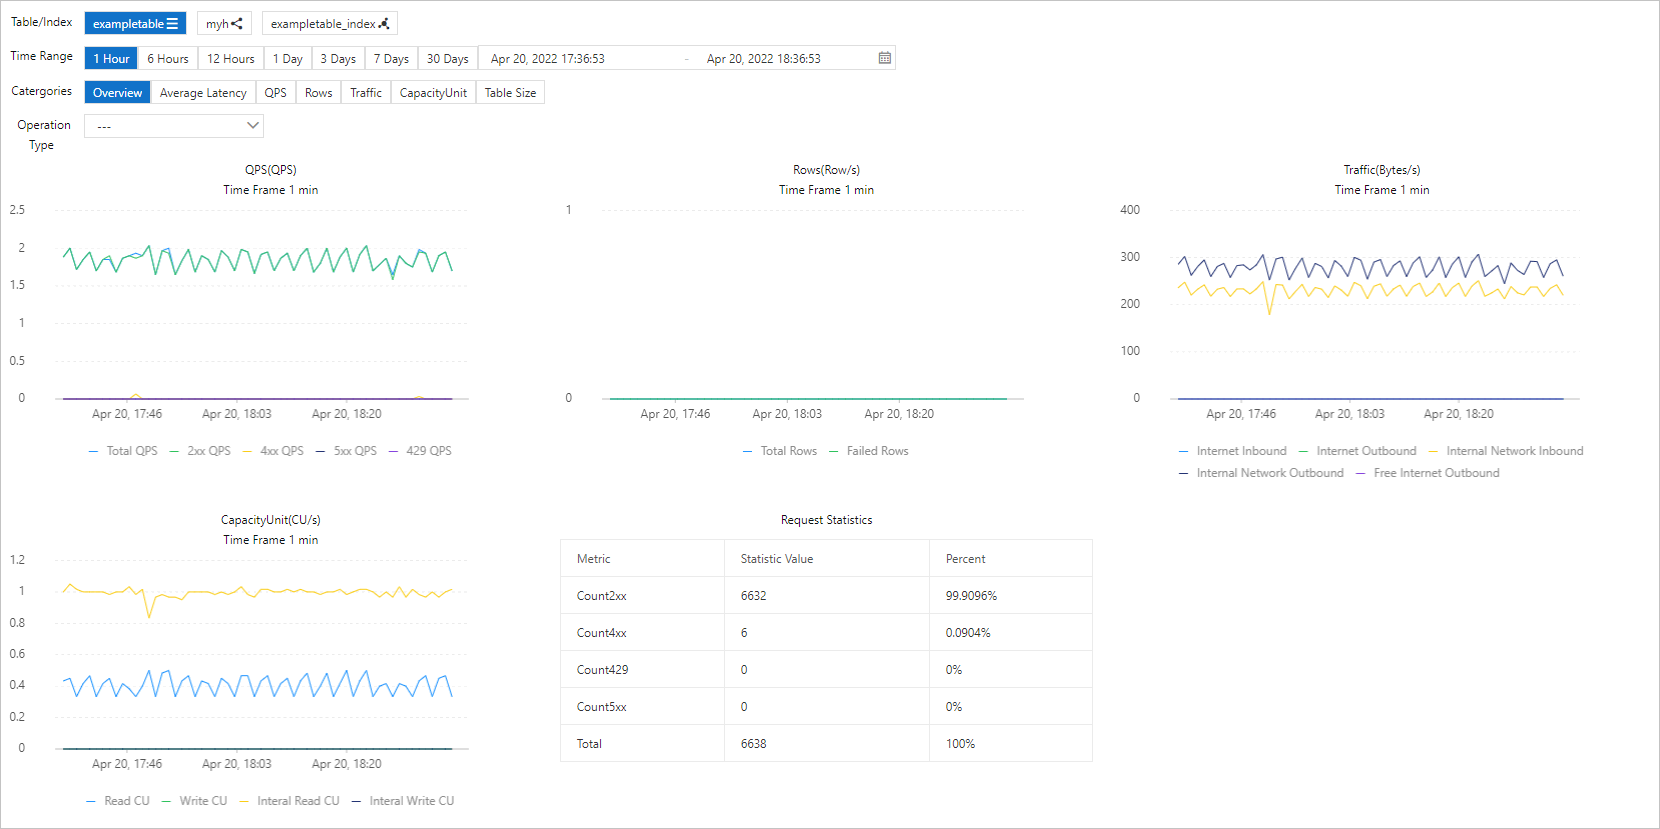
Data table or index monitoring data
On the Monitoring Indicators tab of a data table, you can view the monitoring data, such as the average access latency and QPS, of the data table or a secondary index or search index that is created for the data table.
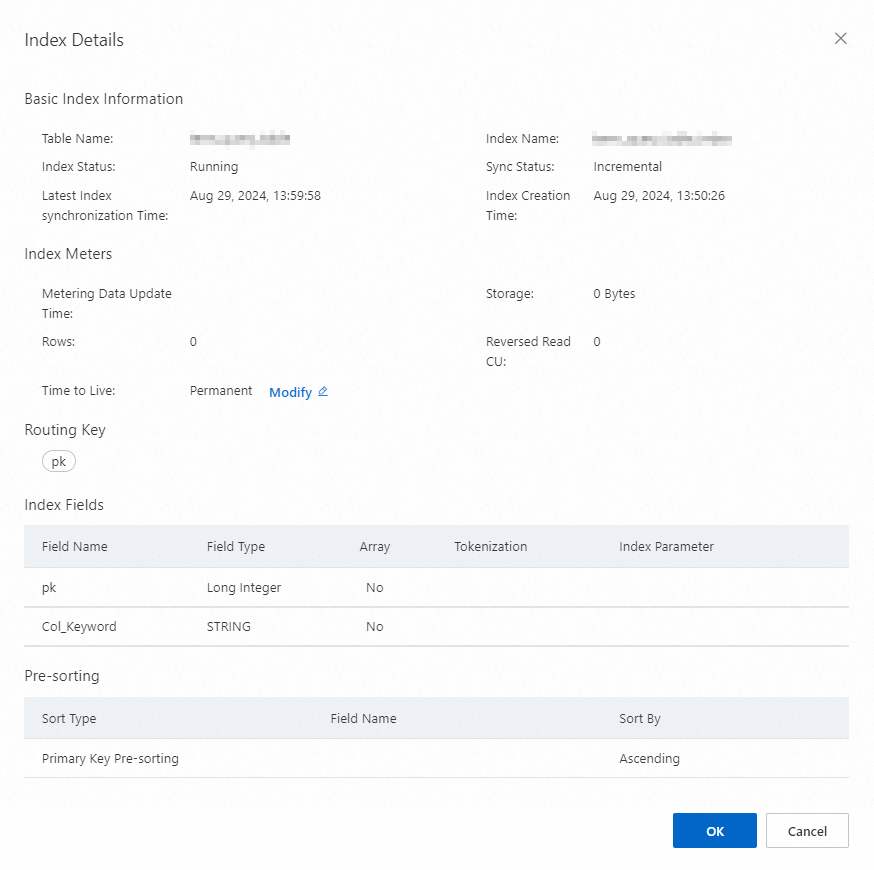
Search index metering data
On the Indexes tab of a data table, find the search index that you want to manage and click Index Details in the Actions column. In the Index Details dialog box, you can view the basic information, index metering information, routing key, index fields, and presorting settings of the search index.
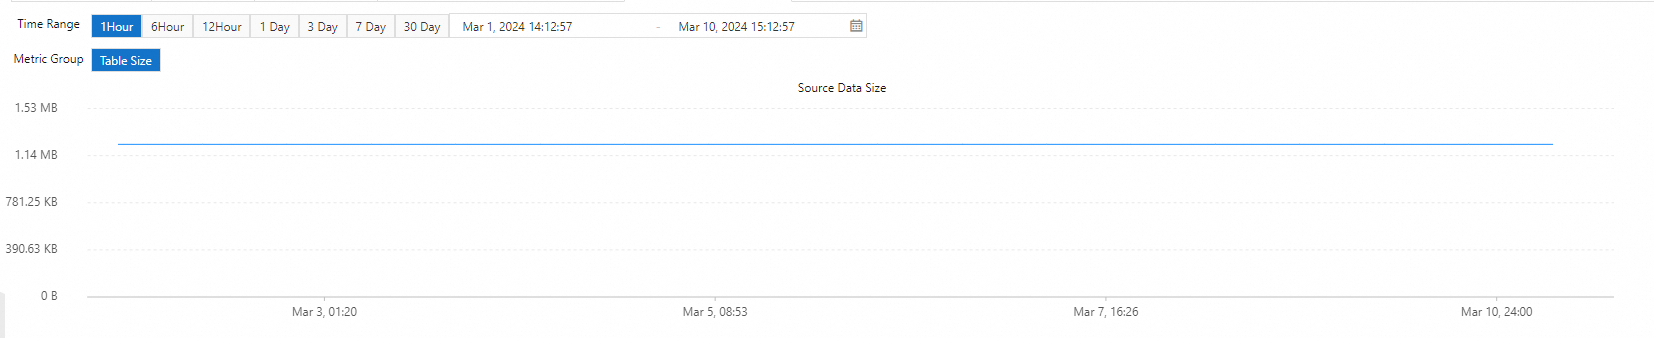
Monitoring data of time series tables
On the Monitoring Indicators tab of a time series table, you can view the table size of the time series table.
Health status monitoring
We recommend that you check the health status of cloud resources in real time. This way, you can handle exceptions at the earliest opportunity. For more information, visit Alibaba Cloud Health Status.
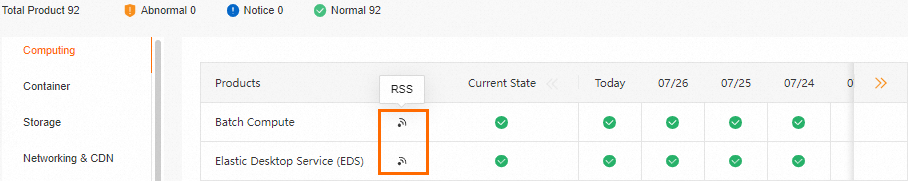
On the Alibaba Cloud Health Status page, you can check the health status of each service in different regions and subscribe to Really Simple Syndication (RSS) feeds about service exceptions.
CloudMonitor Basic
Tablestore is integrated with Alibaba CloudMonitor. You can use CloudMonitor to monitor the metrics of cloud resources and Internet applications in real time free of charge. You can use CloudMonitor to monitor the running status, usage, and exceptions of resources of cloud services in real time.
You can go to the CloudMonitor console or call CloudMonitor API operations to view the monitoring data of Tablestore resources. For more information, see View monitoring data by using the CloudMonitor console and CloudMonitor SDKs.
View monitoring data in the CloudMonitor console
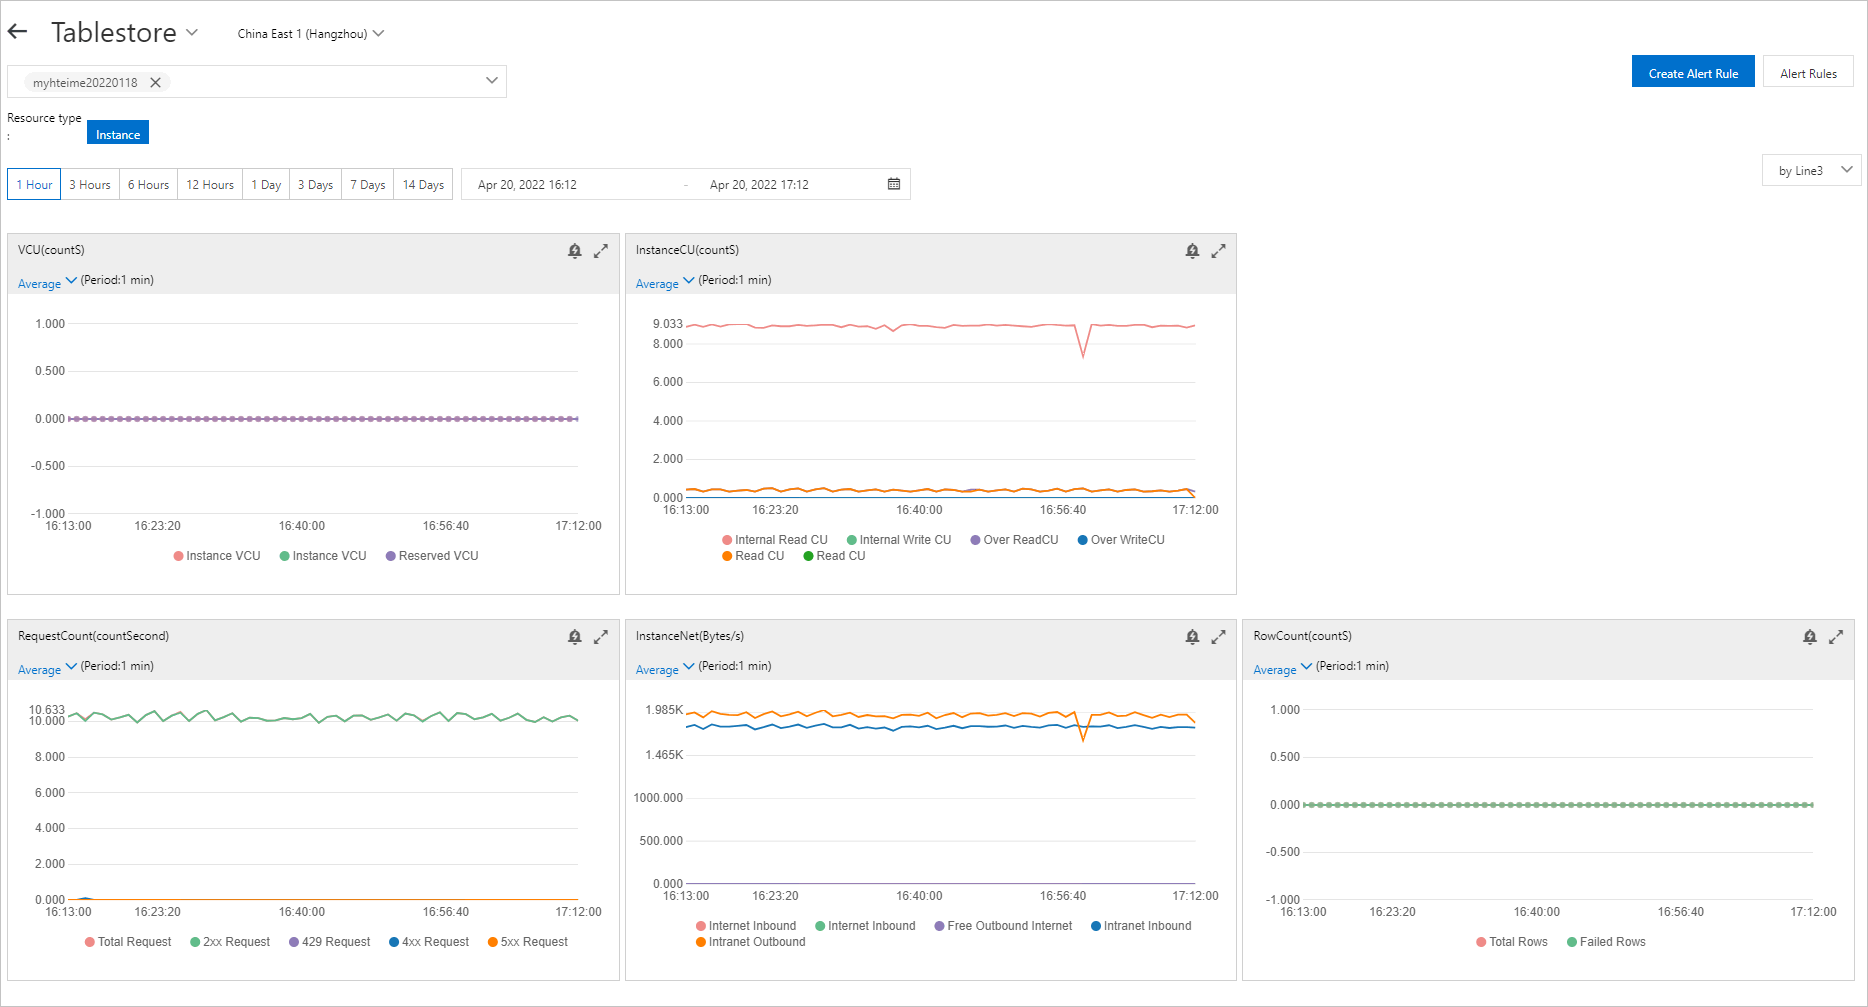
You can view the monitoring data of Tablestore instances in the CloudMonitor console. On the Cloud Service Monitoring page of the CloudMonitor console, choose to view the monitoring data of Tablestore instances, such as VCUs, CUs, requests, and traffic.
View monitoring data by using CloudMonitor SDKs
You can call CloudMonitor API operations to view the monitoring data of Tablestore instances or tables. You can use OpenAPI Explorer to call the DescribeMetricList operation of CloudMonitor to view the monitoring data of Tablestore instances, such as CUs, read CUs, and the number of requests that return status code 2xx, or the monitoring data of Tablestore data tables or secondary indexes, such as the average access latency, number of requests that return status code 2xx, and read CUs.
You can configure alert rules for metrics in the CloudMonitor console. If the conditions that are specified in an alert rule are met, CloudMonitor automatically notifies you of anomalies in the monitoring data. This way, you can troubleshoot errors at the earliest opportunity. For more information, see Configure alert rules for monitoring metrics.
ActionTrail
Tablestore is integrated with ActionTrail. You can use ActionTrail to monitor and record the operations performed by Alibaba Cloud accounts. In addition, ActionTrail can analyze security risks, detect intrusions, track changes, and perform compliance auditing.
ActionTrail can record the logs related to the access to and usage of cloud services in the Alibaba Cloud Management Console, by calling API operations, or by using SDKs. For more information, see Audit events of Tablestore.
By default, ActionTrail tracks and retains events in the previous 90 days. If you want to retain events for an extended period of time, create a trail that delivers events to a Simple Log Service Logstore or an Object Storage Service (OSS) bucket. For more information, see Step 1: Create a trail.
After you create a trail to deliver events to a Simple Log Service Logstore or an OSS bucket, you can query or analyze the events in the Simple Log Service or OSS console. For more information, see Query events in the Simple Log Service or OSS console.
If you want to trace a historical event, submit a ticket to request for the required permissions.
Simple Log Service
Tablestore is integrated with Simple Log Service. You can enable the audit log feature on the Audit Log page. Then, you can use Simple Log Service to collect and process the logs of Tablestore, such as operation information, running status, and business status. You can also analyze logs in real time and deliver logs to monitor and audit the logs in real time. For information about how to enable the audit log feature, see Enable the audit log feature. The audit log feature can be used in scenarios such as security audits, compliance audits, and troubleshooting. By default, you can retain Tablestore logs for up to seven days. You can change the retention period based on your business requirements. For more information, see Modify the configurations of a Logstore.
Query and analyze audit logs
When you perform operations on resources in a Tablestore instance, the system automatically collects audit logs and creates indexes. On the Audit Log page, you can query and analyze the collected logs in real time. For more information, see Query and analyze audit logs.
You can view the information about the audit logs, such as the query result histogram, raw logs, charts, and log clustering information.
View the query result histogram
The query result histogram displays the distribution of queried logs based on points in time. Click the green rectangle to view a more fine-grained log distribution. You can also view the query results within the specified time range on the Raw Logs tab.
Query raw logs
On the Raw Logs tab, you can view query results. Click Table or Raw Data to view the log data. For more information, see Query raw logs.
View charts
After you execute a query statement, you can view the charts that display the query and analysis results on the Graph tab. For more information, see View charts.
Use the LogReduce feature
On the LogReduce tab, click Enable LogReduce to cluster log data with high similarity during log collection. For more information, see Use the LogReduce feature.
Configure alert monitoring rules for logs
After you create an alert monitoring rule for logs, the system generates alerts based on a specific check frequency and trigger conditions. The system also reduces alert noises and sends alert notifications based on a specific alert policy and action policy. You can create an alert monitoring rule for logs to monitor tables or indexes that cannot be deleted in Tablestore. For more information, see Create an alert monitoring rule for logs.