Preview and debug MiniApps using Visual Studio Code (VS Code) or the VS Code extension for WindVane on an Android or iOS simulator.
Use VS Code if you do not need to debug WindVane JavaScript APIs.
Use the VS Code extension for WindVane on an Android or iOS simulator if you need to debug WindVane JavaScript APIs.
Preview a MiniApp in VS Code
Click Preview MiniApp in VS Code. A prompt asks whether
npm starthas been run. Select the option that matches the current state of your MiniApp.-
Option 1: Yes (The MiniApp can be previewed.)
The MiniApp service is already running locally. Preview it directly via a URL.
Select 「Yes (The MiniApp can be previewed.)」.
A text input box appears at the top of VS Code.
Enter the preview URL (for example,
http://localhost:3000).The plugin opens the browser and displays the preview.
Option 2: No (The MiniApp must be started first.)
The MiniApp is not running. The plugin starts it by running
npm start.Select 「No (The MiniApp must be started first.)」.
The WindVane MiniApp plugin runs
npm startin the terminal.After the service starts, a text input box appears at the top of VS Code.
Enter the URL shown in the
npm startlog output.The plugin opens the browser and loads the preview page.
1. Startup command
The application is started using
npm startby default.To use a different startup command (for example,
npm run dev), go to Settings, search for SuperApp: Start Command, and set your custom command.
2. Local server
When the service starts, Node.js creates a local server that makes the MiniApp accessible in a browser.
3. Preview URL
-
The preview URL is the local server address, in one of these formats:
http://localhost:<port>http://<local-IP>:<port>
4. Port information (scaffolding example)
MiniApps initialized with the plugin scaffolding use port
3000by default.-
Preview the app at
http://<local-IP>:3000after startup.If port
3000is already in use, npm prompts you to switch to another port (for example,3001). If you confirm, the preview URL changes tohttp://<local-IP>:3001.
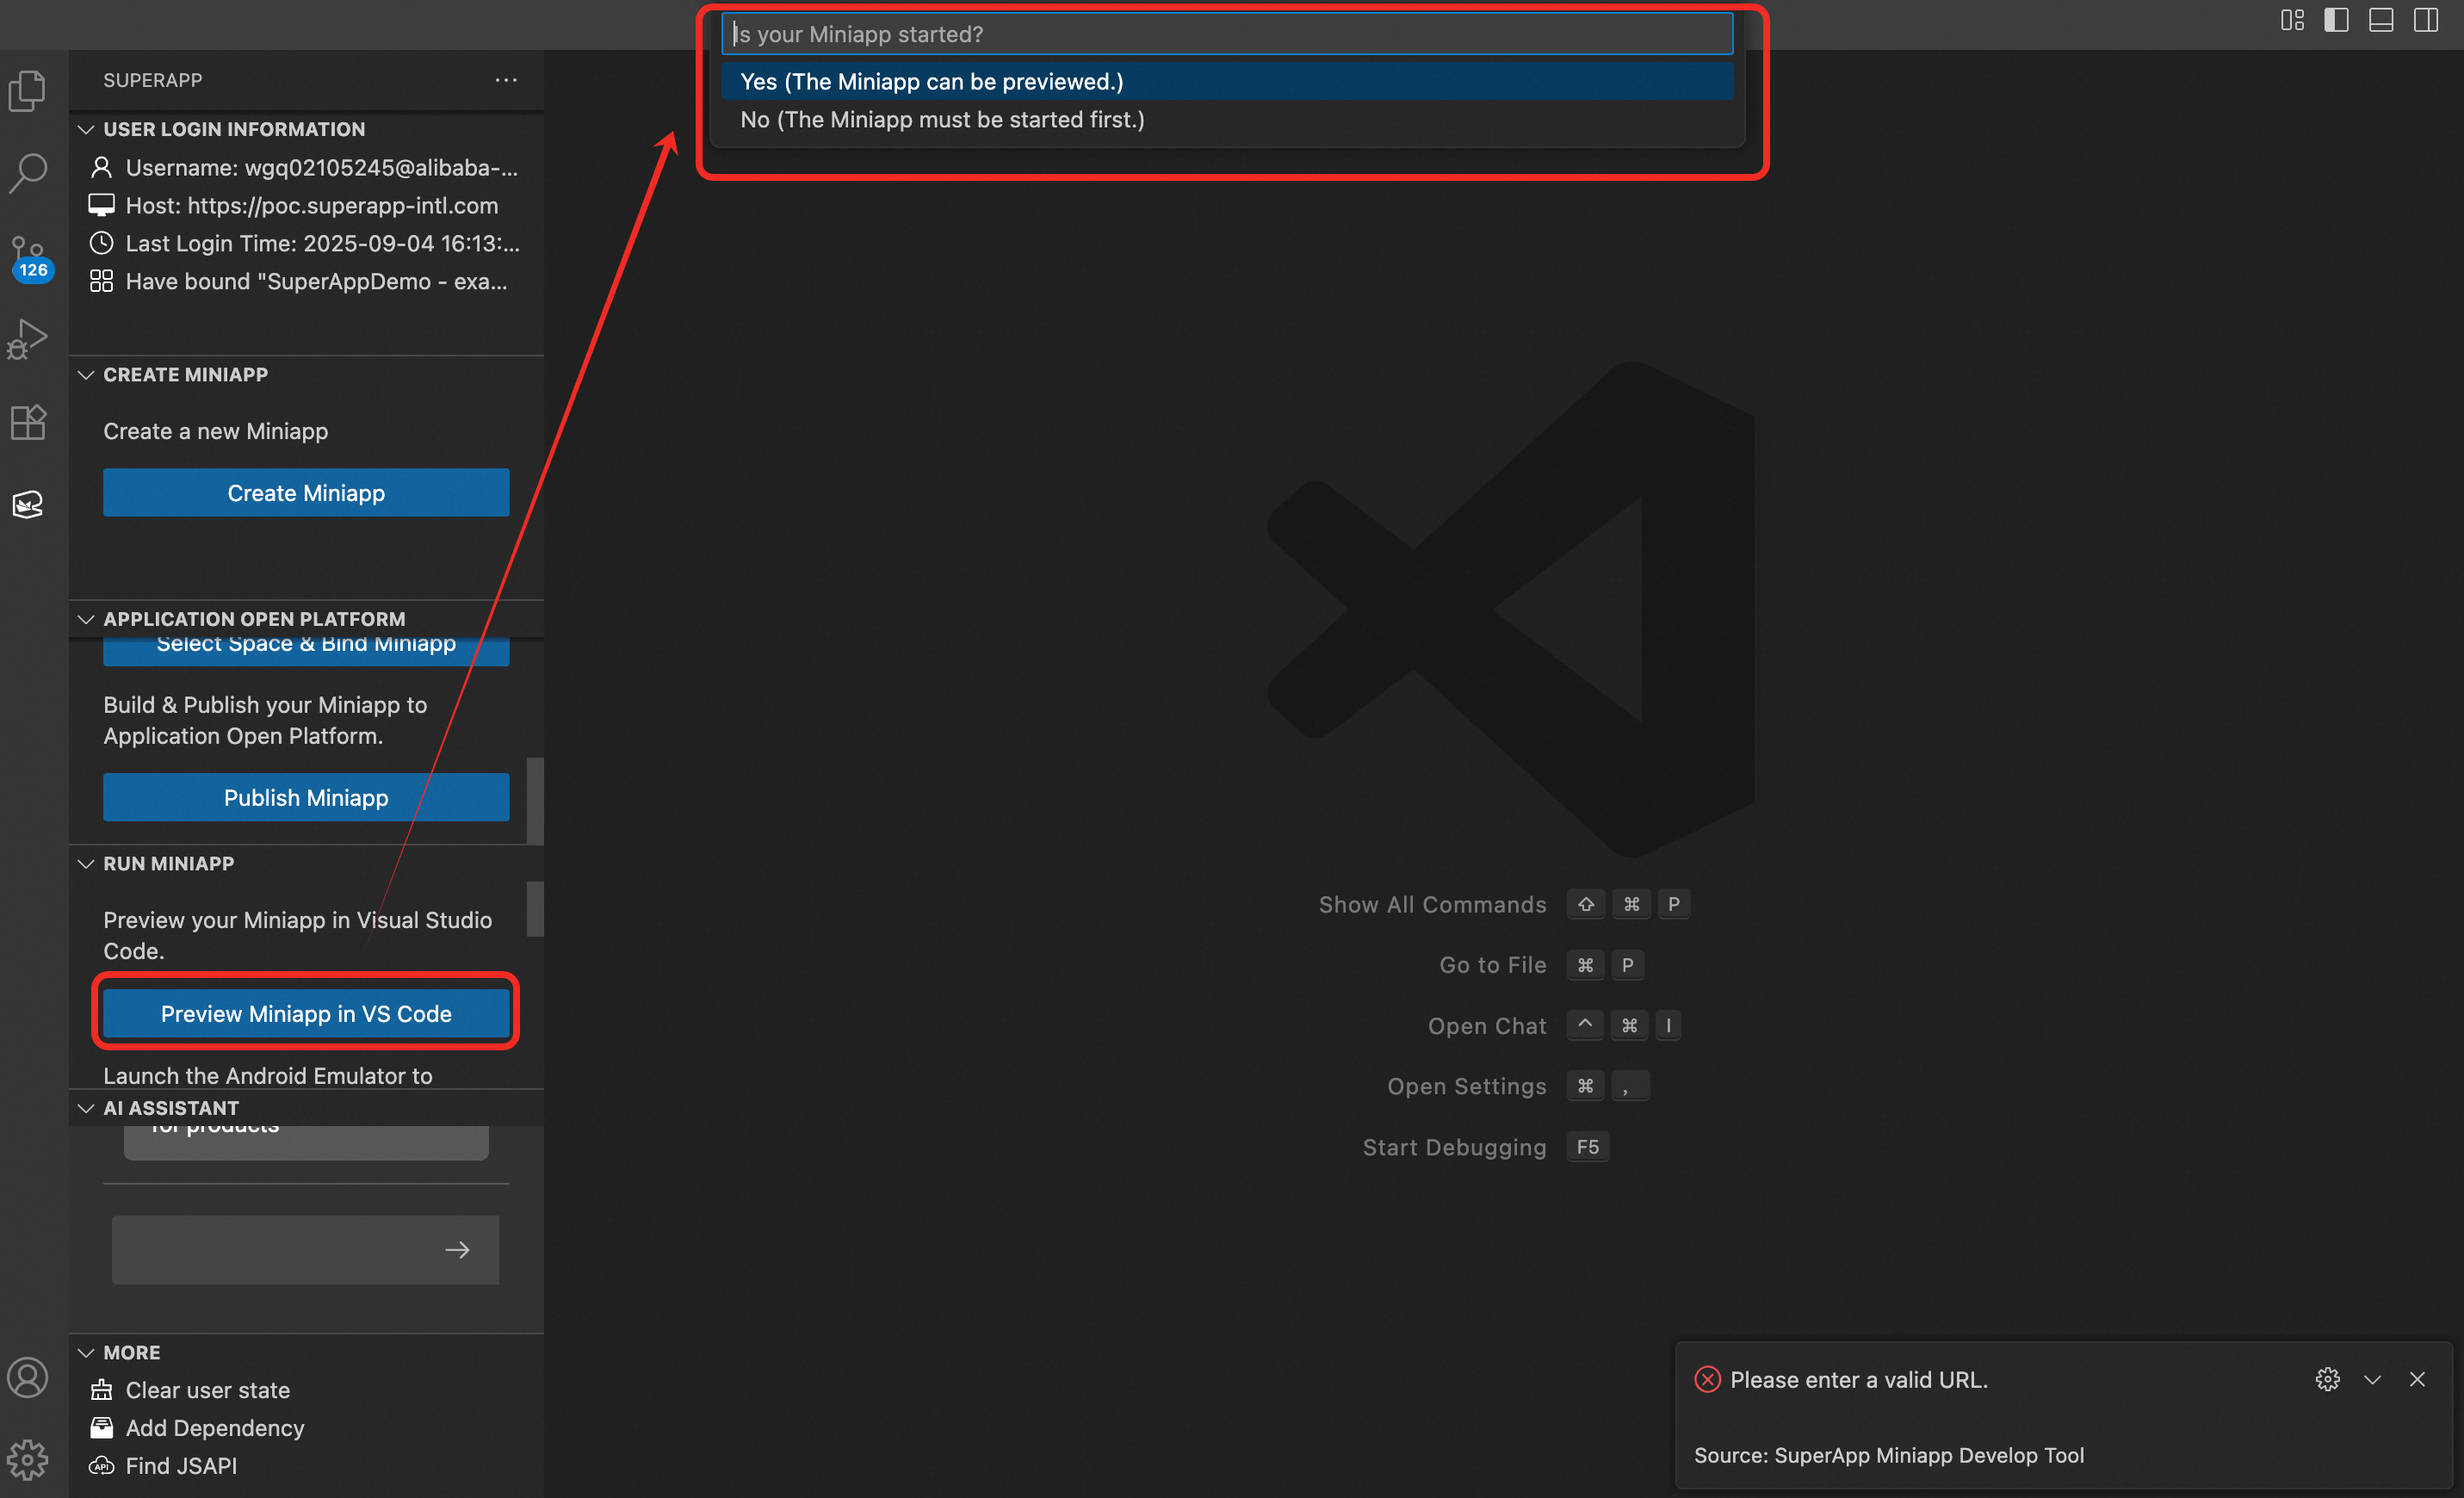
Enter the URL: 
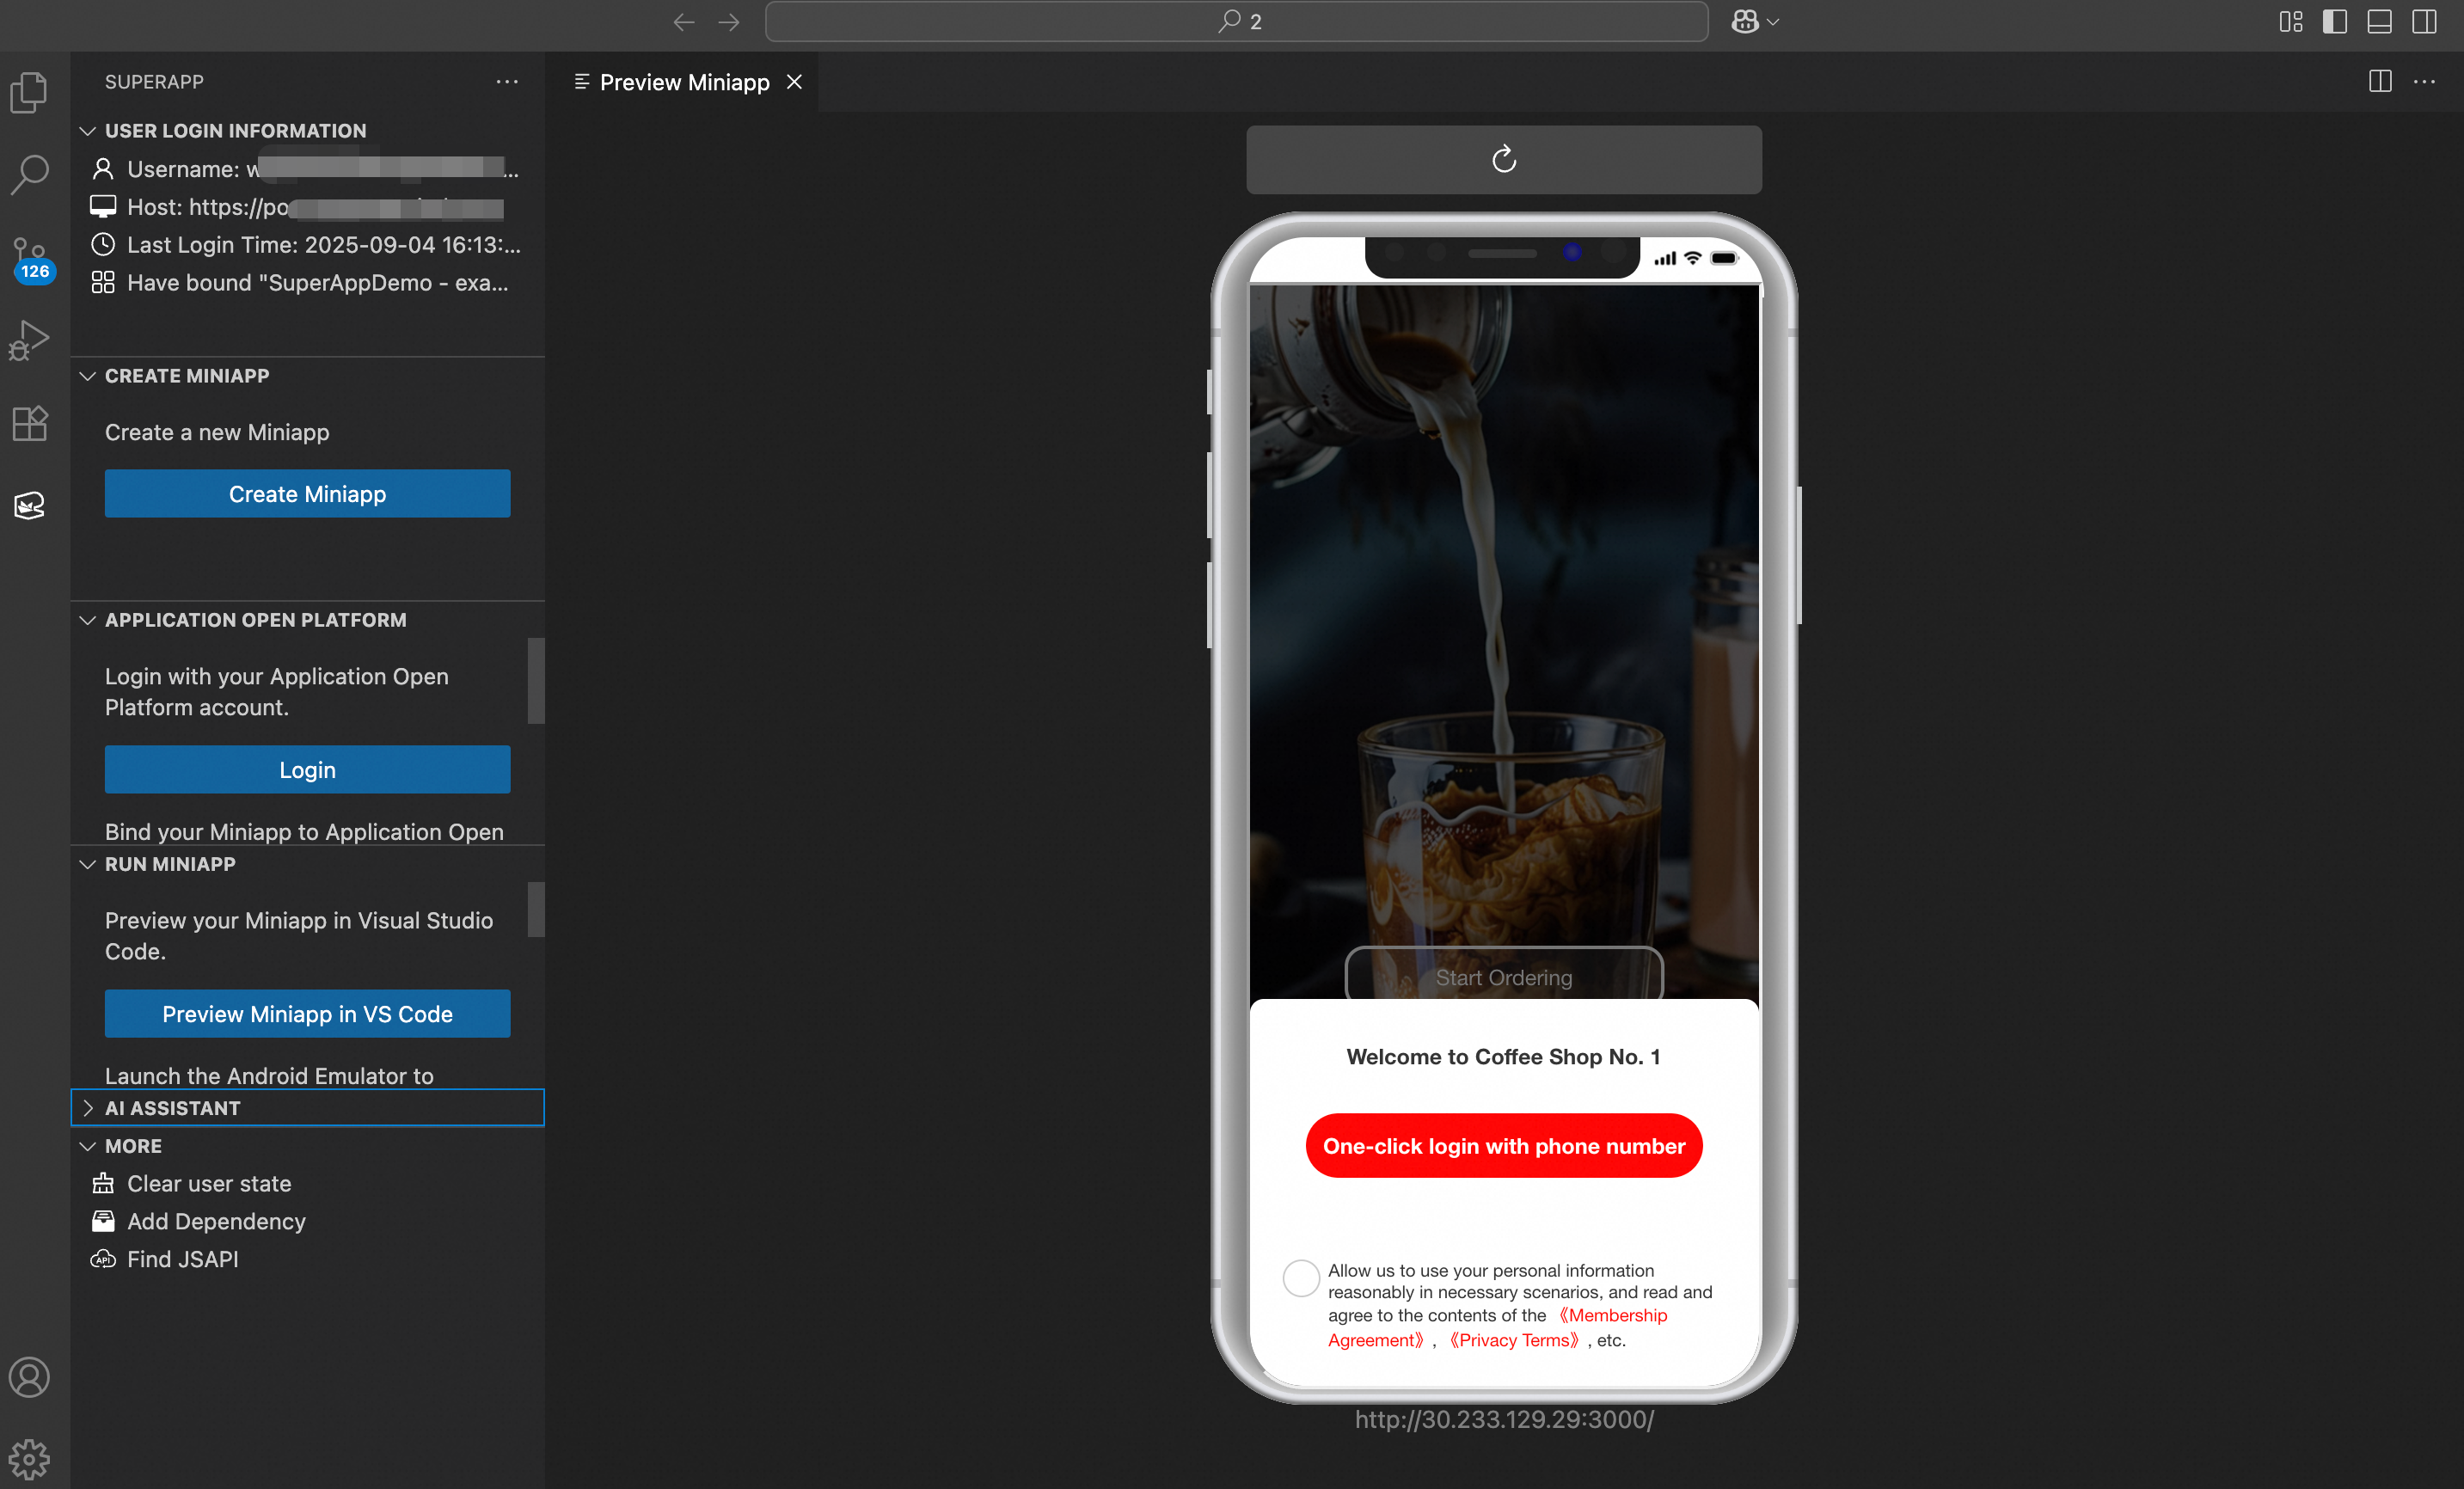
Successful preview:
Run the
Developer: Toggle Developer Toolscommand to open the debugging console and debug the MiniApp in VS Code.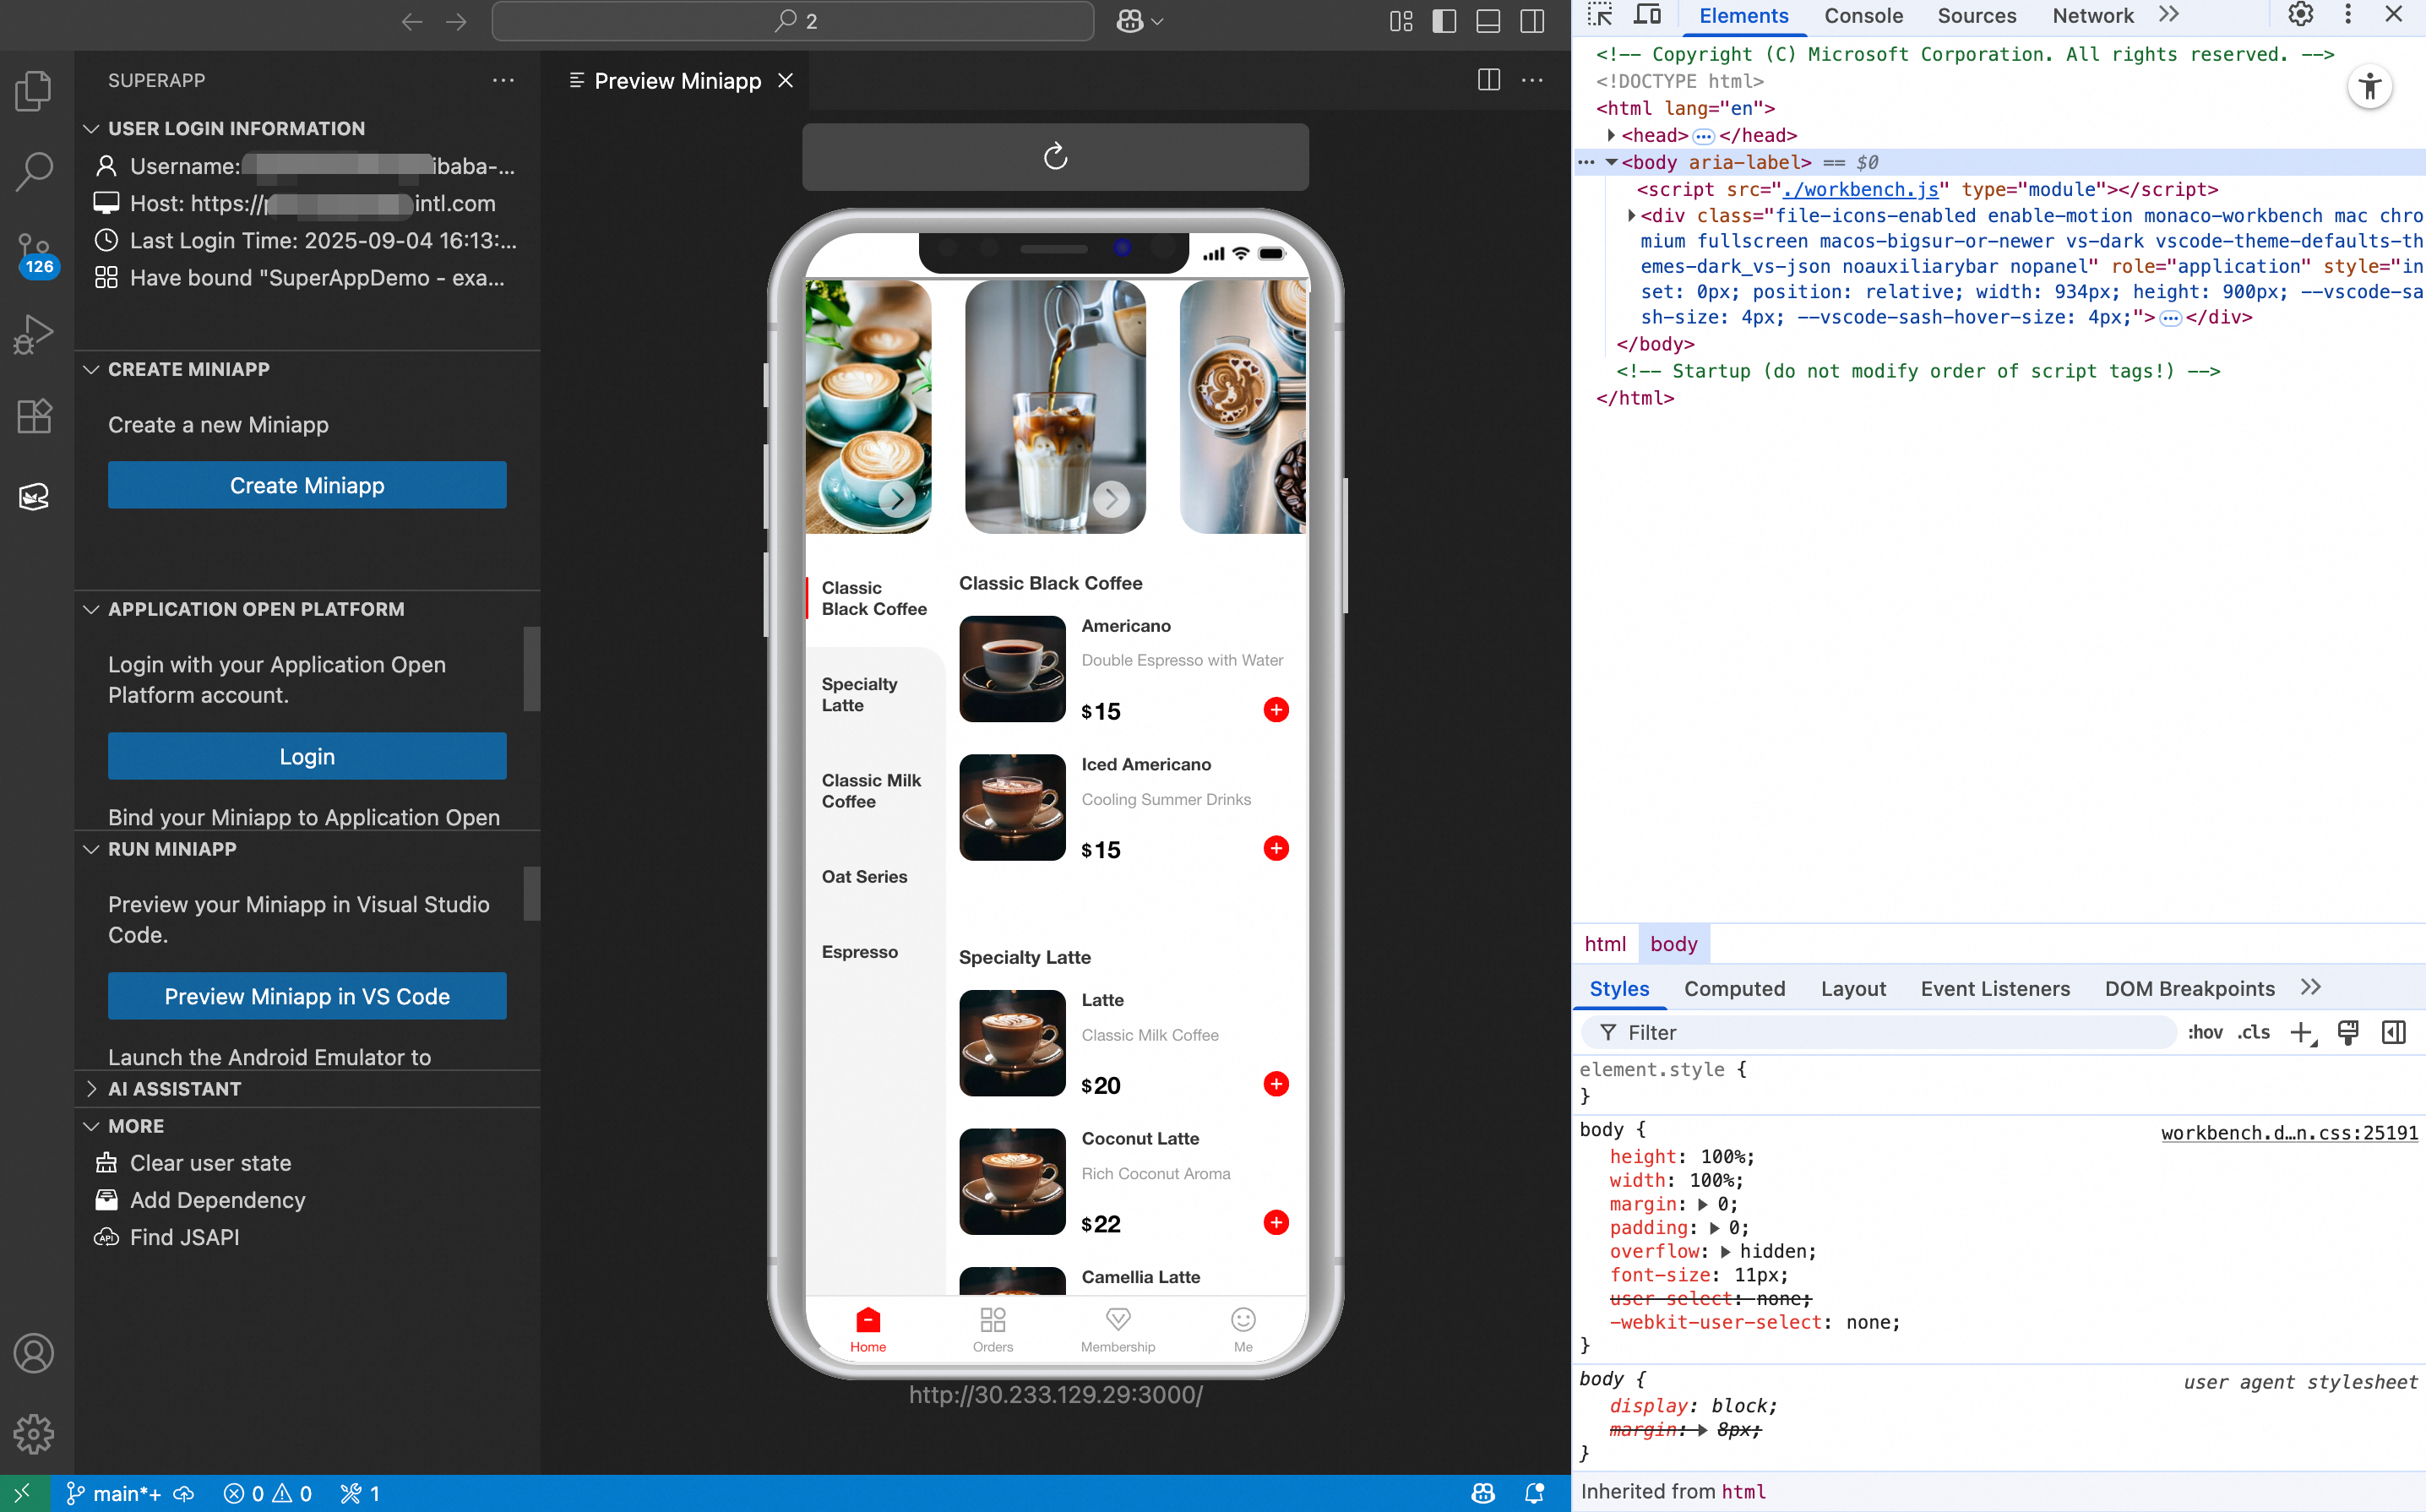
Preview and debug MiniApps on a simulator
After you preview a MiniApp on a simulator for the first time, the debug app is installed. Subsequent previews do not reinstall it. If you encounter JSAPI call exceptions, the simulator may be running an outdated debug app. Manually uninstall the debug app from the simulator and preview again to get the latest version.
Android emulator
-
Click Preview MiniApp in Android Emulator to start the Android emulator.
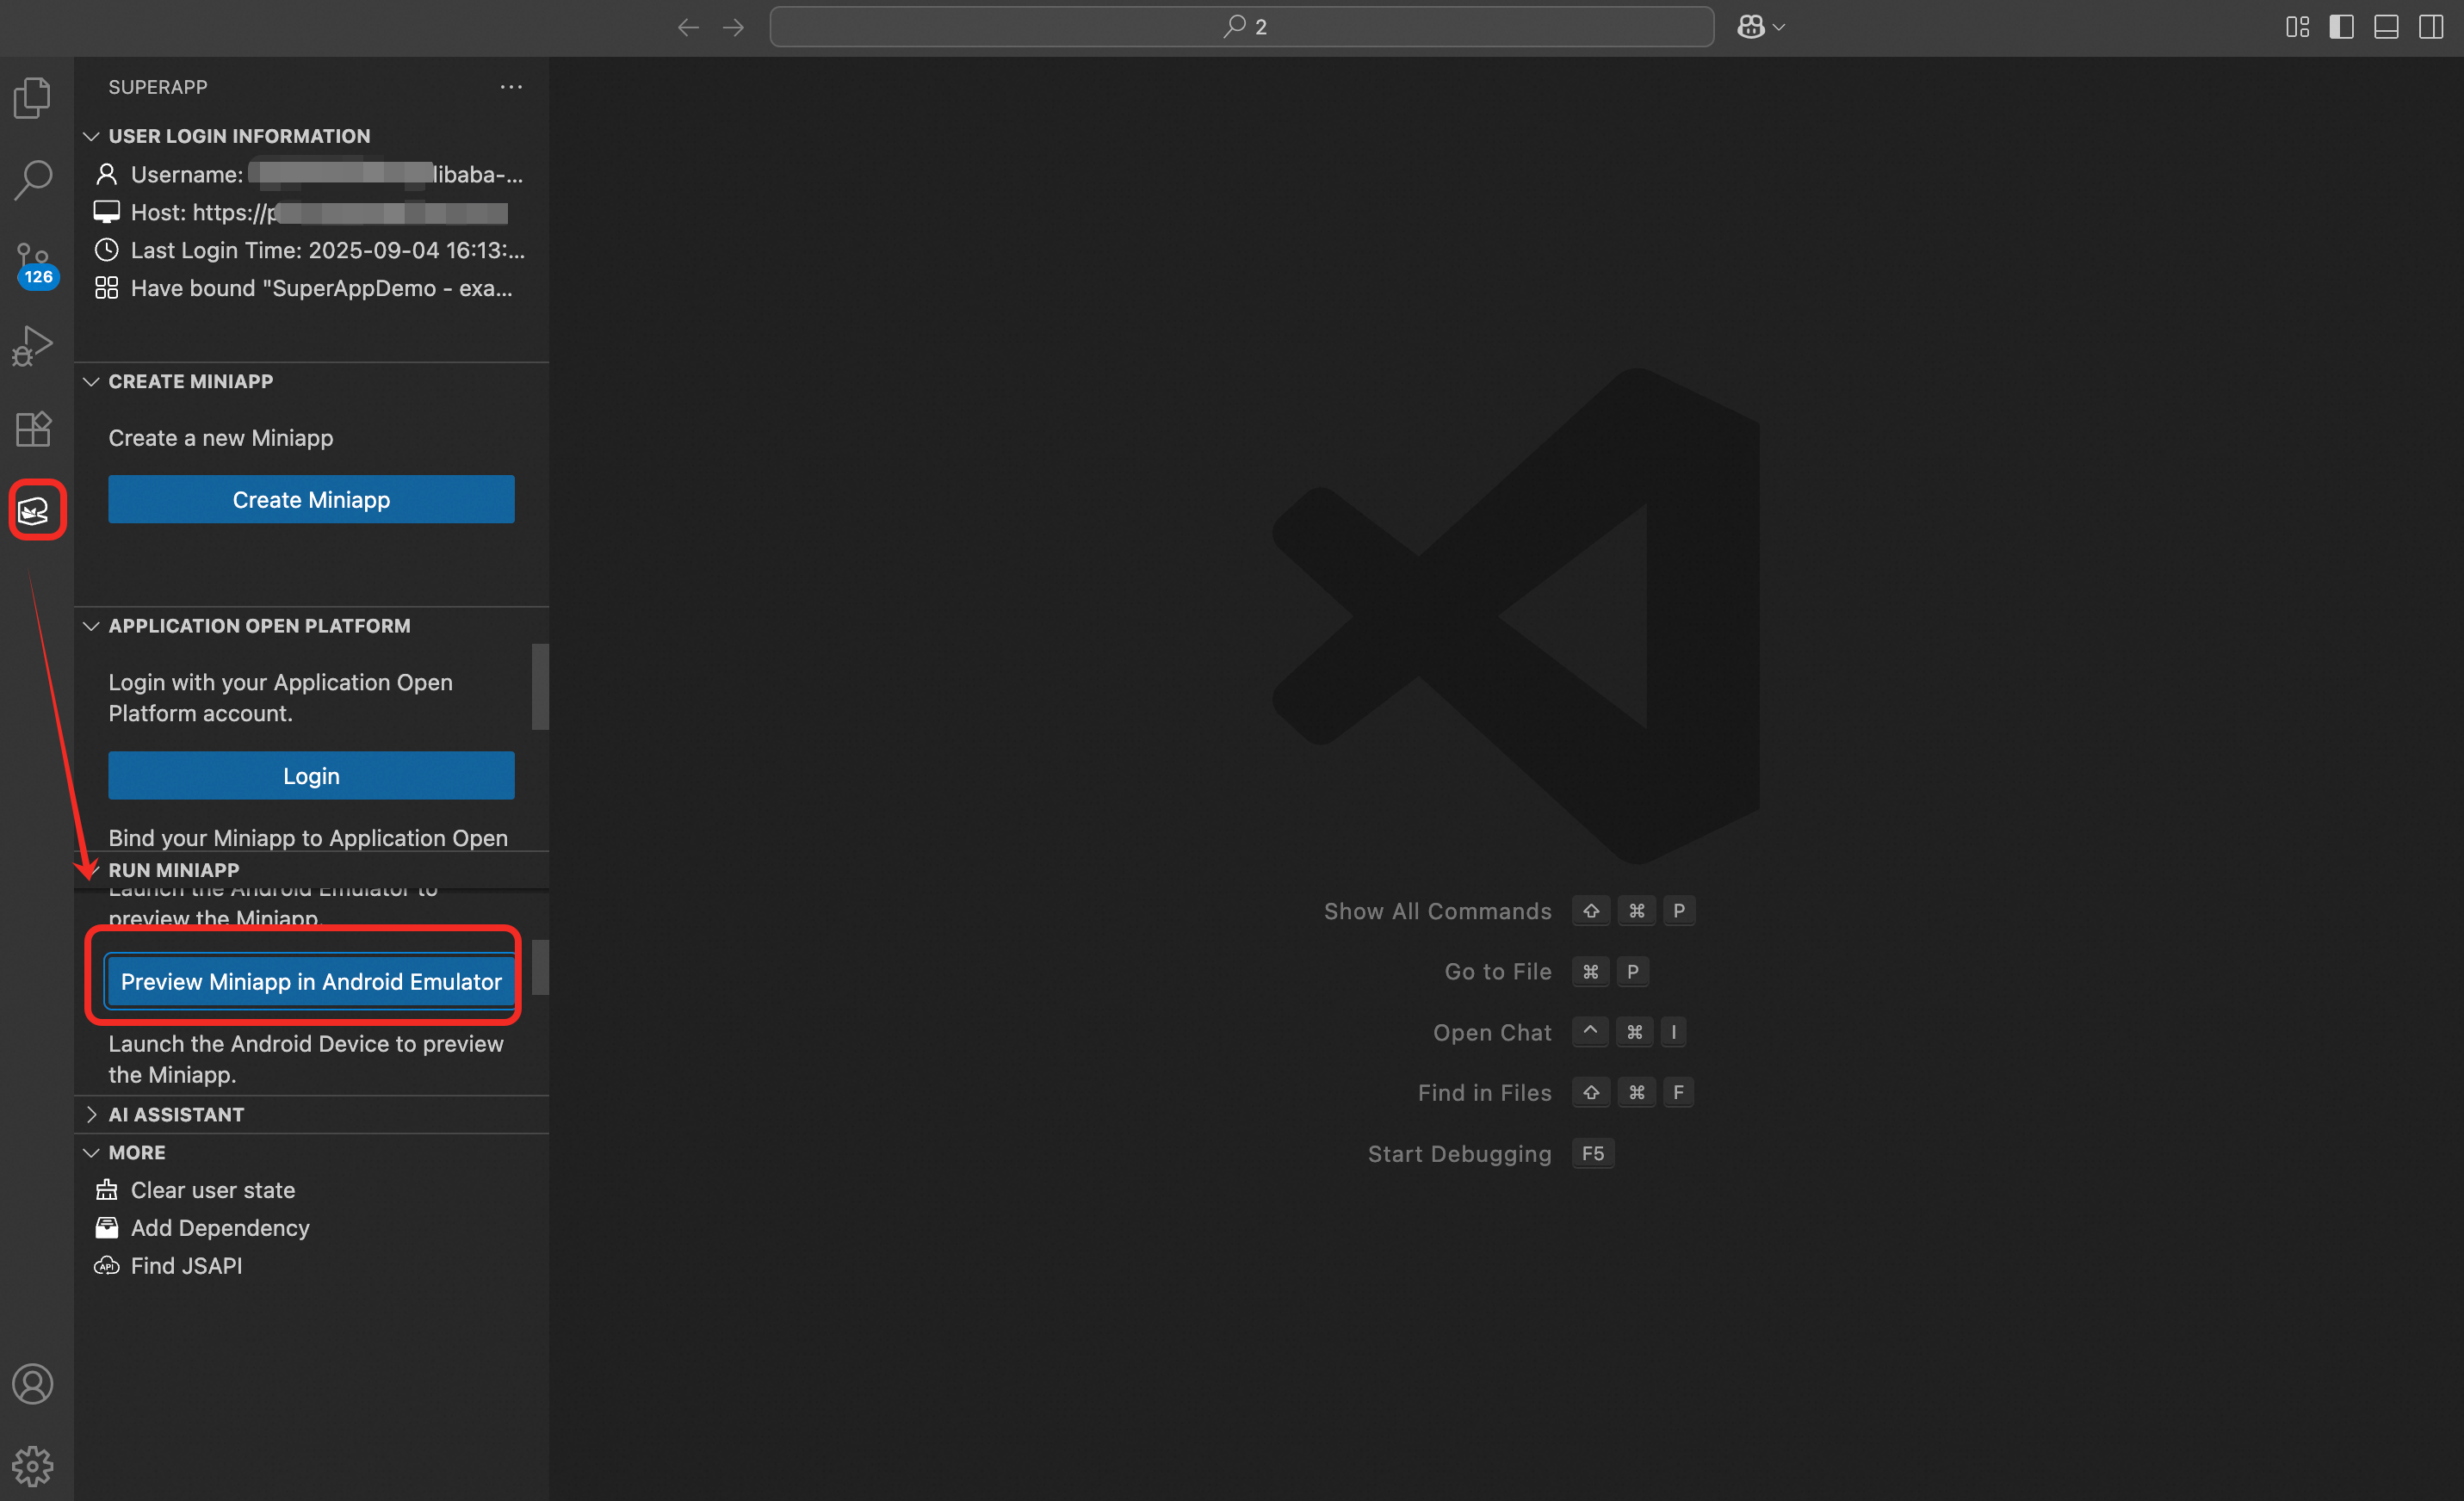
-
After the emulator starts, a text box appears at the top of VS Code. Enter the preview URL of your MiniApp.
NoteThe MiniApp must be running before you can preview it on an emulator. If you do not have the URL, the MiniApp may not be started. To start it, click Preview MiniApp and select No(The MiniApp must be started first.'npm start' or start command will be called). Alternatively, run npm start in the CLI on your local device.
The preview URL is in the
http://localhost:<Port number>orhttp://<IP address of your local device>:<Port number>format. For example, if you initialized the project using the WindVane scaffolding template, the URL ishttp://<IP address of your local device>:3000.
-
After you enter the URL, the emulator starts the scaffolding and loads the MiniApp.
Open Chrome and go to
chrome://inspect/#devices. The emulator information and theWebViewobject appear after the scaffolding starts.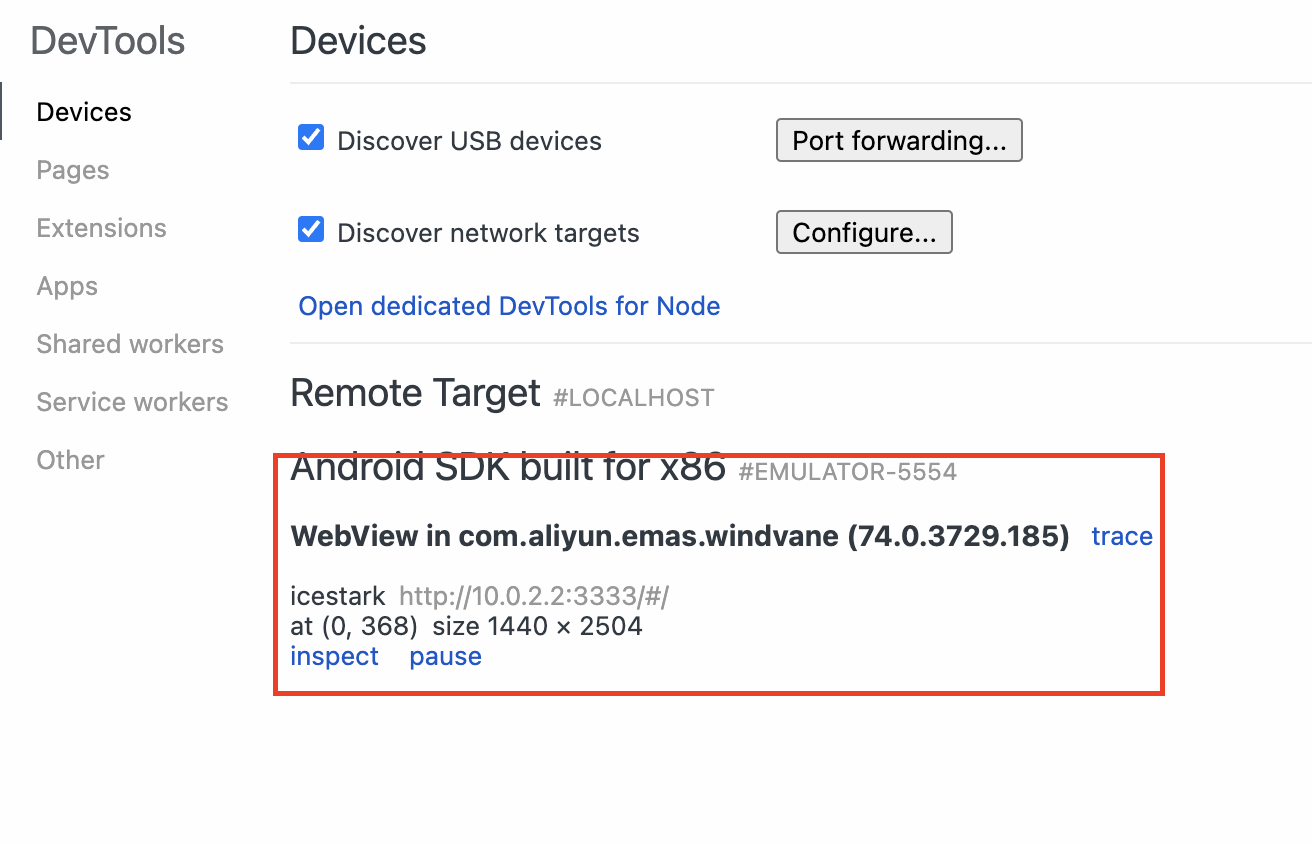
-
Click
inspectbelow the emulator information in DevTools to debug the MiniApp in the WebView object.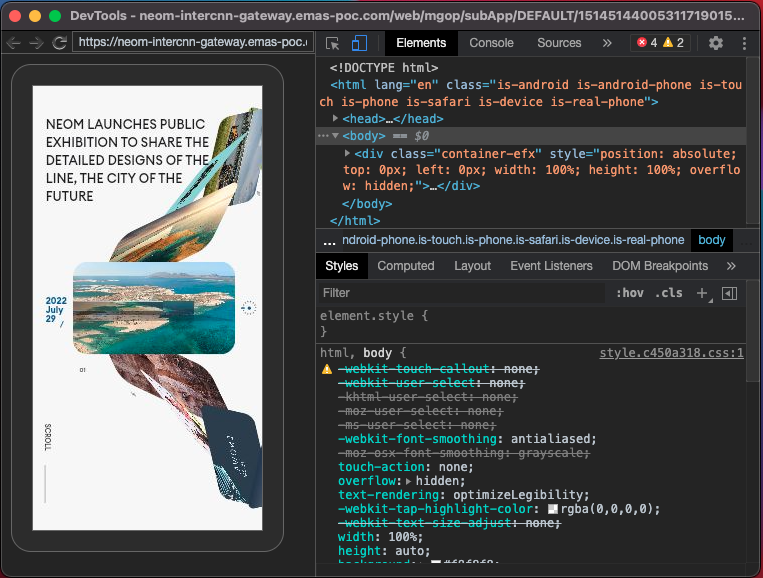
iOS simulator
-
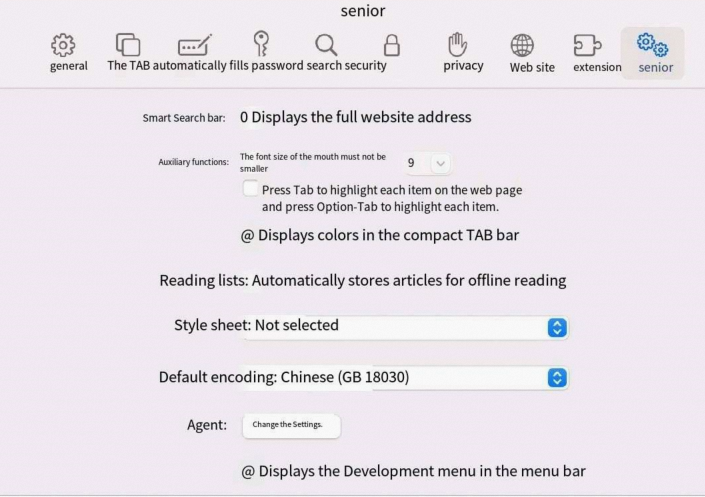
In Safari, choose Safari > Preferences > Advanced, and select Show Develop menu in menu bar to enable Safari developer tools.
Click Preview MiniApp in iOS Emulator to start the iOS simulator. If multiple simulators are available on your local device, select one from the drop-down list. You must specify a simulator for the VS Code extension for WindVane to start the simulator.
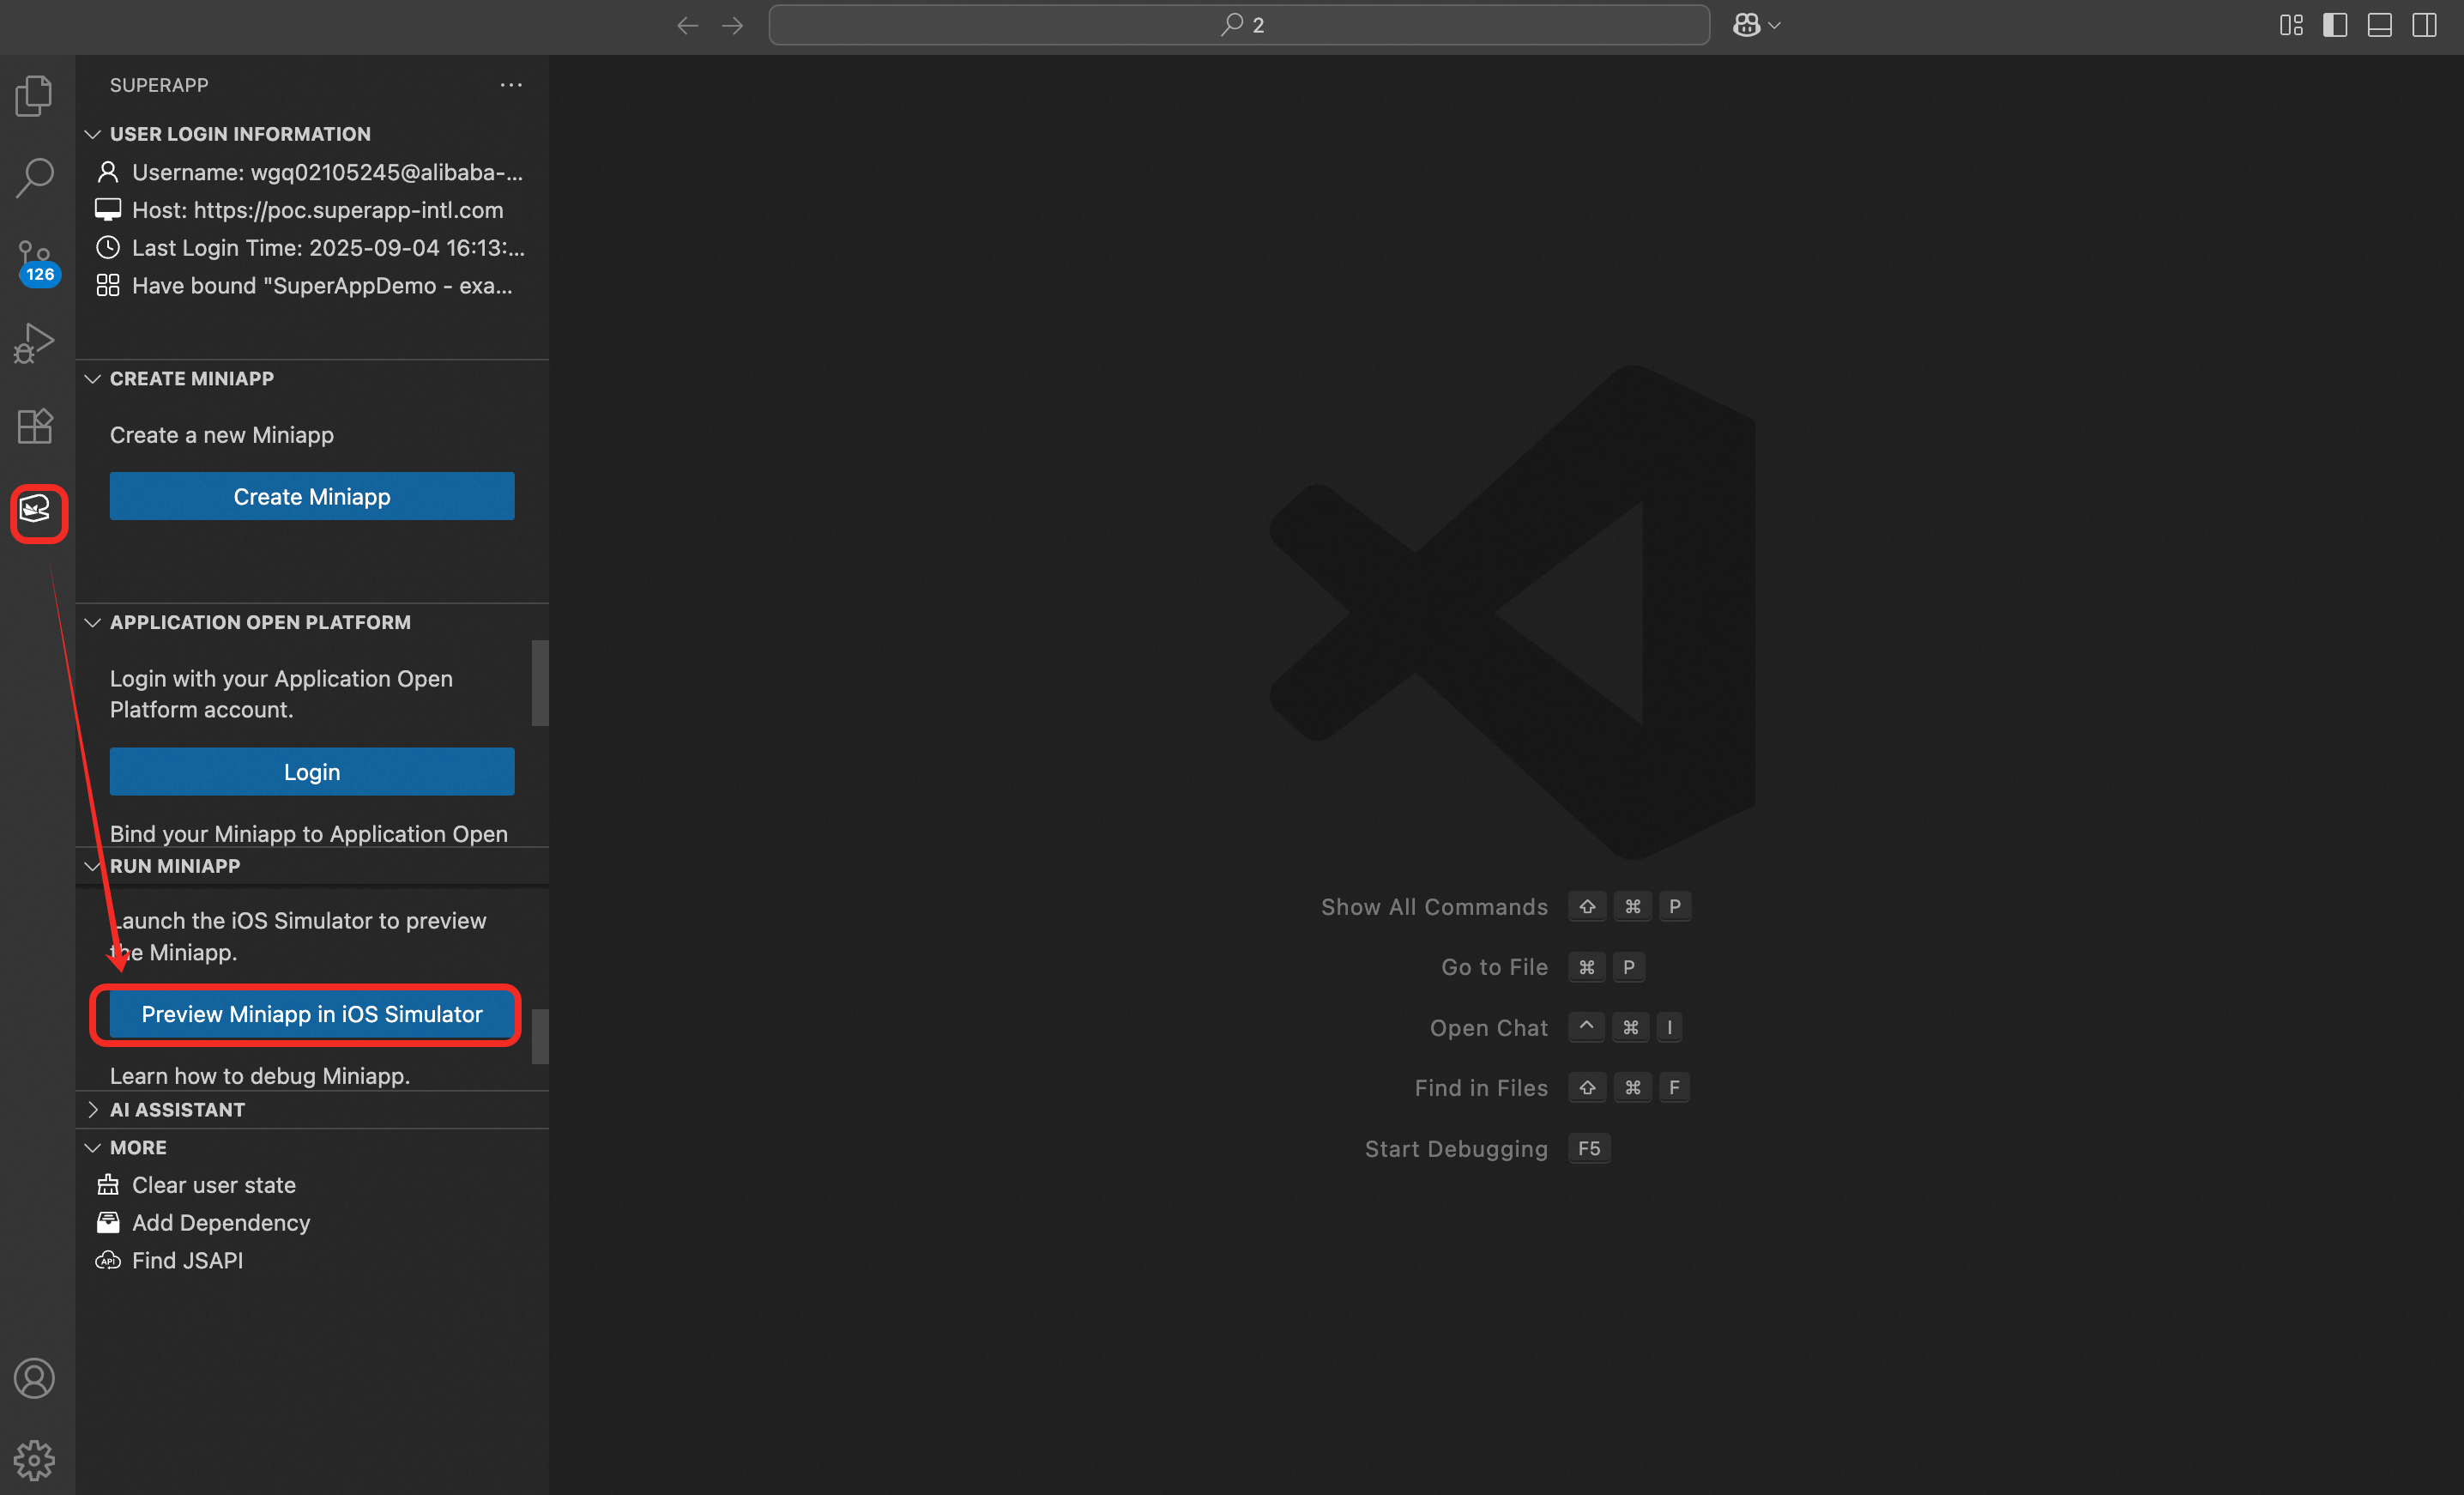
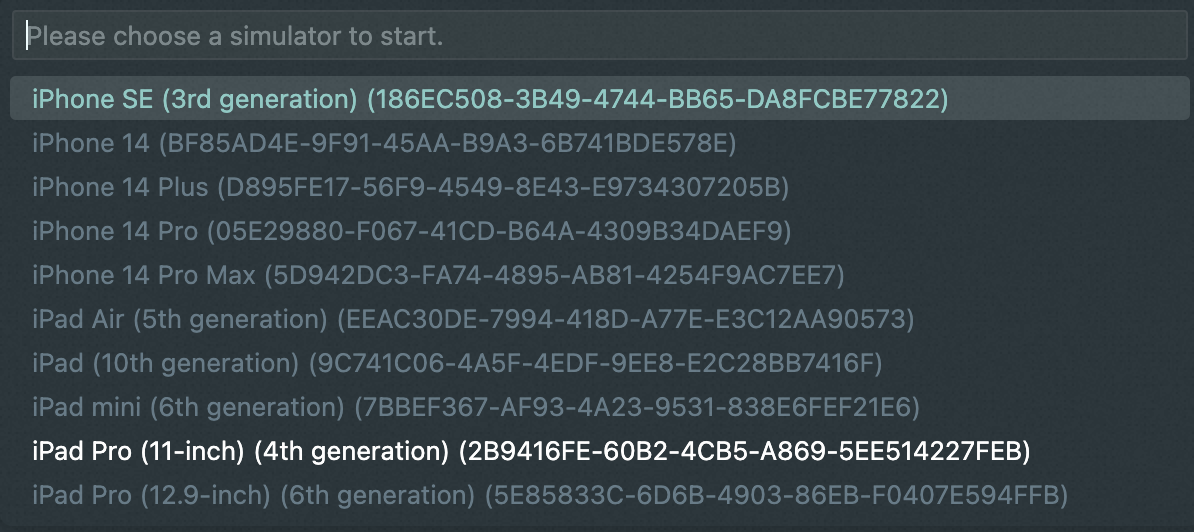
-
After the simulator starts, a text box appears at the top of VS Code. Enter the preview URL of your MiniApp.
NoteThe MiniApp must be running before you can preview it on a simulator. If you do not have the URL, the MiniApp may not be started. To start it, click Preview MiniApp and select No(The MiniApp must be started first.'npm start' or start command will be called). Alternatively, run npm start in the CLI on your local device.
The preview URL is in the
http://localhost:<Port number>orhttp://<IP address of your local device>:<Port number>format. For example, if you initialized the project using the WindVane scaffolding template, the URL ishttp://<IP address of your local device>:3000.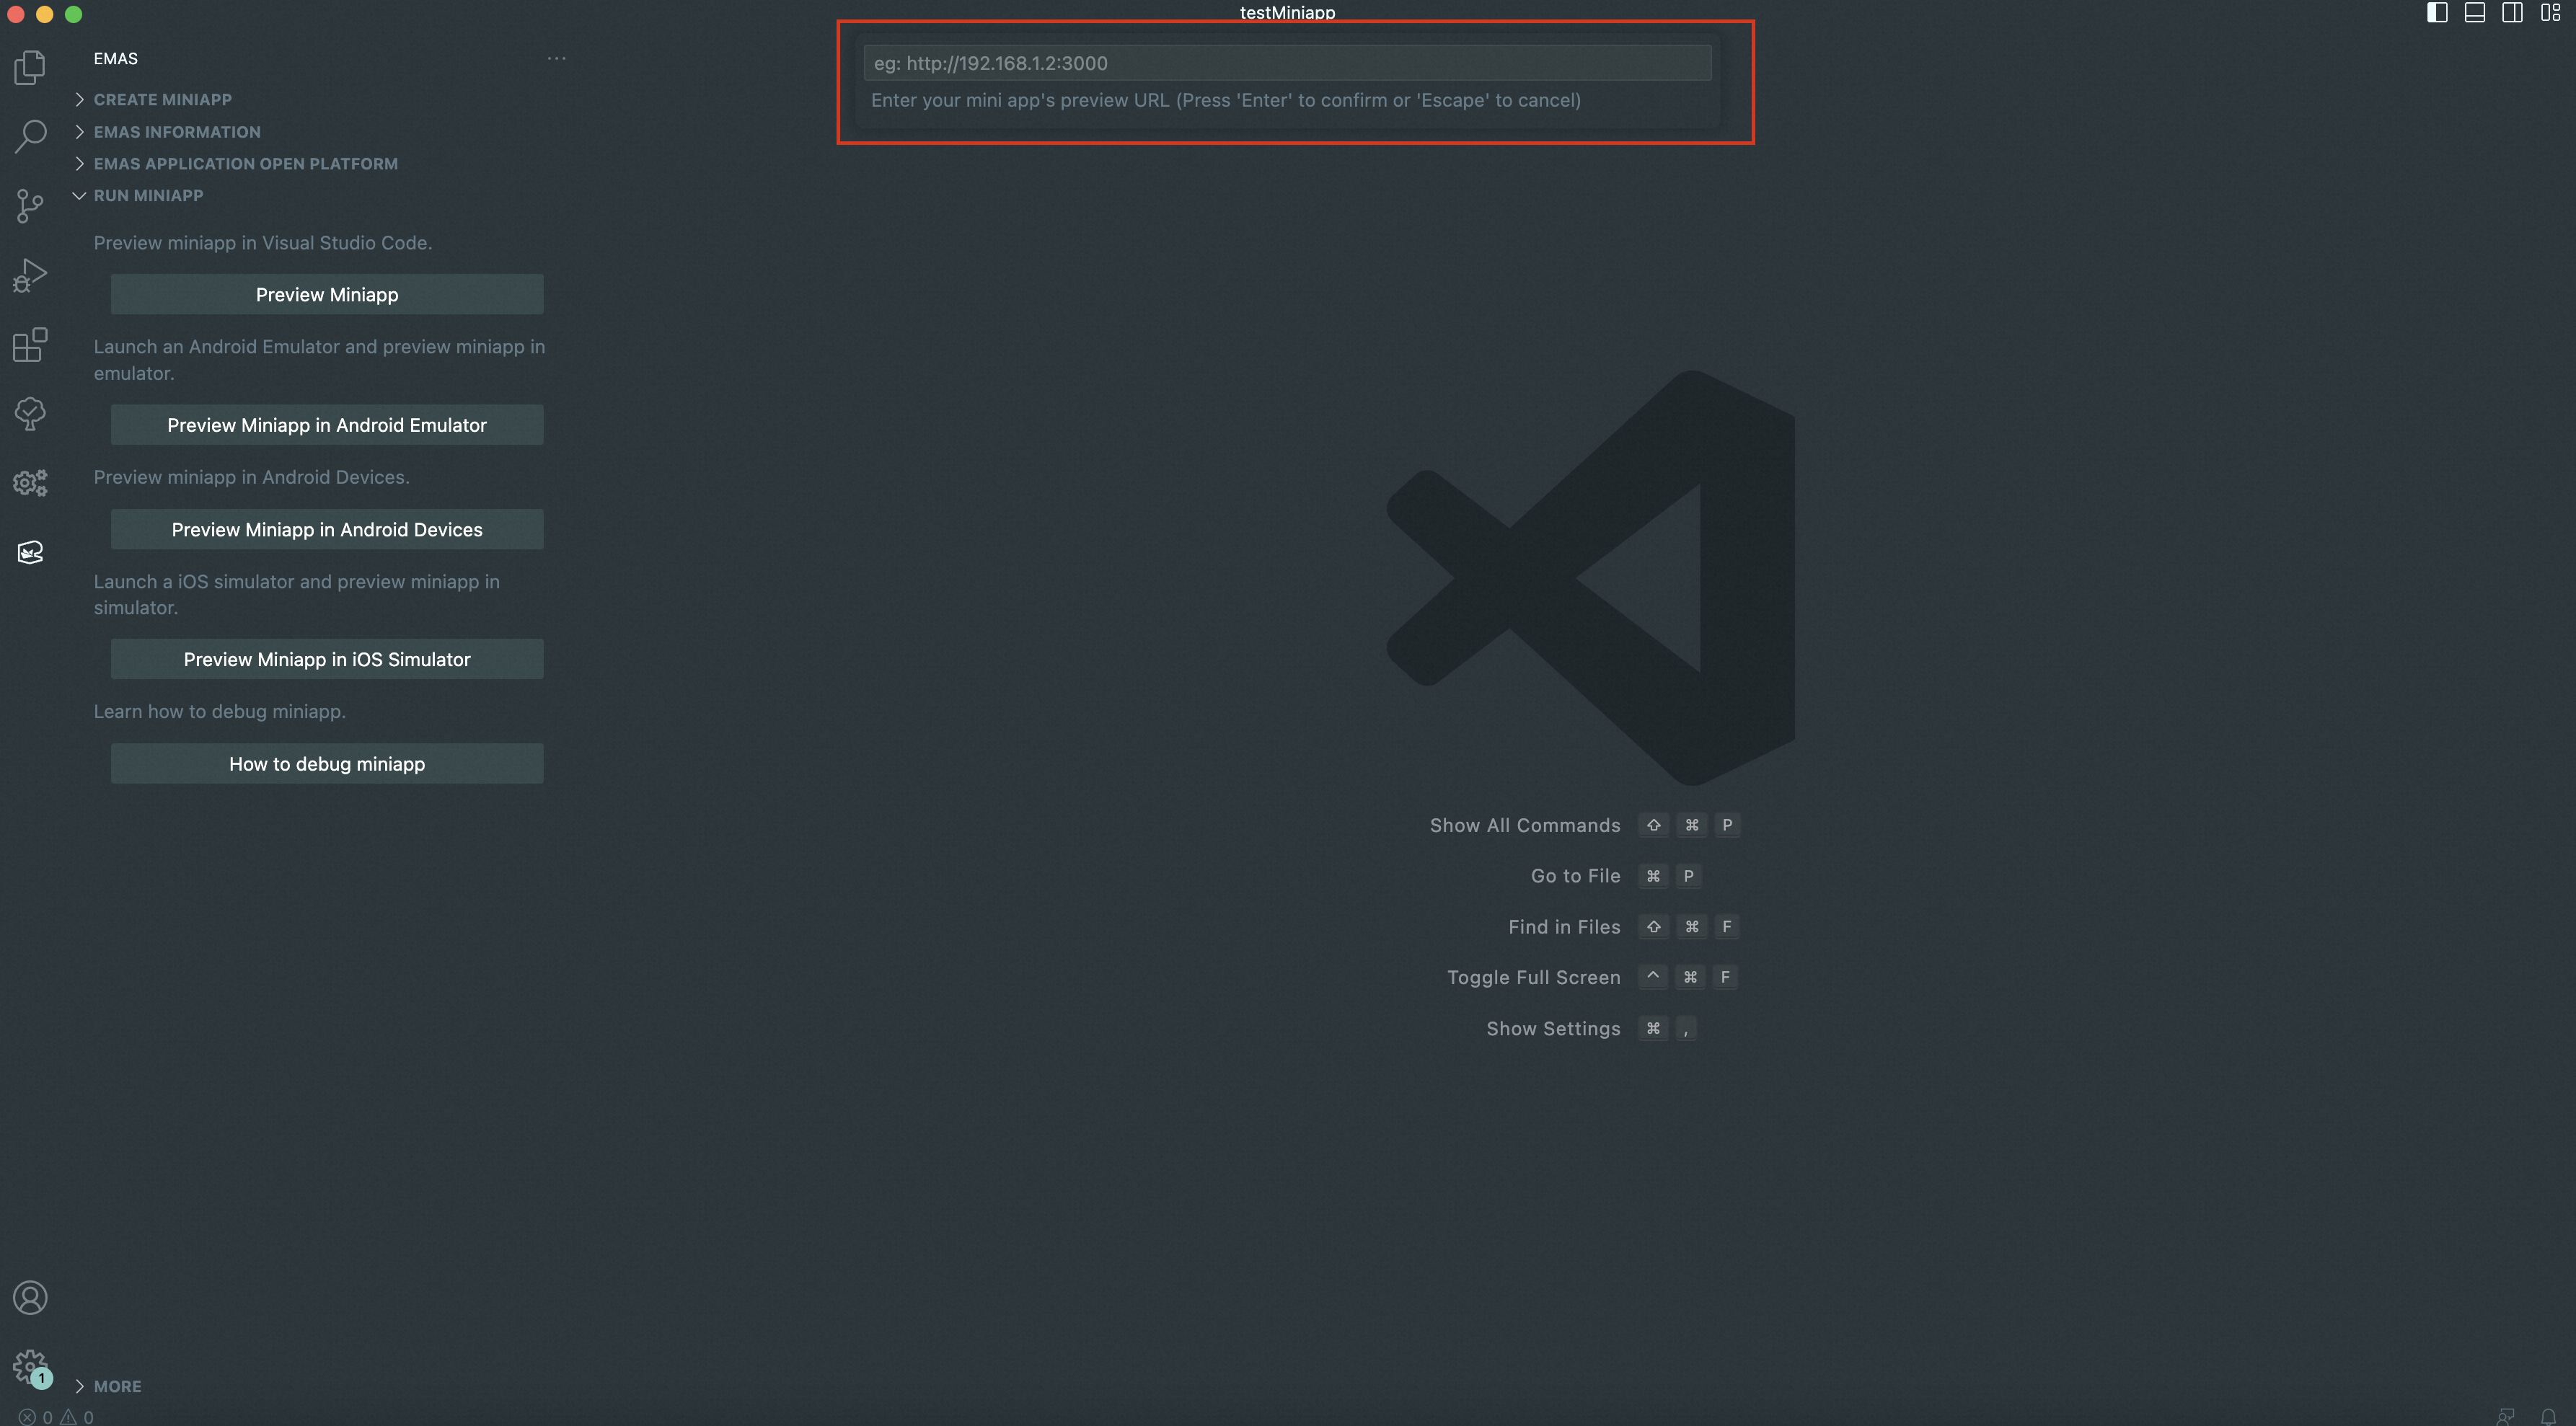
-
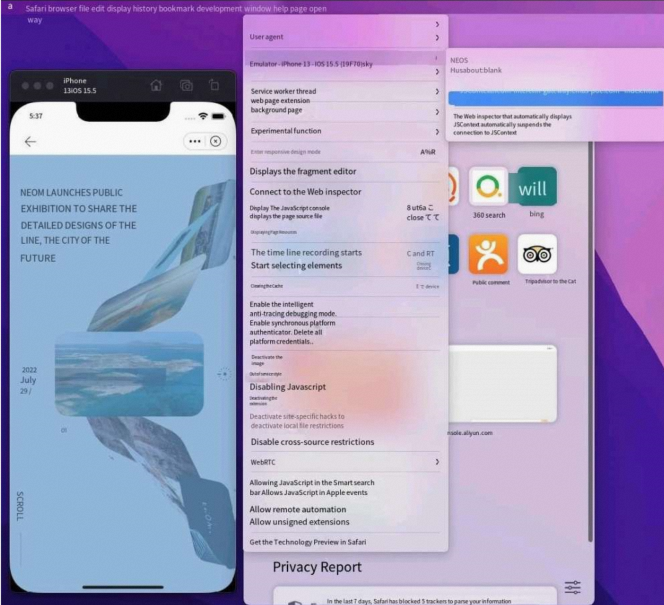
In Safari, choose Develop > Simulator. All inspectable WebView objects are listed.
-
Click the WebView object you want to inspect and debug the MiniApp in Web Inspector.