After you import trace data to Simple Log Service, you can view the details of the trace data, such as the trail map and spans.
Procedure
Log on to the Simple Log Service console.
Open the Trace Analysis page.
In the Log Application section, click Trace Service.
In the trace instance list, click the specified instance.
In the left-side navigation bar, click Trace Analysis.
On the Trace Analysis tab, click View Trace Details.
No.
Description
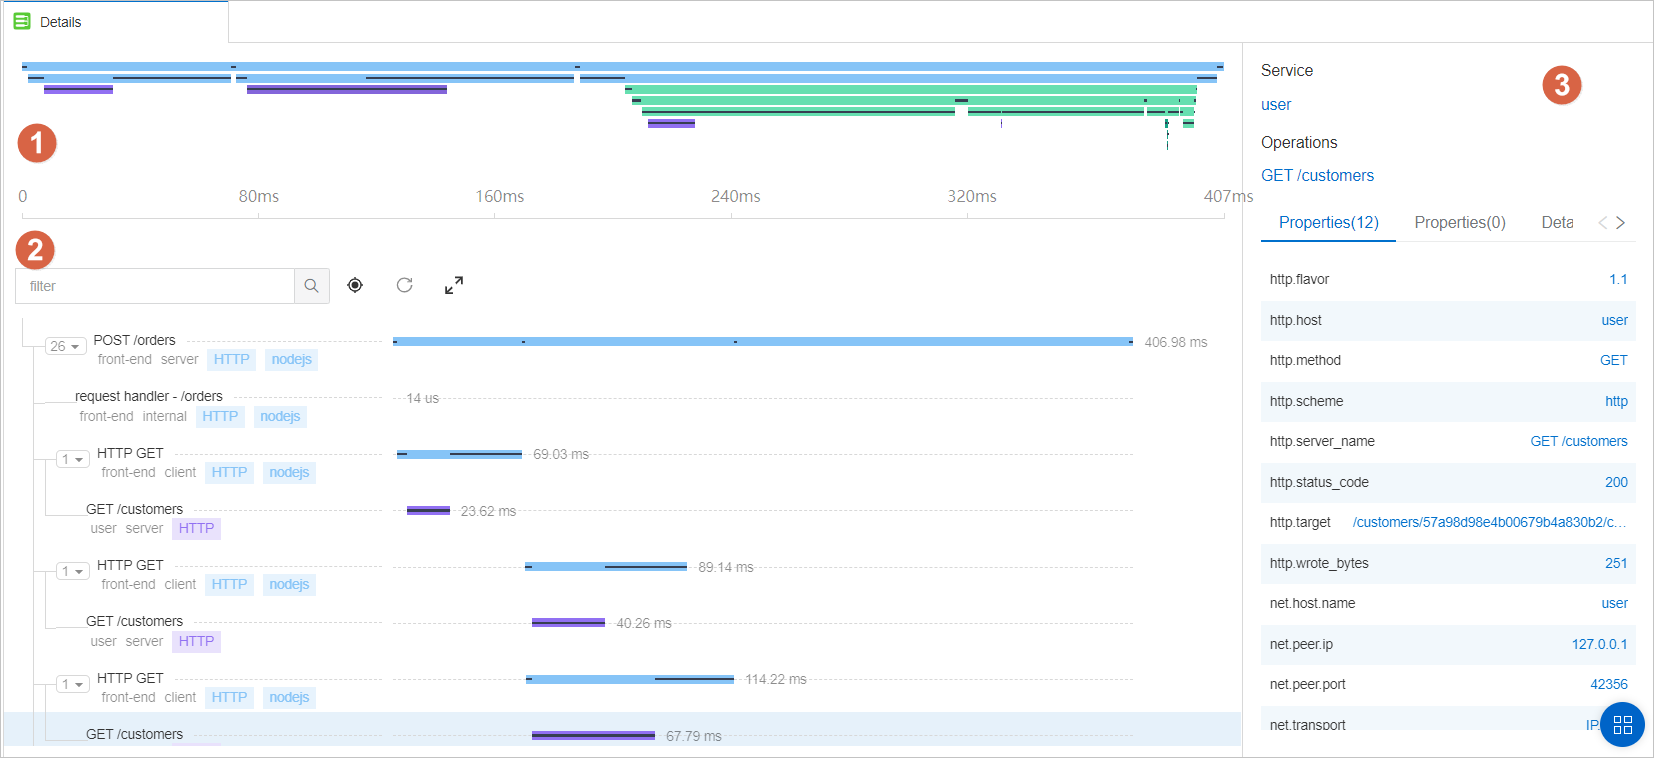
①
The trail map shows the entire trace and the distribution of spans.
Different colors represent different services. In this example, the blue color represents the front-end service.
The length of a black line in the trail map represents the self-time of a span. The self-time of a span is calculated by using the following formula: Time consumed by the span - Time consumed by child spans. For example, Span A calls Span B. Span A consumes 10 milliseconds, and Span B consumes 8 milliseconds. In this example, the self-time of Span A is 2 milliseconds.
The timeline represents the time range of the trace.
②
Each line in this section represents a span. This section also displays the hierarchical relationships between parent spans and child spans. Each parent span is preceded by a number, which indicates the number of child spans owned by the parent span. In this section, you can perform the following operations:
Click the
 icon to collapse or expand a span.
 Select a span and click the
 icon. The system displays only the data of the span.
 Click the
 icon to display the data of all spans.
③
When you click a span, the following information is displayed:
Service: the name of the service to which the span belongs.
Operations: the name of the operation.
Properties: the metadata of the span.
Resources: the resources that must be called to generate the span.
Details: the details of the span. For more information about field descriptions, see Trace data formats.
Log: the logs that are related to the span.