The CloudLens for SLS application provides out-of-the-box dashboards that help you analyze and monitor your Simple Log Service usage.
Prerequisites
Enable log collection for important logs, detailed logs, job run logs, audit logs, billing logs, error logs, and monitoring metrics in the target project. For more information, see Enable the log collection feature.
Procedure
- Log on to the Log Service console.
-
In the Log Application area, on the Cloud Service Lens tab, click CloudLens for SLS.
-
In the left-side navigation pane, under Report Center, click the target report.
-
In the upper-left corner of the page, select the target project.
Overview
The Overview dashboard provides a high-level summary of your Simple Log Service project, displaying key metrics such as the number of read and write requests, read and write success rates, requests with 4xx or 5xx status codes, write traffic (raw and compressed sizes), write traffic compression ratio, and read traffic.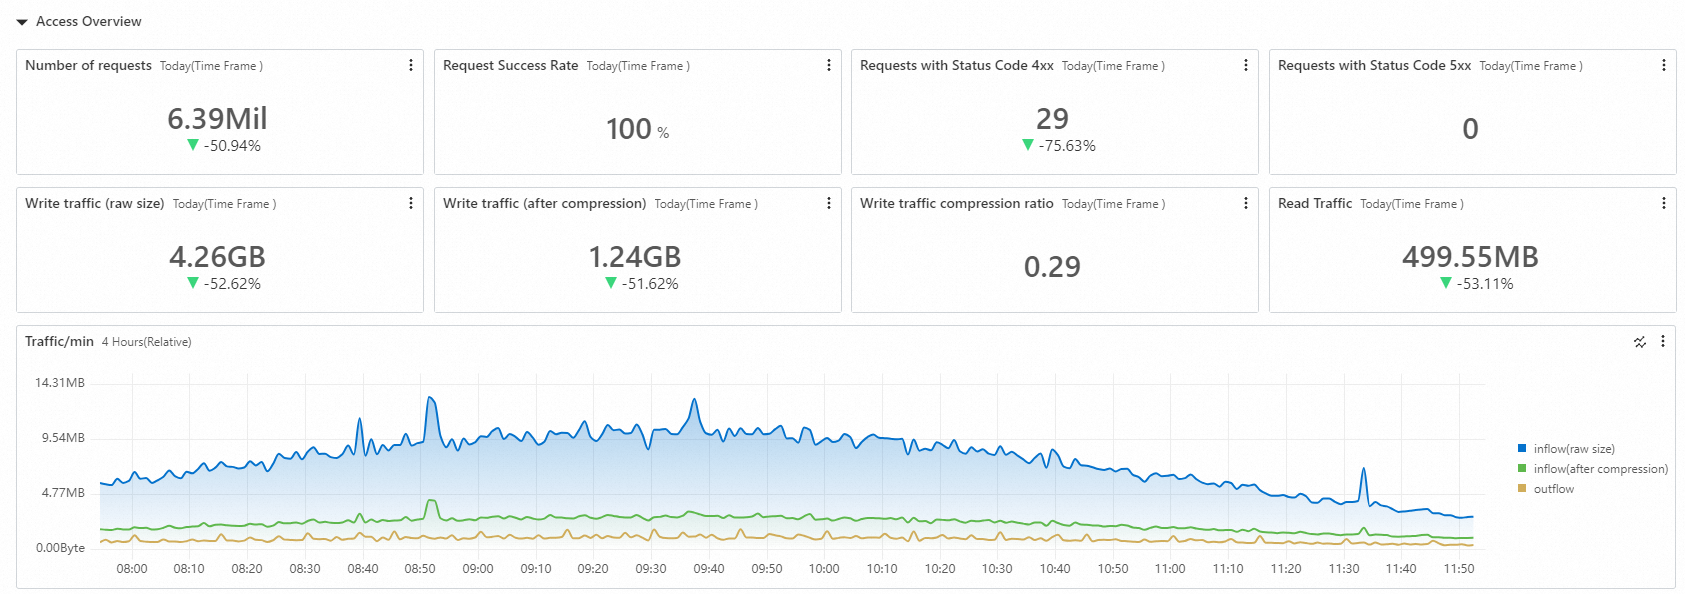
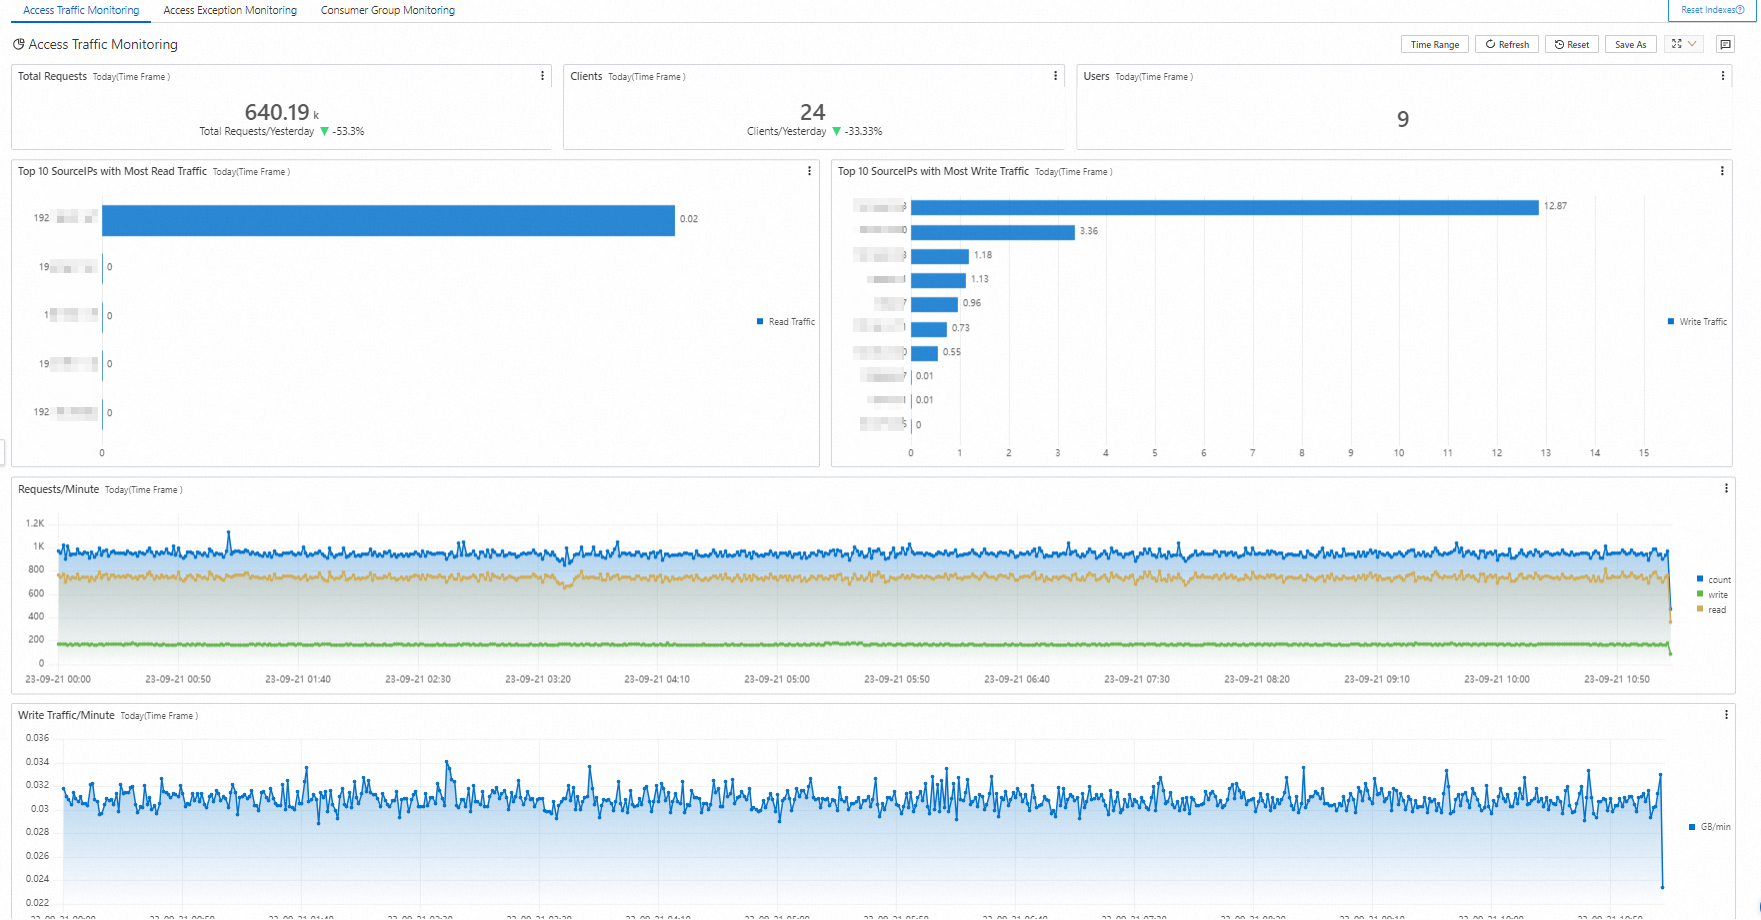
Access traffic monitoring
The Access Traffic Monitoring dashboard displays access activity for Simple Log Service. Key metrics include total daily requests, number of clients, number of daily users, Top 10 source IPs by read network traffic, Top 10 source IPs by write network traffic, request count, write traffic, shard write traffic trends, shard consumption traffic trends, per-minute changes in read and write network traffic, and access source distribution.
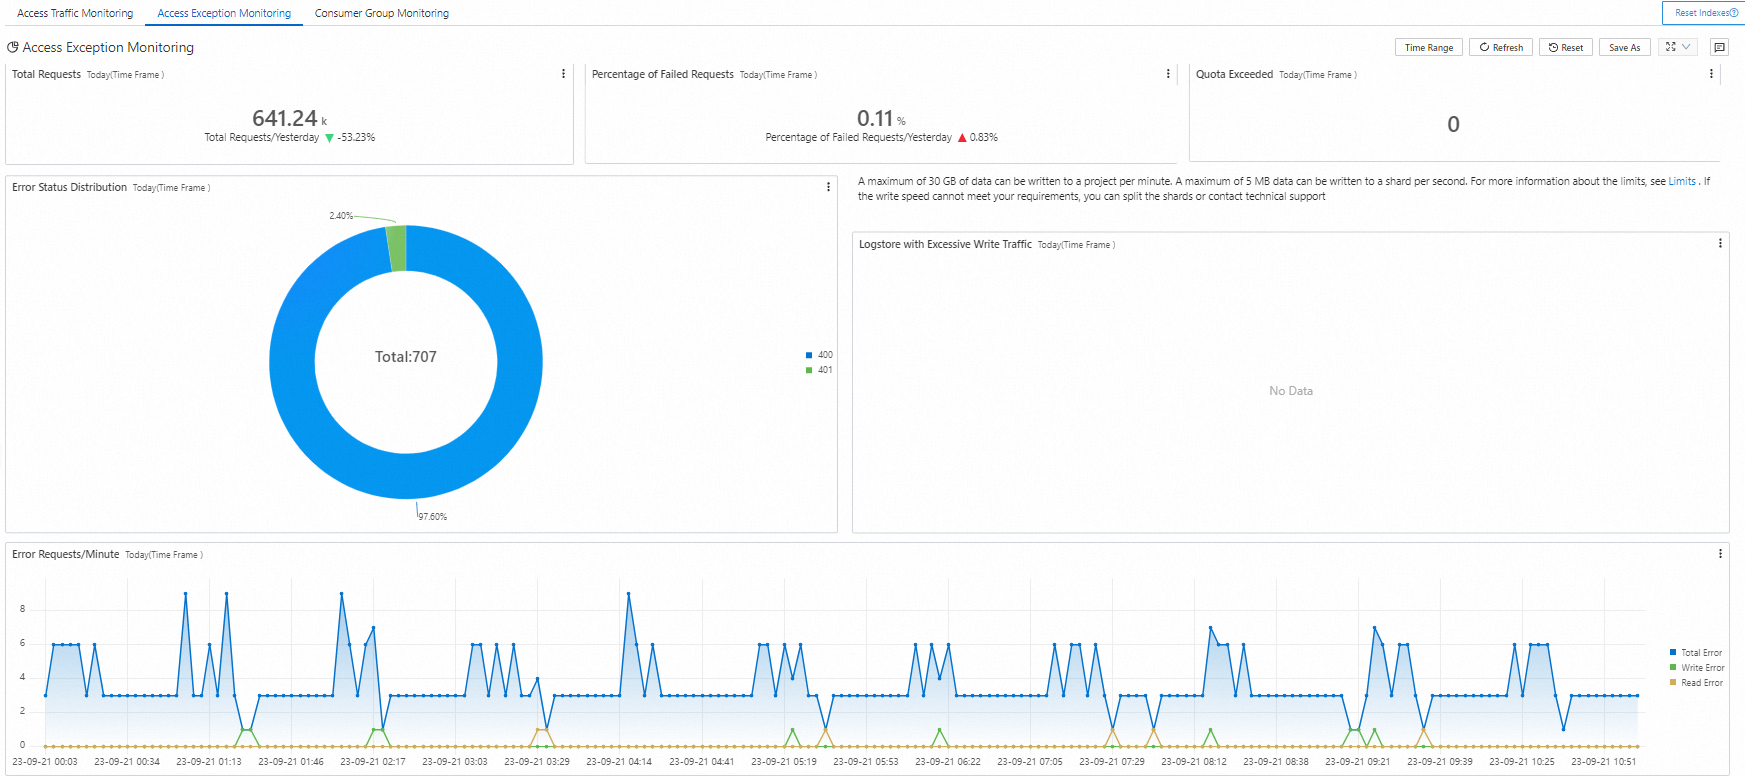
Access exception monitoring
The Access Exception Monitoring dashboard displays information about access exceptions in Simple Log Service. Key metrics include total daily requests, failed request rate, throttling errors, request error status distribution, Logstores that exceed write limits, error request count, and request latency trends.
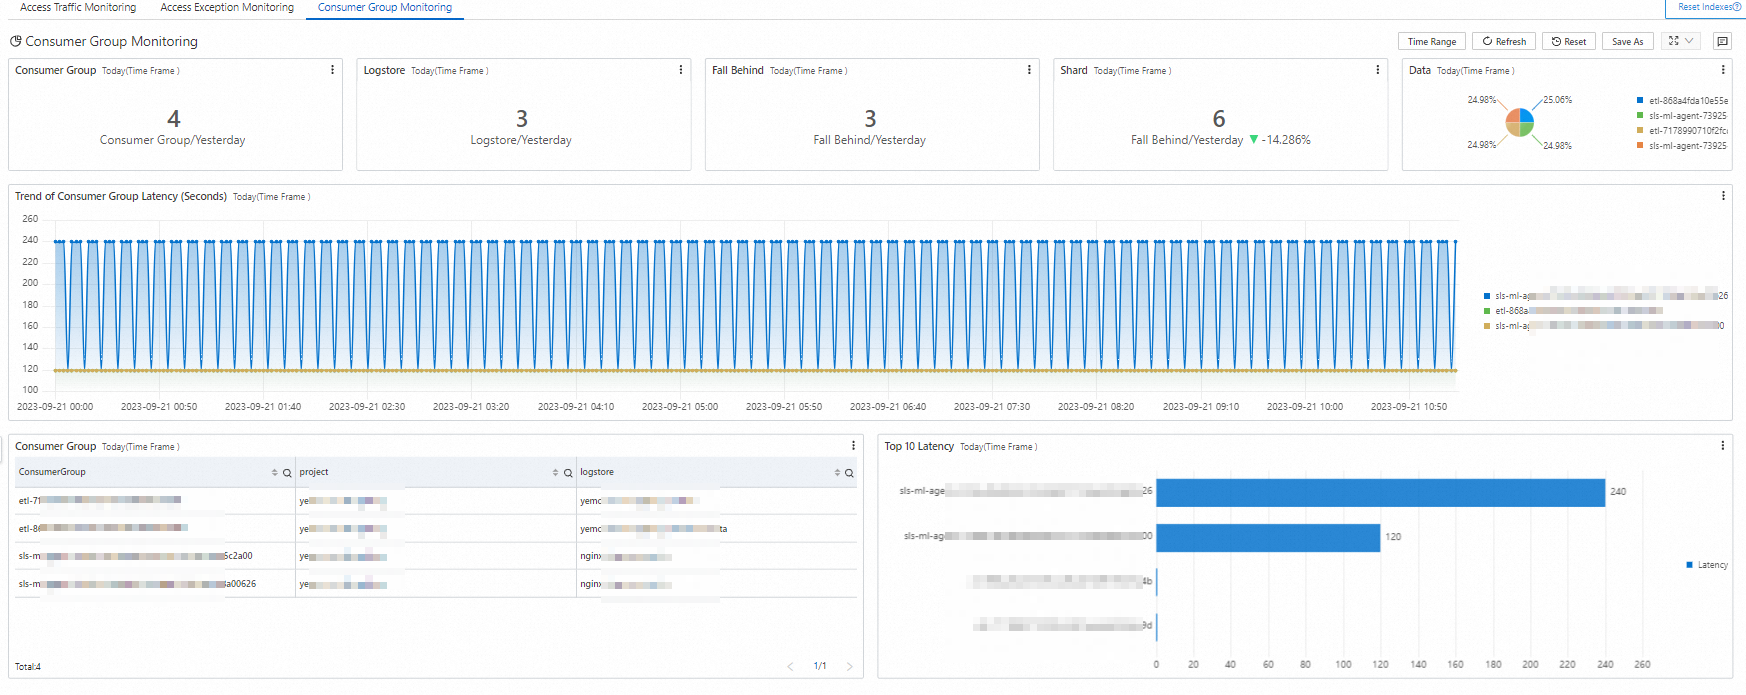
Consumer group monitoring
The Consumer Group Monitoring dashboard provides metrics for consumer groups. Key metrics include the number of consumer groups, number of consumed Logstores, number of consumed shards, consumer group lag count, consumer group data proportion, a list of consumer groups, Top 10 consumer groups by lag, and overall consumption lag duration.
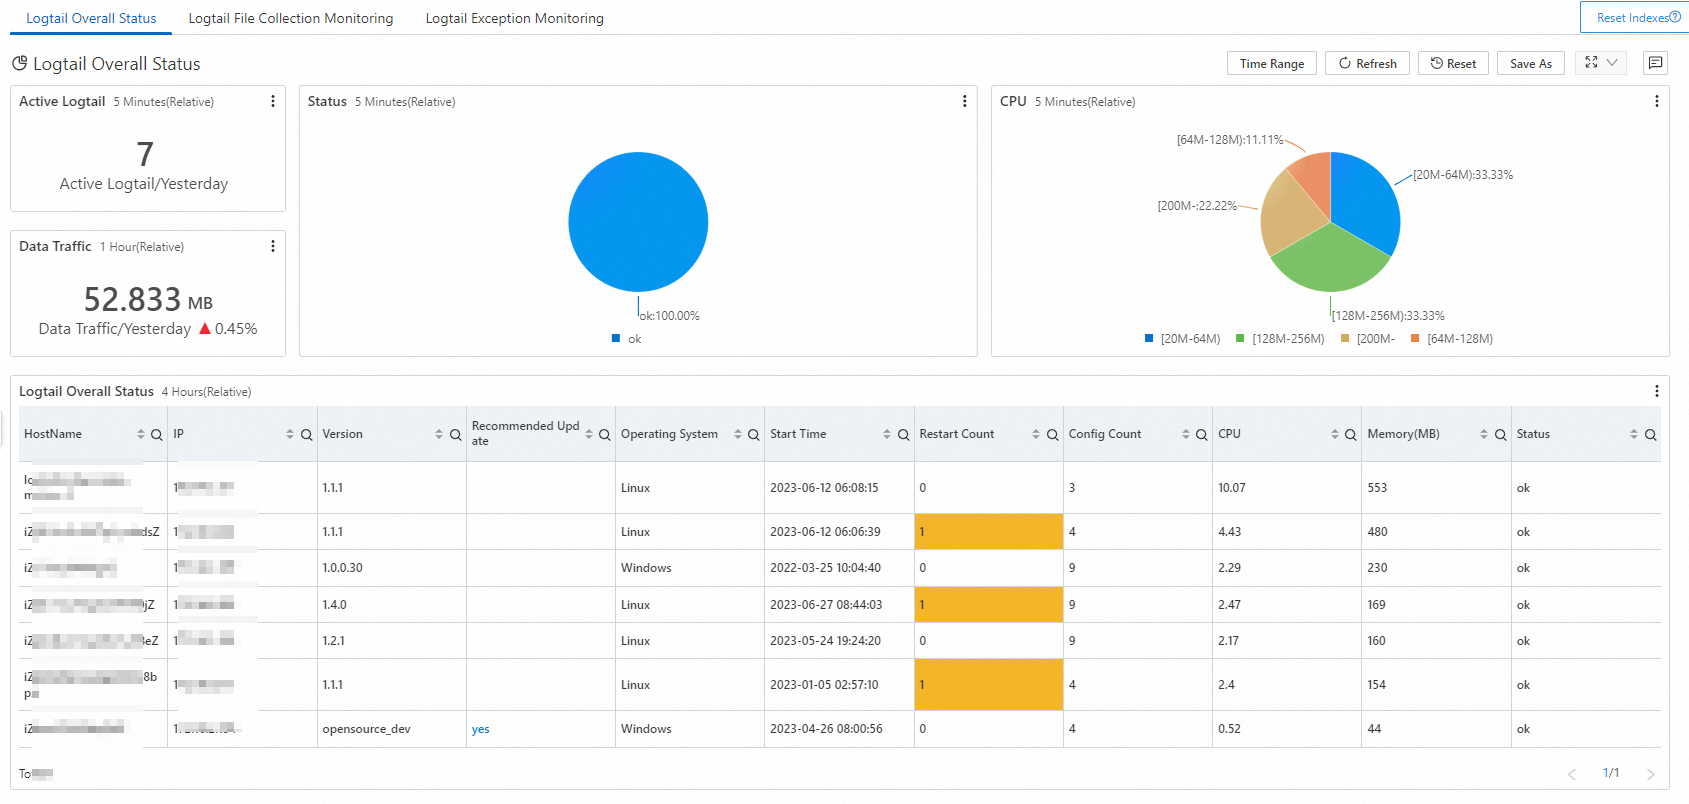
Logtail overall status
The Logtail Overall Status dashboard displays the overall status and health of Logtail agents. Key metrics include the number of active Logtail agents, raw data traffic, running status distribution, memory usage distribution, overall Logtail status, CPU and memory trends, and data sending traffic.
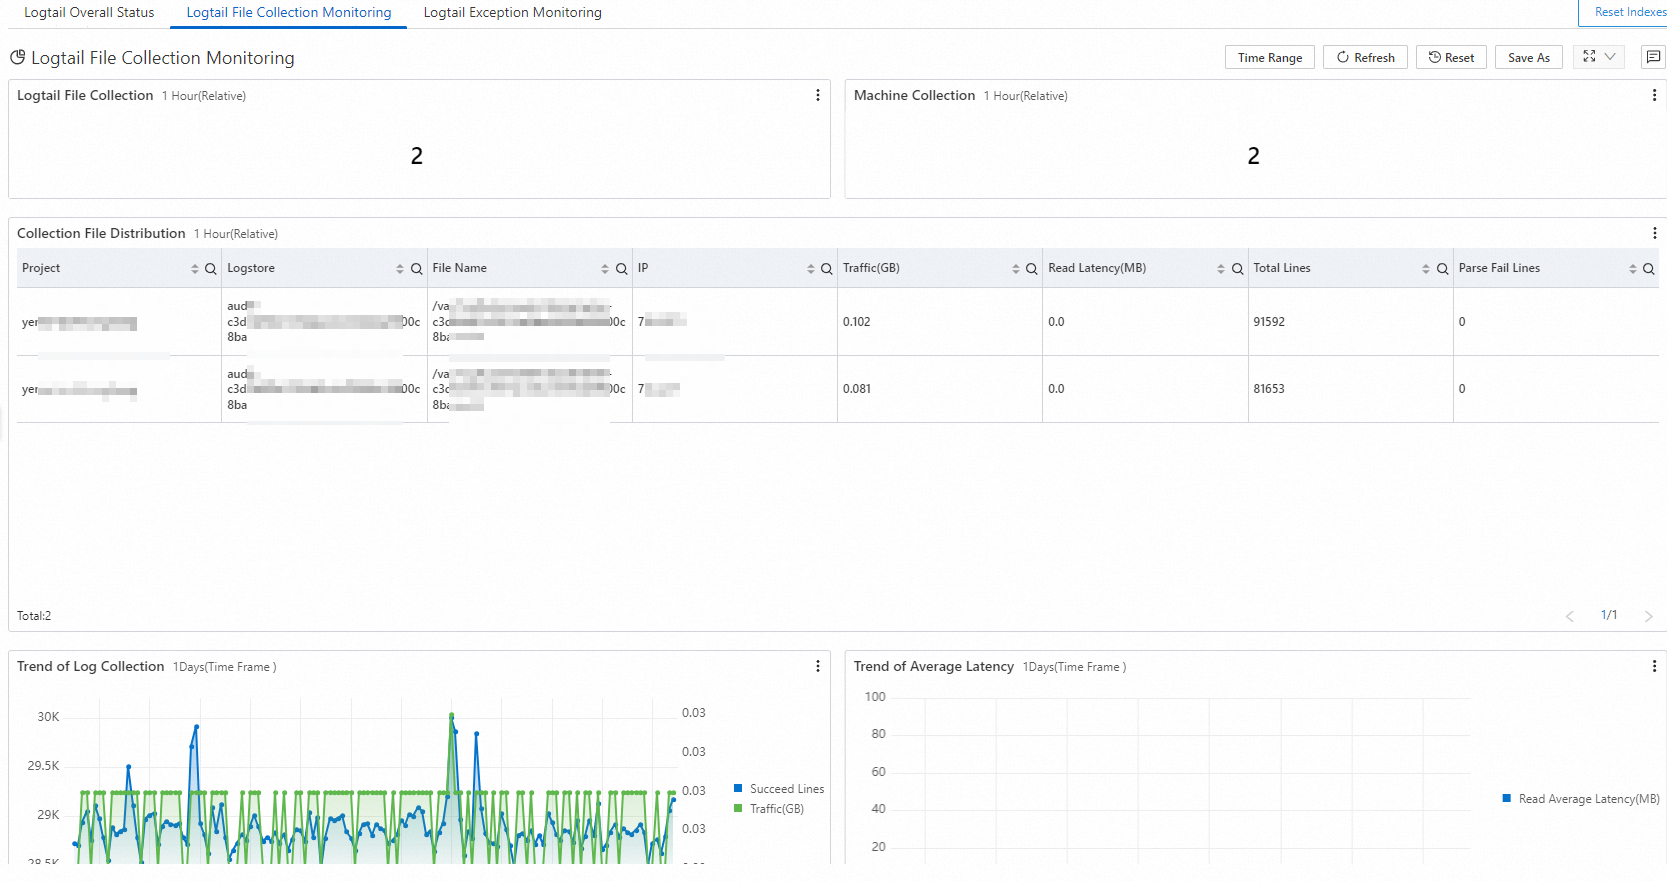
Logtail file collection monitoring
The Logtail File Collection Monitoring dashboard monitors file collection tasks that Logtail performs. Key metrics include the number of files being collected, number of collection machines, collected file distribution, log collection volume, average collection latency, parsing failure rate, and sending frequency trends.
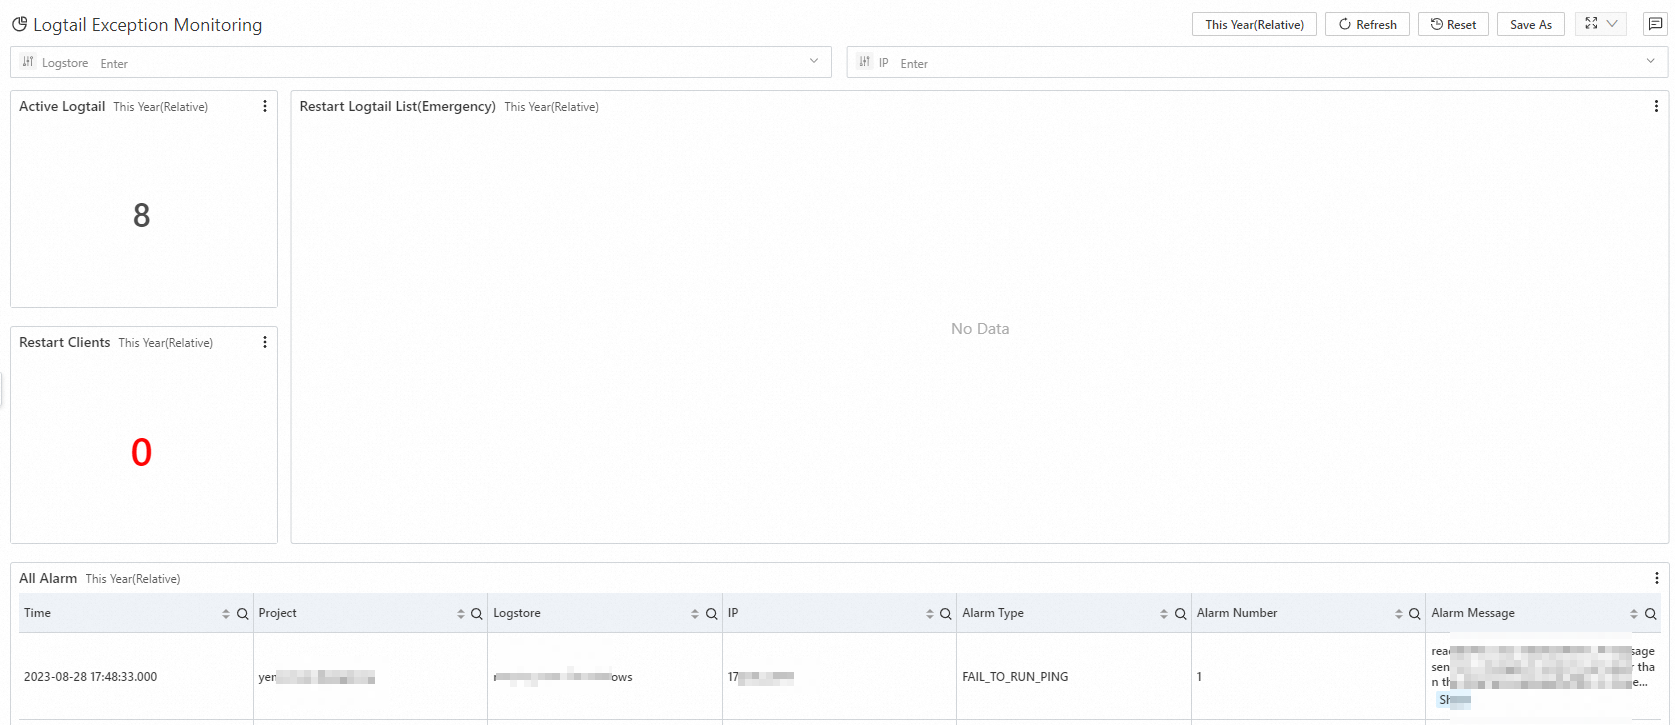
Logtail exception monitoring
The Logtail Exception Monitoring dashboard helps you track Logtail exceptions. Key metrics include the number of active Logtail agents, a list of restarted Logtail agents, the number of restarted clients, and a comprehensive list of all error messages.
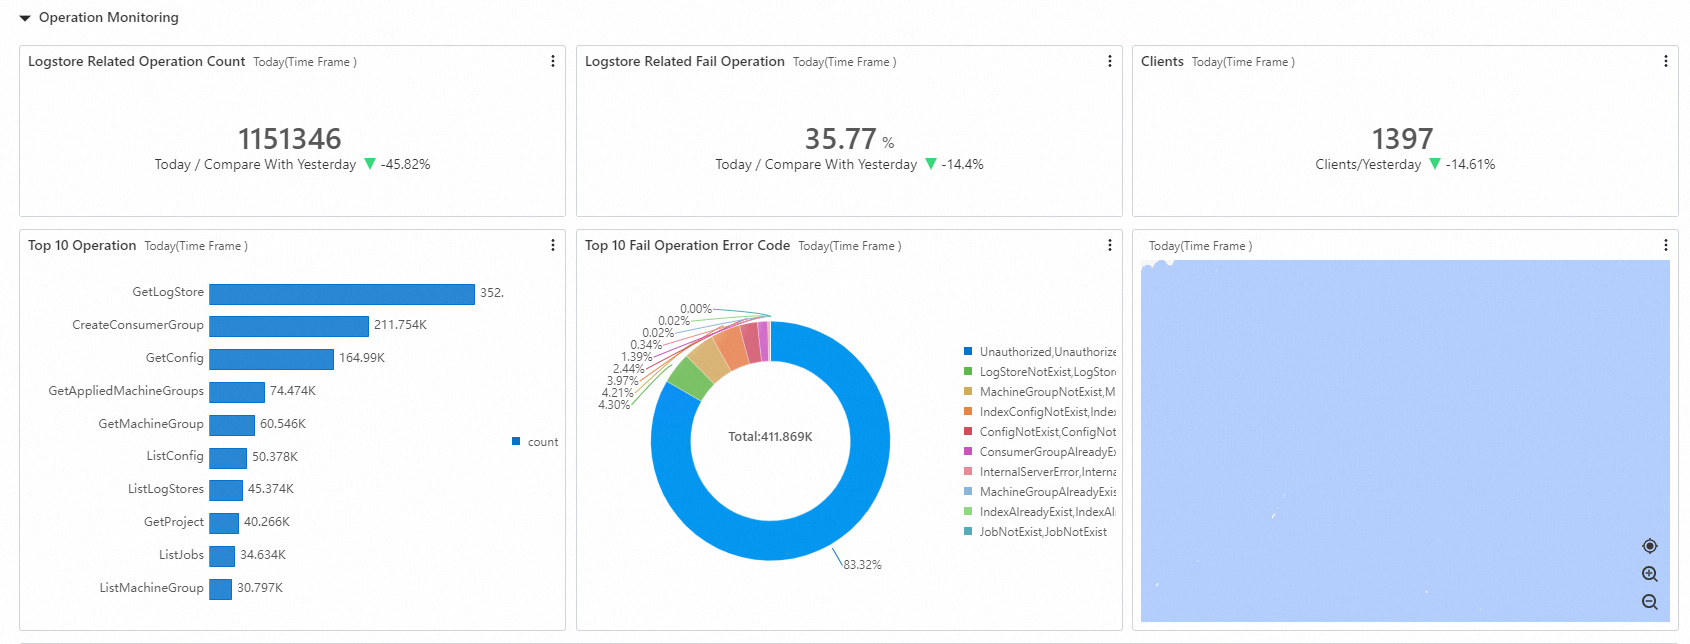
Operation monitoring
The Operation Monitoring dashboard displays records of operations on Simple Log Service resources. Key metrics include the total number of Logstore operations, the Logstore operation failure rate, and the number of clients that perform operations.
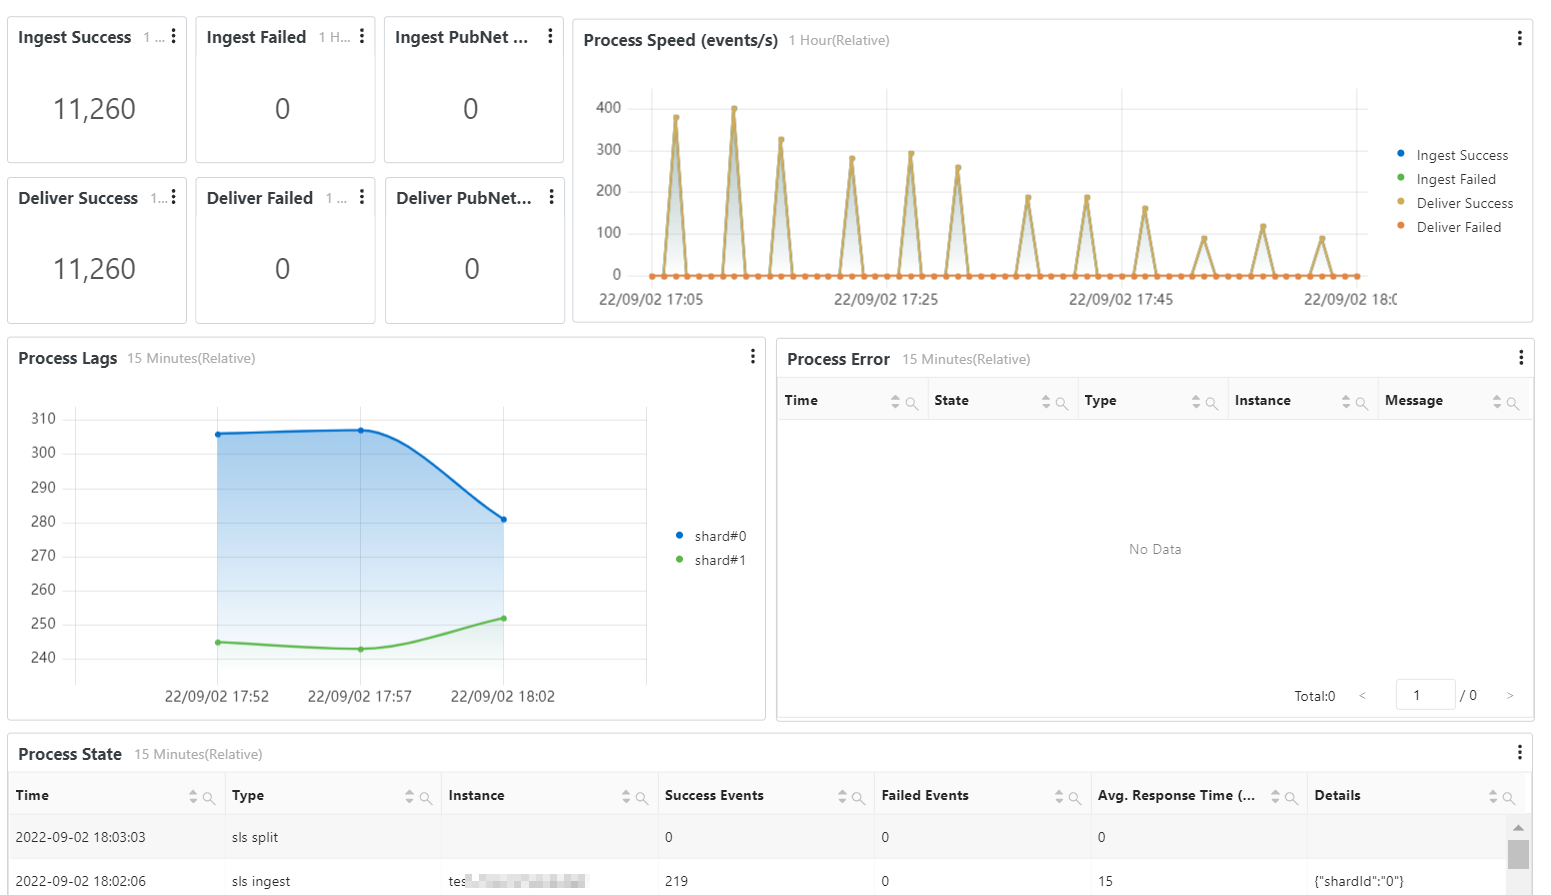
Job monitoring
The Job Monitoring dashboard displays the runtime status of data import jobs (new version), data shipping jobs (new version), and scheduled SQL jobs. It includes charts for metrics such as successful and failed read counts, successful and failed write counts, public read and write traffic, processing rate, processing lag, and runtime exceptions.
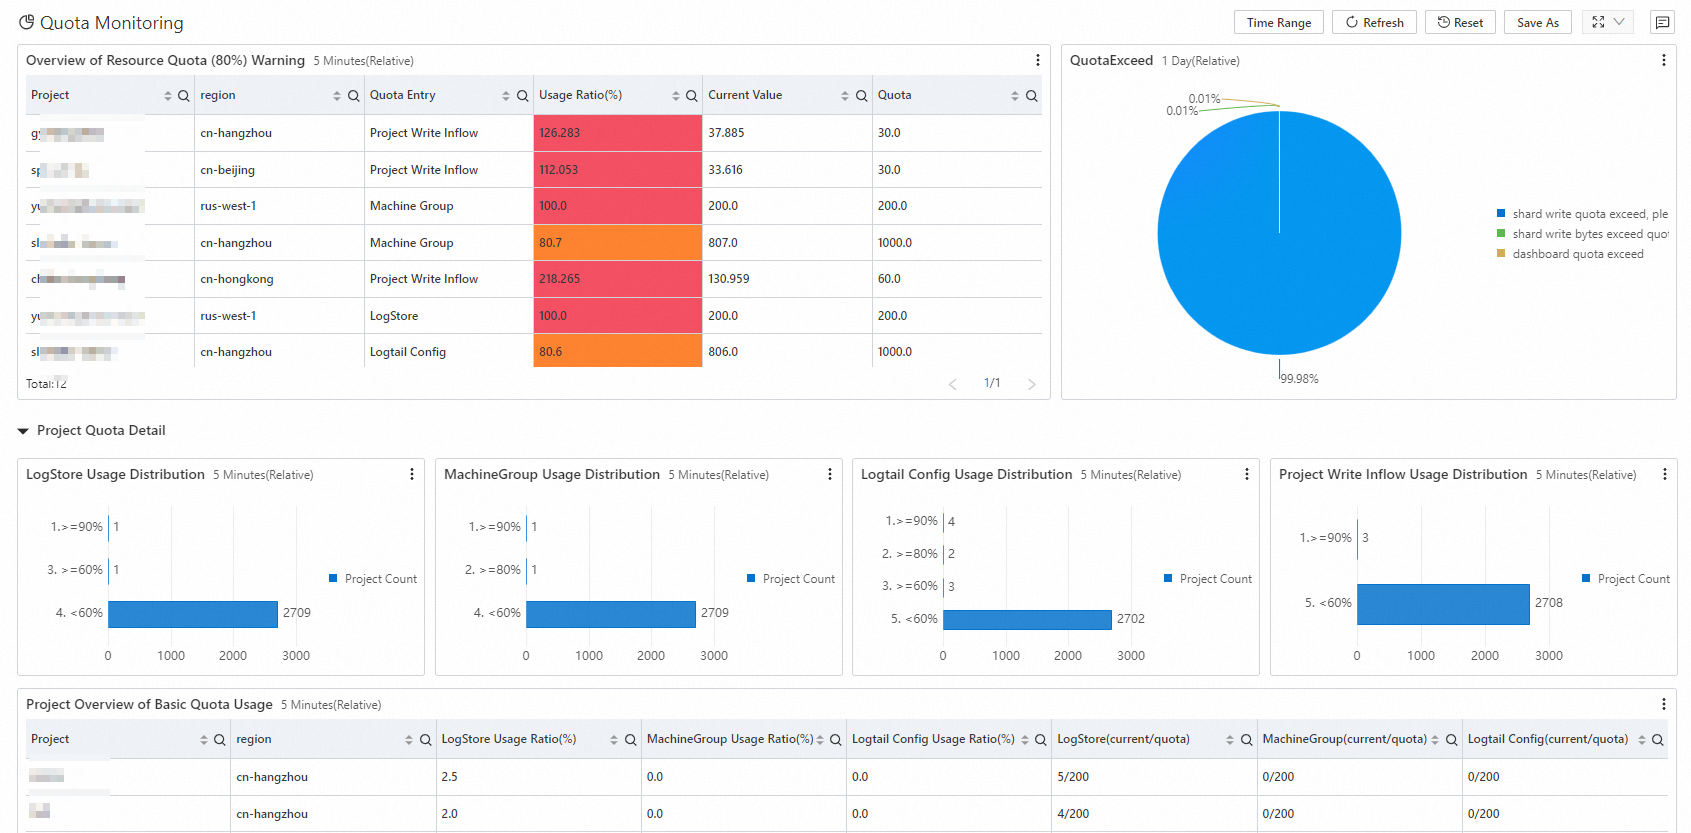
Quota monitoring
The Quota Monitoring dashboard helps you track resource usage against configured quotas and identify when you are approaching or exceeding your limits. It includes charts such as a resource quota 80% watermark alert overview, quota exceedance distribution, Logstore watermark ratio distribution, MachineGroup watermark ratio distribution, Logtail collection configuration watermark ratio distribution, project write traffic watermark ratio distribution, a project's basic resource quota details, a project's data read/write resource quota details, and a project's resource exceedance details.
SQL quality monitoring
The SQL Quality Monitoring dashboard analyzes your SQL statements from multiple dimensions, including an overview, SQL service metrics, SQL Patterns, and optimization recommendations, to help you monitor and optimize them to improve query and analysis efficiency.
The dashboard consists of the following five sections:
-
Overview
-
SQL Metric
-
Running Metric
-
SQL Pattern
-
Optimization and Recommendations
Overview
This section provides a high-level summary of your SQL activity, including the SQL health score, a SQL usage report, and overall SQL performance. It helps you quickly assess the general health of your SQL queries.
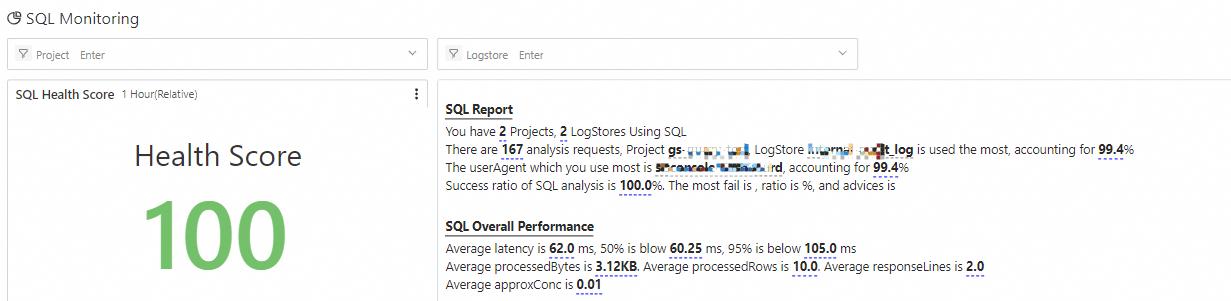
SQL health score
The health score is calculated with the formula: (1 - Query Failure Rate) * 100.
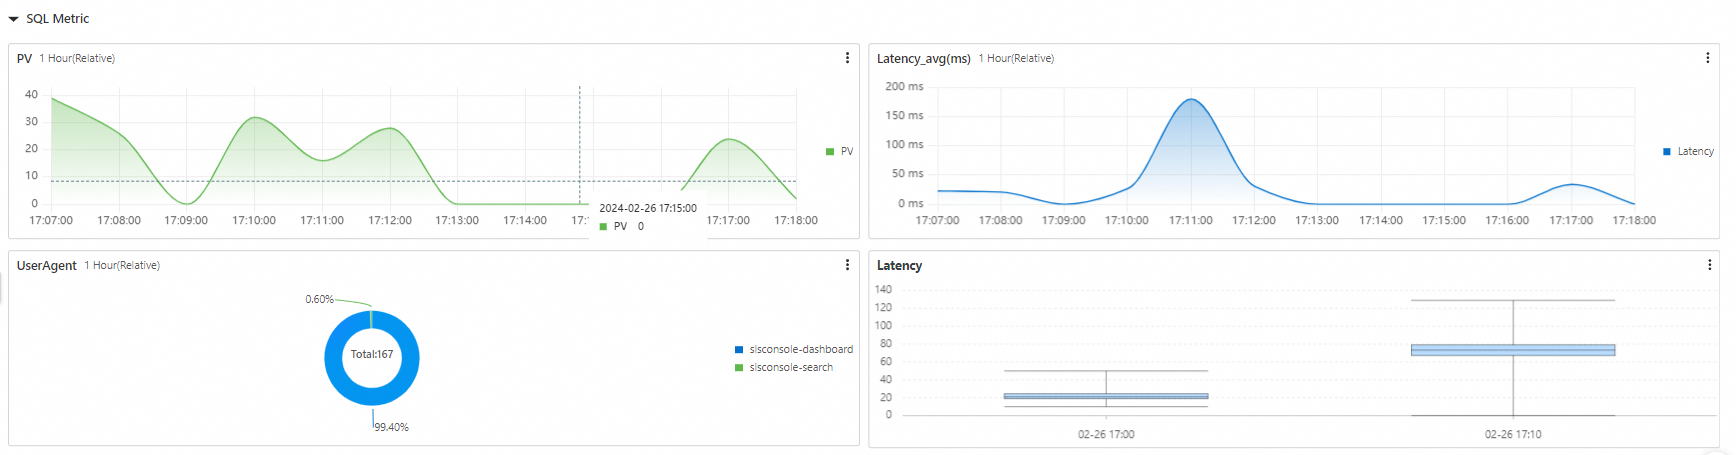
SQL service metrics
This section displays overall service metrics for your SQL queries, such as requests per minute, average latency, user agent distribution, and latency distribution.
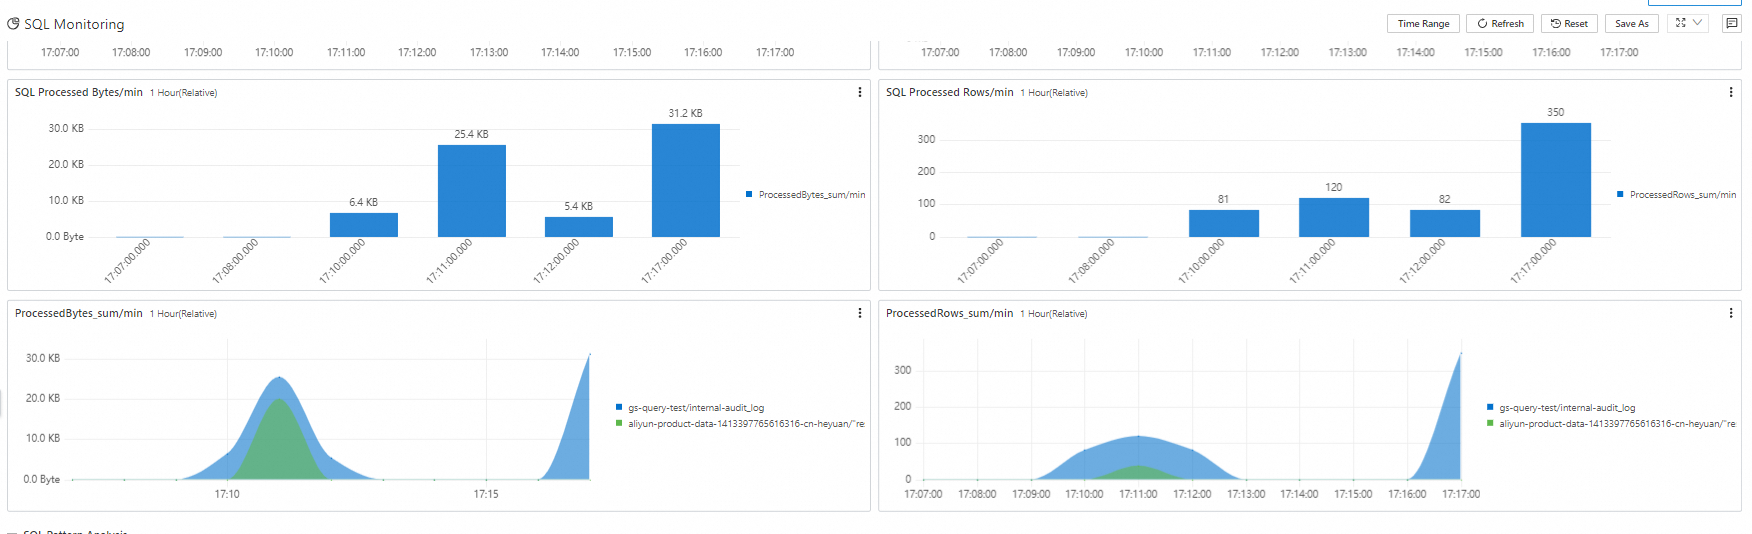
Running metrics
This section displays the core runtime metrics for SQL execution, including concurrent requests, latency at different stages, data processing volume per minute, and processed rows per minute.
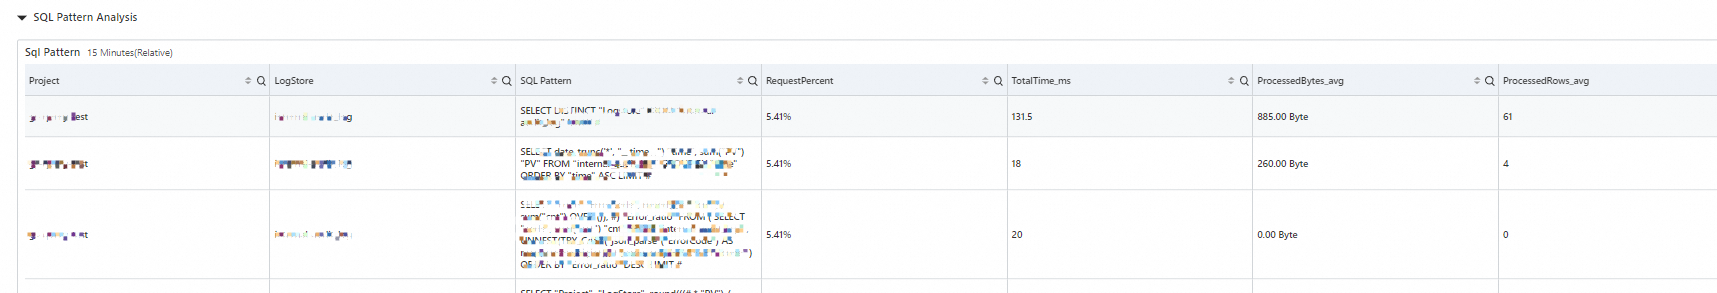
SQL pattern analysis
This section aggregates similar queries into SQL Patterns by generalizing their structure. This helps you identify query characteristics, such as the most frequently executed SQL Patterns and the top resource-consuming SQL Patterns.
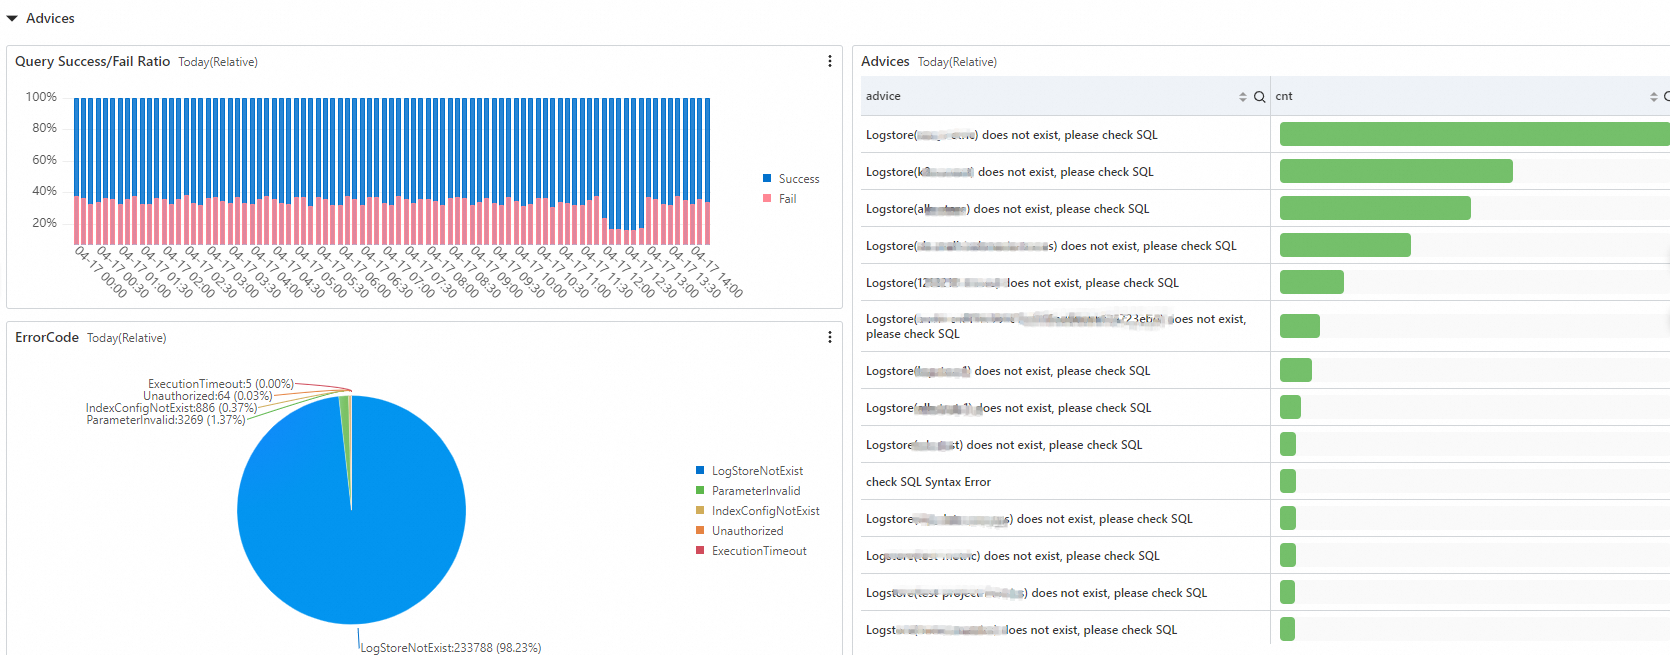
Optimization and recommendations
This section analyzes queries that resulted in errors and provides optimization recommendations to improve SQL execution performance.
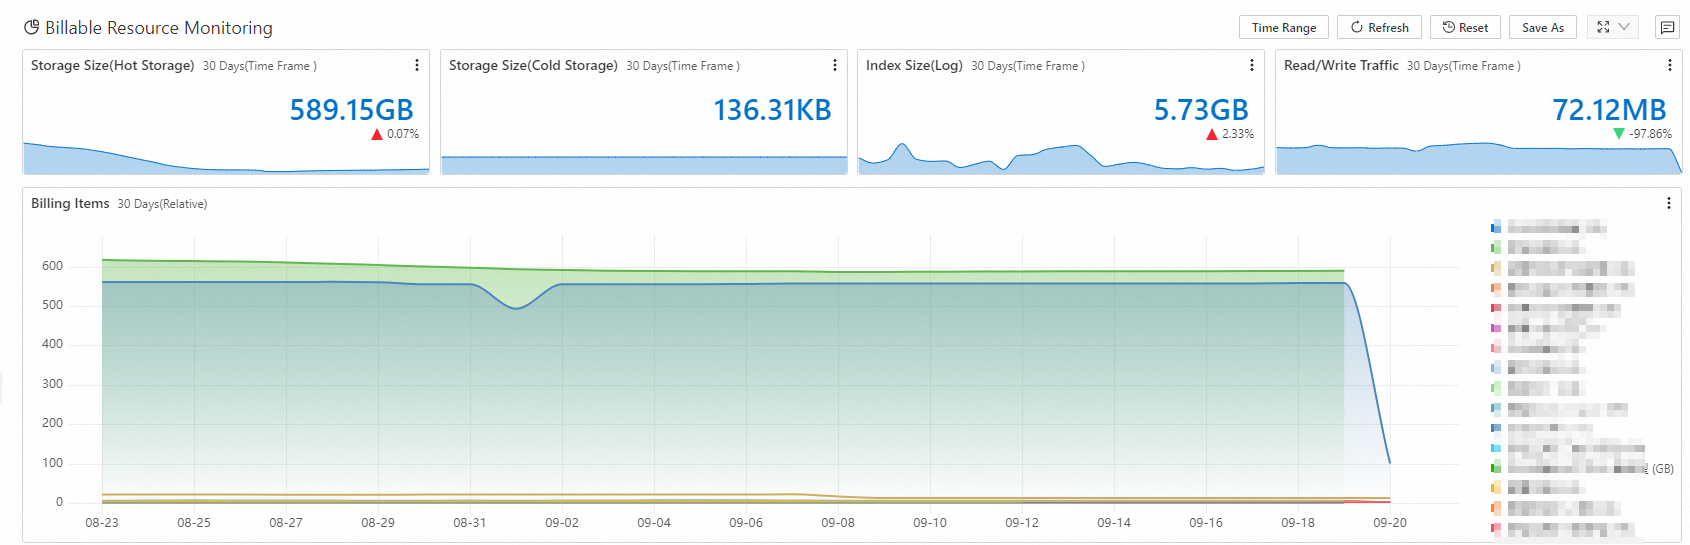
Billable resource monitoring
The Billable Resource Monitoring dashboard displays metrics for your billable resources in Simple Log Service. Key metrics include storage space for hot storage and cold storage, index traffic, read/write traffic, usage trends of billable items after resource plan deductions, and detailed usage for top projects and Logstores.