Simple Log Service records the lifecycle of each alert as a log, and then stores alert logs in a dedicated Logstore. You can use alert logs to obtain information such as the overall status and stability of monitored objects. This topic describes how to use custom query statements to analyze alert logs in a dedicated Logstore.
Background information
The first time you use the alerting feature of Simple Log Service, you are prompted to select a region. After you select a region, Simple Log Service automatically creates a project named sls-alert-Alibaba Cloud account ID-Region and a Logstore named internal-alert-center-log in the region to store alert logs.
You are not charged for the internal-alert-center-log Logstore. By default, indexes are created for the Logstore.
Simple Log Service generates built-in dashboards based on the internal-alert-center-log Logstore. The built-in dashboards display information about alerts, such as the details of triggered alerts and alert notifications. For more information, see Alert Center dashboards. You can execute custom query statements in the Logstore to analyze alert logs based on your business requirements.
Log topics
The topic of an alert log varies based on the status of the alert log. You can identify the status of an alert log based on the value of the __topic__ field. The following table describes common log topics.

Log topic | Description |
__topic__: alert_state | Data is evaluated based on the alert monitoring rule. |
__topic__: alert_received | The alert management system receives alerts. |
__topic__: alert_routed | Alerts are merged by route based on alert policies after the alerts are received. |
__topic__: alert_pre_filter | Alerts enter the suppression or silence stage. |
__topic__: alert_silenced | Alerts are suppressed or silenced. |
__topic__: alert_pre_notify | Alerts enter the notification sending stage. |
__topic__: alert_notified | Alert notifications are sent. |
__topic__: system_config | Logs are generated when configuration errors occur. |
Procedure
Log on to the Simple Log Service console.
In the Projects section, click the project that you want to manage. Example: sls-alert-13****47-cn-hangzhou.
On the tab, click the internal-alert-center-log Logstore.
On the query and analysis page of the Logstore, execute a custom query statement to analyze alert logs.
A query statement consists of a search statement and an analytic statement in the Search statement|Analytic statement format. For more information about the syntax of query statements, see Search syntax and SQL analysis syntax.
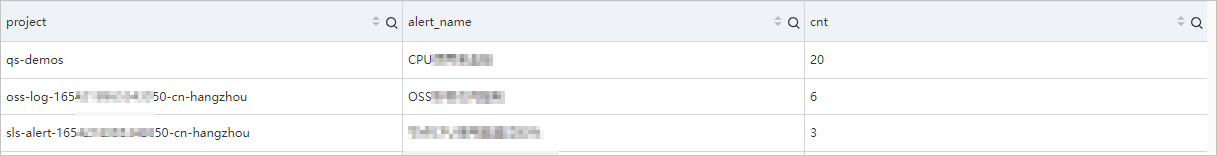
Example 1: Calculate the number of alert monitoring rules that trigger alerts within a specific period of time and calculate the number of triggers for each alert monitoring rule within the period of time.
Query statement
__topic__: alert_received |
select
  "alert.project" as project,
  "alert.alert_name" as alert_name,
  count(*) as cnt
group by
  project,
  alert_name
order by
  cnt desc
Query and analysis results
Example 2: Calculate the number of times that alert notifications failed to be sent by using each notification method within a specific period of time.
Query statement
__topic__: alert_notified and level: error |
select
  "notifierConfig.type" as notificationType,
  count(*) as cnt
group by
  notificationType
order by
  cnt desc
Query and analysis results

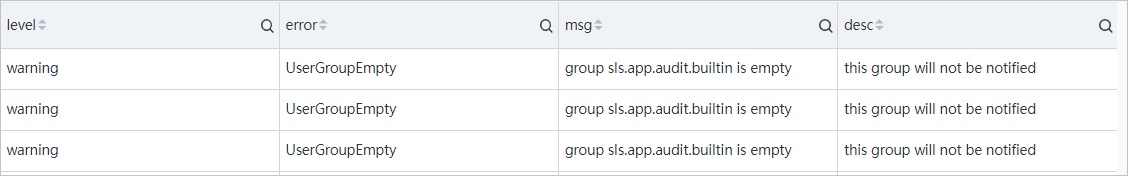
Example 3: View the causes for alert notification failures.
Query statement
__topic__: system_config
and alert.alert_id: alert -1626423664 -868572 |
select
  level,
  error,
  msg,
  "desc"
Query and analysis results
If the query and analysis results contain data, configuration errors occurred. For more information about configuration errors, see Configuration errors.
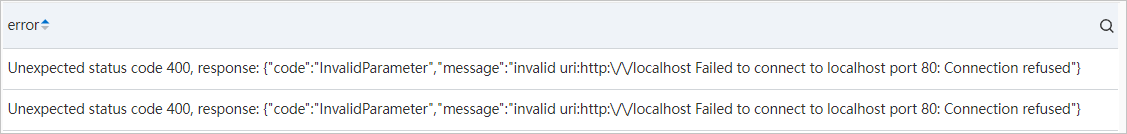
If no data is contained in the query and analysis results, the specified notification method may be invalid. For example, the specified webhook URL is invalid or the specified DingTalk chatbot is deleted. You can execute the following query statement to view detailed causes:
__topic__: alert_notified
and level: error
and alert.alert_id: alert -1626423664 -868572 |
select
  error
In this example, the following messages are returned. The returned messages indicate that alert notifications failed to be sent because the specified webhook URL is invalid.