The intelligent inspection feature inspects service data and identifies anomalies in an automated, intelligent, and adaptive manner. This topic describes how to use SQL statements to aggregate metrics for intelligent inspection.
Prerequisites
Data is collected and stored in a Logstore, which is referred to as the source Logstore. For more information, see Data collection overview.
Indexes are configured for the source Logstore. For more information, see Create indexes.
An Intelligent Anomaly Analysis instance is created. For more information, see Create an instance.
Create an intelligent inspection job
Go to the Create Intelligent Inspection Job wizard
Log on to the Simple Log Service console.
Go to the Create Intelligent Inspection Job wizard.
In the Log Application section, click Intelligent Anomaly Analysis.
In the instance list, click the ID of the instance for which you want to create an intelligent inspection job.
In the left-side navigation pane, select Intelligent Inspection > Real-time Inspection.
In the Inspection Job section, click Create Now.
Basic Information
In the Basic Information step of the Create Intelligent Inspection Job wizard, configure the parameters and click Next. The following table describes the parameters.
Parameter | Description |
Job Name | The name of the intelligent inspection job. You can enter a custom name. |
Project | The project to which the source Logstore or Metricstore belongs. |
Region | The region where the project resides. |
Logstore Type | The storage unit in which your data is stored.
|
Source Logstore | The Logstore in which your source data is stored. This parameter is required only if you set the Logstore Type parameter to Logstores. |
Metricstores | The metricstore in which your source data is stored. This parameter is required only if you set the Logstore Type parameter to Metricstores. |
Role | The Alibaba Cloud Resource Name (ARN) of |
Target Store | The destination Logstore. This parameter is automatically set to |
Data Feature Settings
In the Data Feature Settings step, set the Data Type parameter to SQL Aggregation, enter a query statement, and then configure the parameters. For more information about query statements, see Log search overview and Log analysis overview.
Sample query statement
* | select __time__ - __time__ % 60 as time, domain, sum(request_size) as request_size from log group by time, domain limit 100000Entity:
domainFeature:
request_size
Parameter | Description |
Time | The field that specifies time in the source data. By default, Simple Log Service uses the |
Granularity | The interval at which data is observed. Unit: seconds. Valid values: 5 to 3600. We recommend that you set this parameter to a value that is no less than 60. |
Entity | The field that specifies an entity in the source data. The intelligent inspection job aggregates data to generate time series for the entity based on the specified field. |
Feature | The field that specifies a feature in the source data. |
Algorithm Configurations
In the Algorithm Configurations step, configure the Algorithm parameter. You can select Stream Graph Algorithm or Stream Decomposition Algorithm for this parameter. The following section describes the parameters that you must configure for different algorithms.
Stream Graph Algorithm
Parameter | Subparameter | Description |
(Required) Advanced Parameters | Time Series Segments | The number of segments into which the time series of the specified metric is discretized. The discretization helps you construct metric charts.
|
Observation Length | The number of historical samples that you want to inspect during anomaly detection.
| |
Period-over-period Comparison Length | The time length based on which period-over-period analysis is performed. Unit: days. Period-over-period analysis is performed on the detected metrics during anomaly detection. If you set this parameter to 0, the algorithm does not perform a period-over-period analysis. | |
Major Capture Type | The type of time series anomalies that require special attention. Valid values:
| |
Trees | The number of decision trees. The anomaly detection algorithm uses decision trees for auxiliary detection. | |
Sample Size per Tree | The number of samples that are collected from the observed data when constructing a decision tree during anomaly detection. | |
Overall Anomaly Rate | The estimated rate of anomalous data that is included in the time series data. Valid values: 0.001 to 0.01. | |
Minimum Window of Anomaly Type Check | The minimum length of the time series to be observed during anomaly capturing. | |
Maximum Window of Anomaly Type Check | The maximum length of the time series to be observed during anomaly capturing. | |
Minimum Window for Anomaly Confirmation | The minimum length of the time series to be detected during anomaly capturing. | |
Maximum Window for Anomaly Confirmation | The maximum length of the time series to be detected during anomaly capturing. | |
Single-dimension Feature Configuration | - | The features to be detected in the time series. You must separately configure the following items for each feature:
|
Notification Sensitivity Configuration | - | The threshold based on which alert notifications are triggered. You must configure different thresholds for anomalies detected in different periods of time. For example, you can ignore anomalies that occur during the scheduled weekly maintenance of the service. |
Stream Decomposition Algorithm
Configure an algorithm
Parameter
Subparameter
Description
Automatic Periodic Detection
-
Specifies whether to enable automatic periodic detection. Automatic periodic detection is suitable for scenarios in which time series data has seasonality. If the seasonality of the time series is constant, we recommend that you disable automatic periodic detection and manually configure the period length.
Periodic Detection Frequency
-
The frequency at which periodic detection is performed. This parameter takes effect only if you enable automatic periodic detection. The algorithm periodically updates the seasonality of the time series based on the configured frequency. For example, if you set the value to 12 hours, the algorithm automatically detects and updates the seasonality of the time series every 12 hours.
Period Length
-
The time length of the seasonality of the time series. This parameter takes effect only if you disable automatic periodic detection. If the time series has no seasonality, set the value to 0.
Observation Length
-
The length of time during which historical data is referenced during anomaly detection. If the time series has seasonality, we recommend that you set the value to three times the value of the Period Length parameter. For example, if you set the Period Length parameter to 1 day, set this parameter to 3 days.
Sensitivity
-
The detection sensitivity. The number of detected anomalies and the anomaly score linearly increase with the value of this parameter. If you set this parameter to a large value, the anomaly recall rate is high and the detection accuracy is low.
Advanced Parameters
Trend Component Sensitivity
The sensitivity of the trend component. The algorithm decomposes the time series into the trend component, seasonal component, and noise component. During the anomaly detection of the trend component, the number of detected anomalies and the anomaly score linearly increase with the sensitivity of the trend component. If you set this parameter to a large value, the anomaly recall rate is high and the detection accuracy is low.
Noise Sensitivity
The sensitivity of the noise component. The algorithm decomposes the time series into the trend component, seasonal component, and noise component. During the anomaly detection of the noise component, the number of detected anomalies and the anomaly score linearly increase with the sensitivity of the trend component. If you set this parameter to a large value, the anomaly recall rate is high and the detection accuracy is low.
Trend Component Sampling Step
The sampling step of the trend component. The algorithm decomposes the time series into the trend component, seasonal component, and noise component. If the length of the observed time series is excessively long, the analysis of the trend component is slow. If you set this parameter to a large value, the analysis of the trend component is fast. However, the detection accuracy of the trend component may be reduced. For example, if you set this parameter to 8, one data point out of every eight data points is sampled from the original time series for trend component analysis.
Seasonal Component Sampling Step
The sampling step of the seasonal component. The algorithm decomposes the time series into the trend component, seasonal component, and noise component. If the length of the observed time series is excessively long, the analysis of the seasonal component is slow. If you set this parameter to a large value, the analysis of the seasonal component is fast. However, the detection accuracy of the seasonal component may be reduced. For example, if you set this parameter to 8, one data point out of every eight data points is sampled from the original time series for seasonal component analysis. We recommend that you set this parameter to a value no greater than 5.
Window Length
If the length of the observed time series is excessively long, the anomaly detection is slow. After you specify this parameter, the algorithm detects data in segments in sliding windows to improve the detection speed. We recommend that you set this parameter to a value no greater than 5000. If you do not want the algorithm to detect data in sliding windows, set this parameter to 0.
In the preview section, click Show to view the configuration result of the algorithm.
Specify the time range during which detection is performed on the time series. Click Data Query to process the data within the specified time range and generate time series data by using the query statement that is configured in the Data Feature Settings step.
Configure the Entity Information and Feature parameters to determine the sequence of features to be detected. Click Preview to call the detection algorithm to process the specified feature sequence. The detection result is displayed in the lower part of the page. Click Display Parameters to display the configurations of the algorithm.
Trend Component Preview, Seasonal Component Preview, and Noise Preview are displayed in the detection result. You can change the anomaly thresholds for Trend Component Preview and Noise Preview. This way, alerts are generated only when the anomaly score is greater than the specified thresholds.
In the Scheduling Settings section, configure the parameters. The following table describes the required parameters. For information on optional parameters, see the instructions in the console.
Parameter | Description |
Start At | The start time of the time series whose data the algorithm processes. The system starts to read and detect time series data from the specified time. |
Data Latency | The maximum latency for writing time series data to be detected to Simple Log Service. After you configure this parameter, the system waits the specified period of time when reading time series data. This ensures that time series data is written to Simple Log Service and can be completely read. |
Alert configurations
In the Alert Configuration step of the Create Intelligent Inspection Job, configure the following parameters and click Complete.
Parameter
Description
Send Alert Notification
Choose whether to send an alert notification or not.
Alert Policy
Alert policies are used to merge, silence, and suppress alerts.
If you set this parameter to Simple Mode or Standard Mode, you do not need to configure an alert policy. By default, Simple Log Service uses the built-in alert policy sls.builtin.dynamic to manage alerts.
If you set this parameter to Advanced Mode, you can select a built-in or custom alert policy to manage alerts. For more information about how to create an alert policy, see Create an alert policy.
Action Policy
Action policies are used to manage alert notification methods and the frequency at which alert notifications are sent.
If you set Alert Policy to Simple Mode, you need to only configure an action group for this parameter.
After you configure an action group, Simple Log Service automatically creates an action policy named
Rule name-Action policy. Alert notifications are sent based on the action policy for all alerts that are triggered based on your alert rule. For more information, see Notification methods.ImportantYou can modify an action policy on the Action Policy tab. For more information, see Create an action policy. If you add conditions when you modify an action policy, the value of Alert Policy automatically changes to Standard Mode.
If you set Alert Policy to Standard Mode or Advanced Mode, you can select a built-in or custom action policy to send alert notifications. For more information about how to create an action policy, see Create an action policy.
If you set the Alert Policy parameter to Advanced Mode, you can enable or disable Custom Action Policy. For more information, see Dynamic action policy mechanism.
Manage intelligent inspection jobs
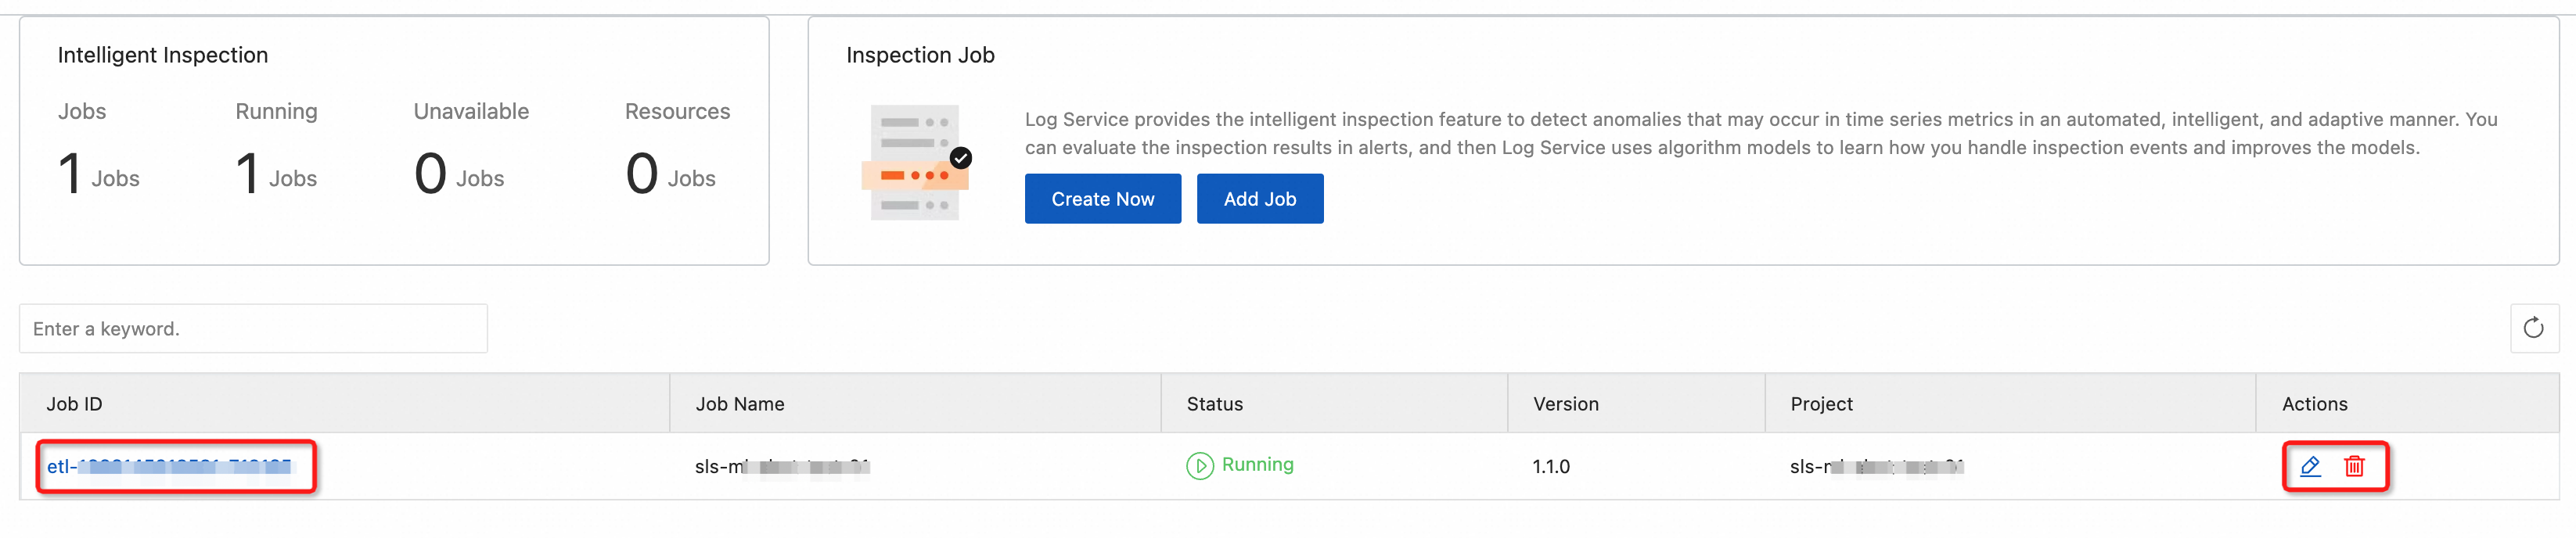
After you create an intelligent inspection job, you can click the job ID in the job list to view the details of the job. You can also modify or delete a job.
After you delete an intelligent inspection job, the job cannot be restored. Proceed with caution.