You can use a topology chart to understand system architectures, dependencies between services, and directions of data flows. This topic describes how to configure a topology chart.
Overview
A topology chart provides a global view that shows the dependencies between modules or applications and the overall information about topology data in an intuitive manner.
After topology data is collected to Simple Log Service, Simple Log Service parses and formats the data. The following figure provides an example of topology data. You can use the child and parent fields to obtain only nonintuitive dependencies between different modules or applications.
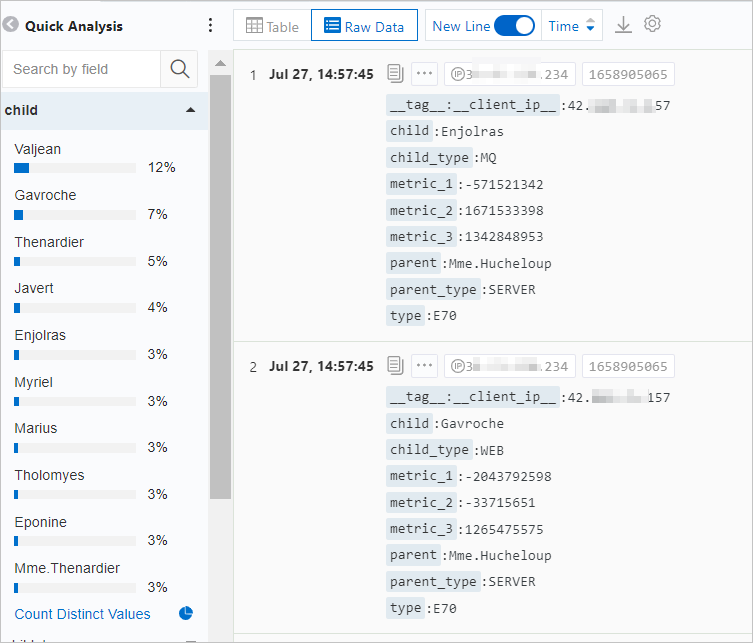
Simple Log Service allows you to query and analyze the fields that describe the dependencies based on the preceding topology data. For example, you can execute the * | SELECT child, parent, child_type, parent_type FROM log statement to obtain the child, child_type, parent, and child_type fields. After the fields are obtained, Simple Log Service generates a topology chart based on the fields and allows you to view the topology chart in the force-directed layout, hierarchical layout, or circular layout.
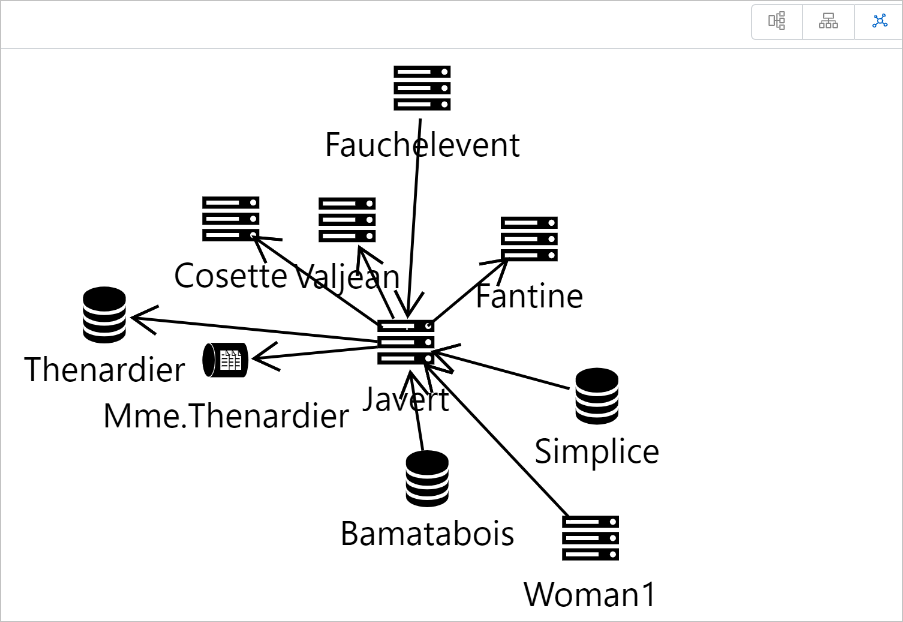
For more information about the entry point to add a topology chart, see Add a chart to a dashboard.
Configuration example
Log on to the Simple Log Service console. In the Projects section, click the project you want.
In the left-side navigation pane, choose Dashboard > Dashboards. In the dashboard list, click the dashboard you want. In the upper-right corner of the dashboard page, click Edit. In edit mode, click Add > Add Chart.

On the right side of the Edit Chart page, select Topology in the Chart Types section and configure parameters in the Topology Configuration and Layout Configuration sections based on the following figure. On the left side of the Edit Chart page, configure the query time range, Logstore, and query statement for the topology chart. After you complete the configuration, click Apply in the upper part of the Edit Chart page to view the configuration effects of the topology chart.
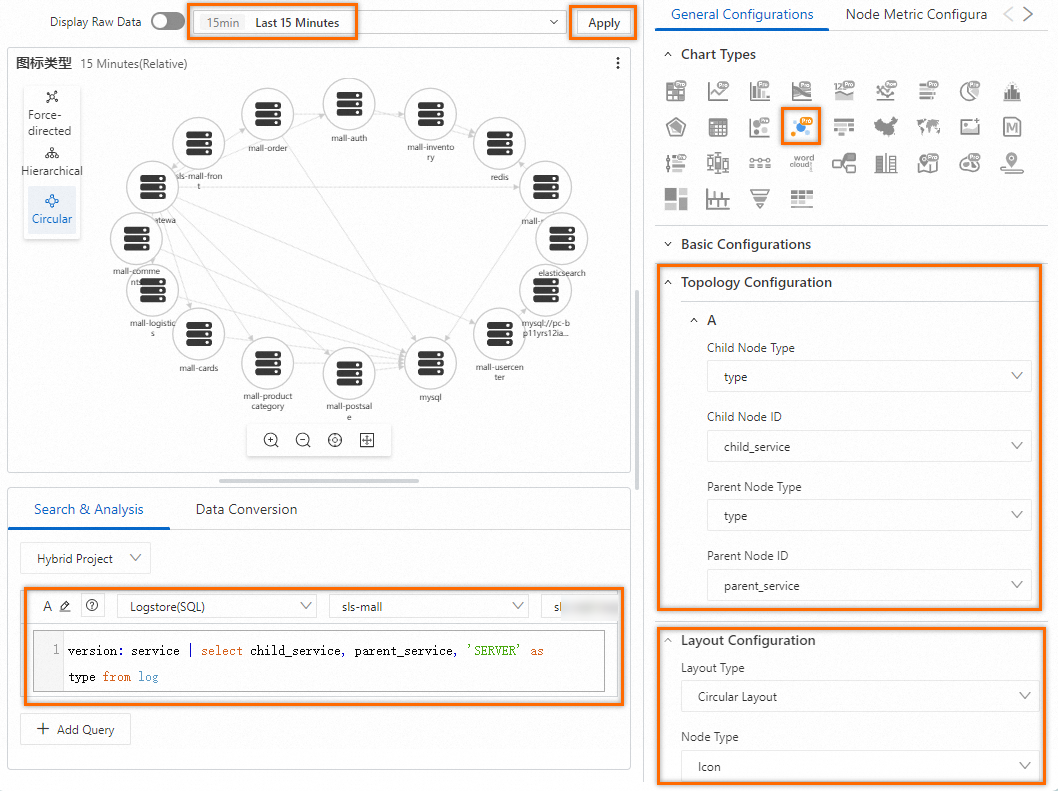
The following query statement is used to obtain the child_service, parent_service, and type fields. After the fields are obtained, Simple Log Service generates a topology chart based on the fields.
version: service | select child_service, parent_service, 'SERVER' as type from log
Configuration on the General Configurations tab
You can configure global settings for a topology chart on the General Configurations tab.
Basic Configurations
Parameter
Description
Title
The title of the chart.
Display Title
If you turn on Display Title, the title of the chart is displayed.
Display Border
If you turn on Display Border, the borders of the chart are displayed.
Display Background
If you turn on Display Background, the background color of the chart is displayed.
Display Time
If you turn on Display Time, the query time range of the chart is displayed.
Fixed Time
If you turn on Fixed Time, the query time range of the chart is independent of the global time range of the dashboard.
Parameters in the Topology Configuration section
Parameter
Description
Child Node Type
The field that specifies the child node type.
Child Node ID
The field that specifies the child node ID.
Parent Node Type
The field that specifies the parent node type.
Parent Node ID
The field that specifies the parent node ID.
NoteSimple Log Service topology charts provide icons that represent the following types of nodes: server, database, web, Message Queue (MQ), Server Load Balancer (SLB), Web Application Firewall (WAF), Object Storage Service (OSS), Alibaba Cloud DNS (DNS), switch, router, Android, iOS, and Windows.
If you do not configure the Child Node Type or Parent Node Type parameter, Simple Log Service displays nodes by using the icon for servers.
Parameters in the Variable Replacement section
Parameter
Description
Variable Replacement
The settings for variable replacement. You can click AddVariable Replacement to add a filter of the Variable Replacement type to the table. After you configure the settings for variable replacement on the General Configurations tab, Simple Log Service adds a filter in the upper-left corner of the table. You can select a value from the filter drop-down list. Then, Simple Log Service automatically replaces the variable in the query statement of the table with the variable value indicated by the value that you select, and performs a query and analysis operation. For more information, see Example 2: Configure variable replacement.
Configuration on the Node Metric Configuration tab
After you complete the settings on the General Configurations tab, Simple Log Service generates a topology chart. The topology chart displays only the dependencies between nodes. No metrics are displayed. In this case, you can configure settings on the Node Metric Configuration tab to add node metric information.
The following figure provides an example of metrics. In this example, the node field indicates a node. The node field corresponds to the child and parent fields in topology data. You can associate metrics with topology data by using the node field to add node metric information for the topology chart.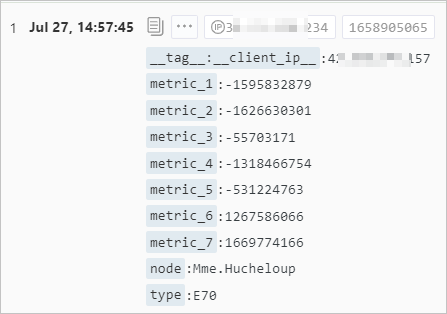
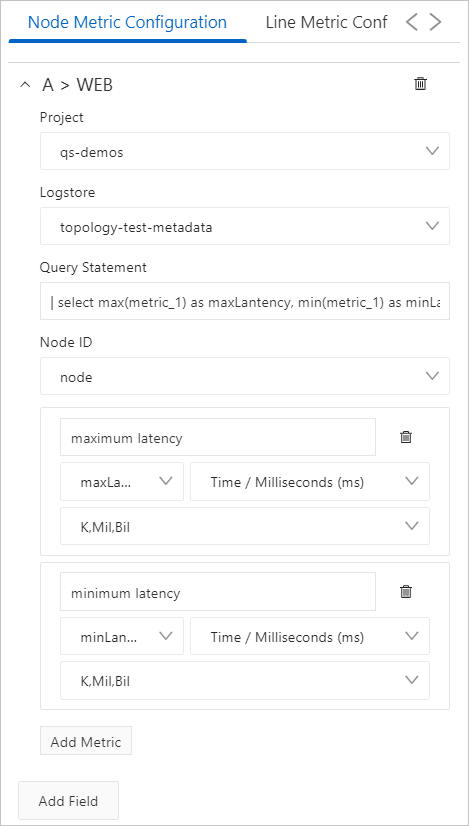
Simple Log Service allows you to configure different metrics for different types of nodes. In this example, A > WEB is used, which indicates a web node.
In the A > WEB section, select the project and Logstore in which the metrics are stored, enter a query statement to obtain the metric fields, and then configure the settings for the metric fields. For example, the metric_1 field indicates the latency of a node. You can execute the * | SELECT max(metric_1) AS maxLantency, min(metric_1) AS minLantency, node FROM log GROUP BY node statement to calculate the maximum and minimum values of the metric_1 field to obtain the maximum latency and minimum latency of the node.
After the settings are complete, you can move the pointer over the node in the topology chart to view the metric information of the node. If you click this node, Simple Log Service hides unrelated nodes and connection lines.
Configuration on the Line Metric Configuration tab
The dependencies between nodes in a topology chart are determined by analytic statements and fields. Different types of connection lines correspond to different analytic statements. If you want to configure a connection line metric, you must include a field that specifies the connection line metric in a query statement that is used to obtain node metric information.
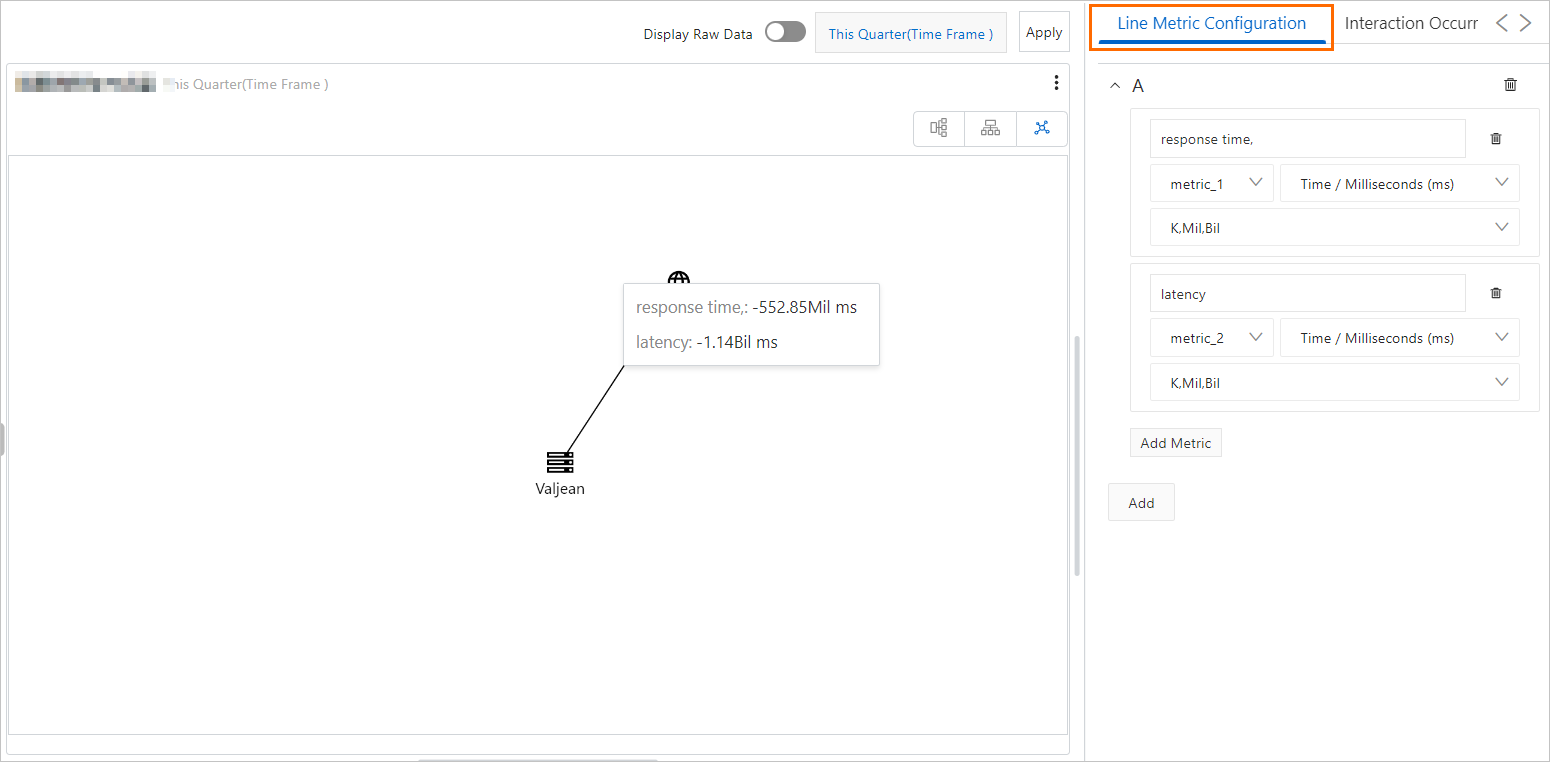
Topology data contains connection line metrics. For example, in topology data, the metric_1 field indicates the response time and the metric_2 field indicates the latency. You can execute Query Statement A to obtain the metric_1 and metric_2 fields and configure the settings for the fields on the Line Metric Configuration tab.
After the settings are complete, you can move the pointer over the connection line in the topology chart to view the metrics of the connection line. If you click this connection line, Simple Log Service hides unrelated nodes and connection lines.
Configuration on the Interaction Occurrences tab
You can configure an interaction occurrence for a topology chart to analyze a node in a finer-grained manner. Supported types of interaction occurrences include Open Logstore, Open Saved Search, Open Dashboard, Open Trace Analysis, Open Trace Details, and Create Custom HTTP URL. For more information, see Interaction occurrences.
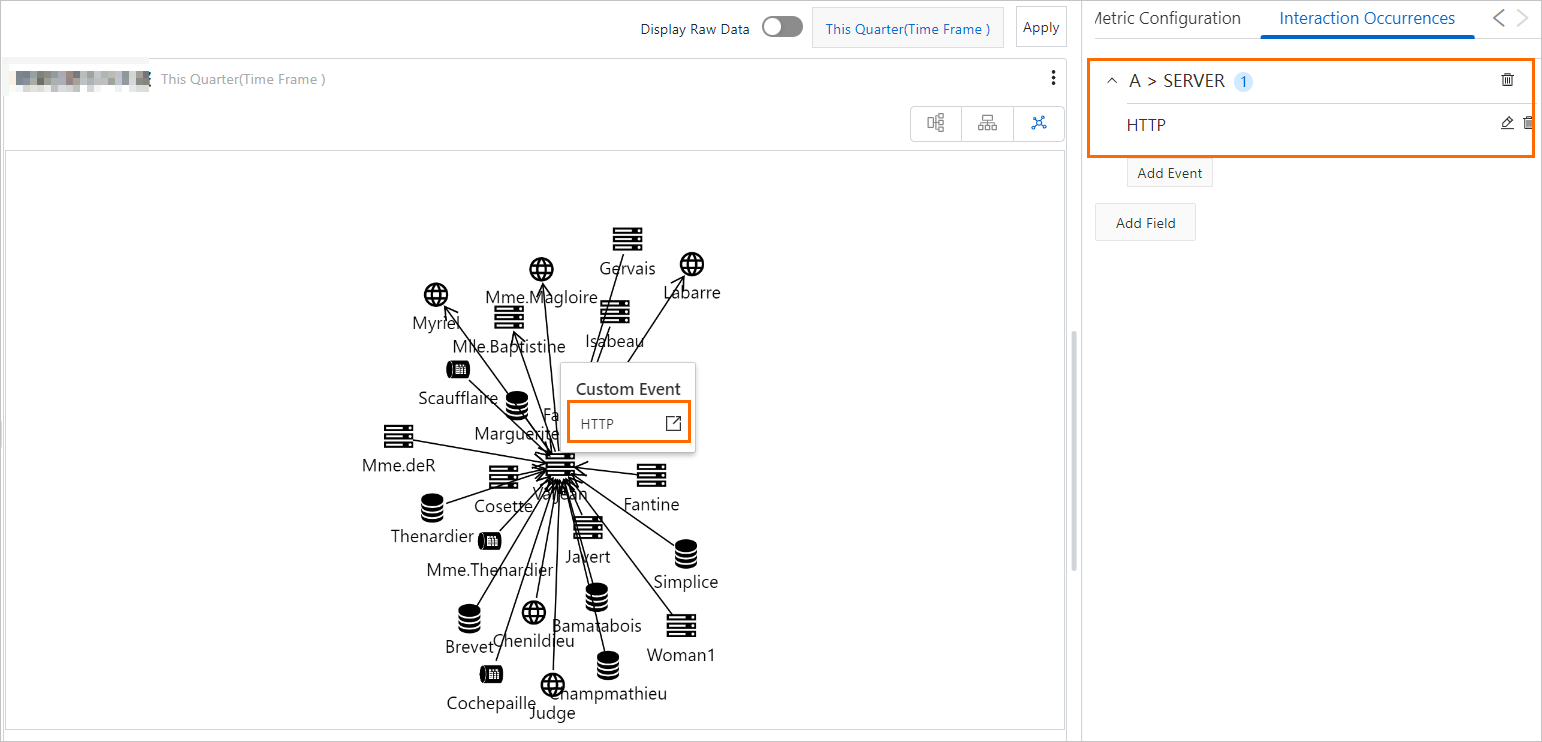
For example, you can select A > SERVER to configure a Create Custom HTTP URL interaction occurrence for a server node in the results of Query Statement A. After you configure the interaction occurrence, you can right-click the server node in the topology chart and choose Create Custom HTTP URL. Then, you are navigated to the link that you specify.
