This topic describes how to import a dashboard within the same Alibaba Cloud account and across multiple Alibaba Cloud accounts. This topic also describes how to import a Grafana dashboard to Simple Log Service and how to import a Simple Log Service dashboard to Grafana.
Import a dashboard within the same Alibaba Cloud account
In the upper-right corner of the Dashboard section, choose .
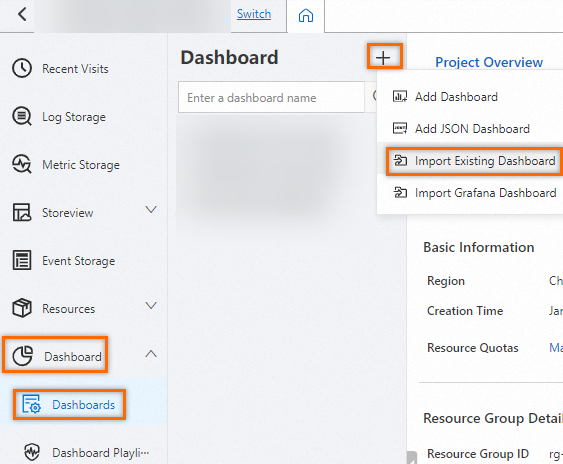
-
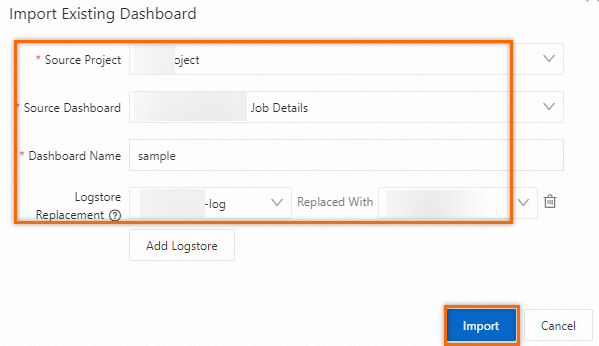
In the Import Existing Dashboard dialog box, configure the following parameters and click Import. After the dashboard is imported, you are navigated to the dashboard page. The following table describes the parameters.
Parameter
Description
Source Project
Select the project to which the source dashboard belongs.
NoteYou can select the current project or a different project.
Source Dashboard
Select the source dashboard.
Dashboard Name
Enter a name for the new dashboard.
Logstore Replacement
If the new dashboard depends on a Logstore in the current Project, you can map the source Logstore to a Logstore in the current Project. You can add multiple Logstore mappings.
Import a dashboard across Alibaba Cloud accounts
1. Obtain the JSON file of a dashboard
Open a dashboard. In the upper-right corner of the dashboard page, click Edit to enter the edit mode. For more information, see Edit mode.
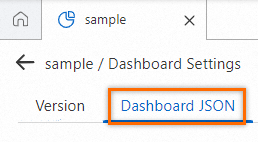
In edit mode, click the
 icon. On the Dashboard JSON tab of the Dashboard Settings page, copy the JSON-formatted content.
2. Add a JSON dashboard
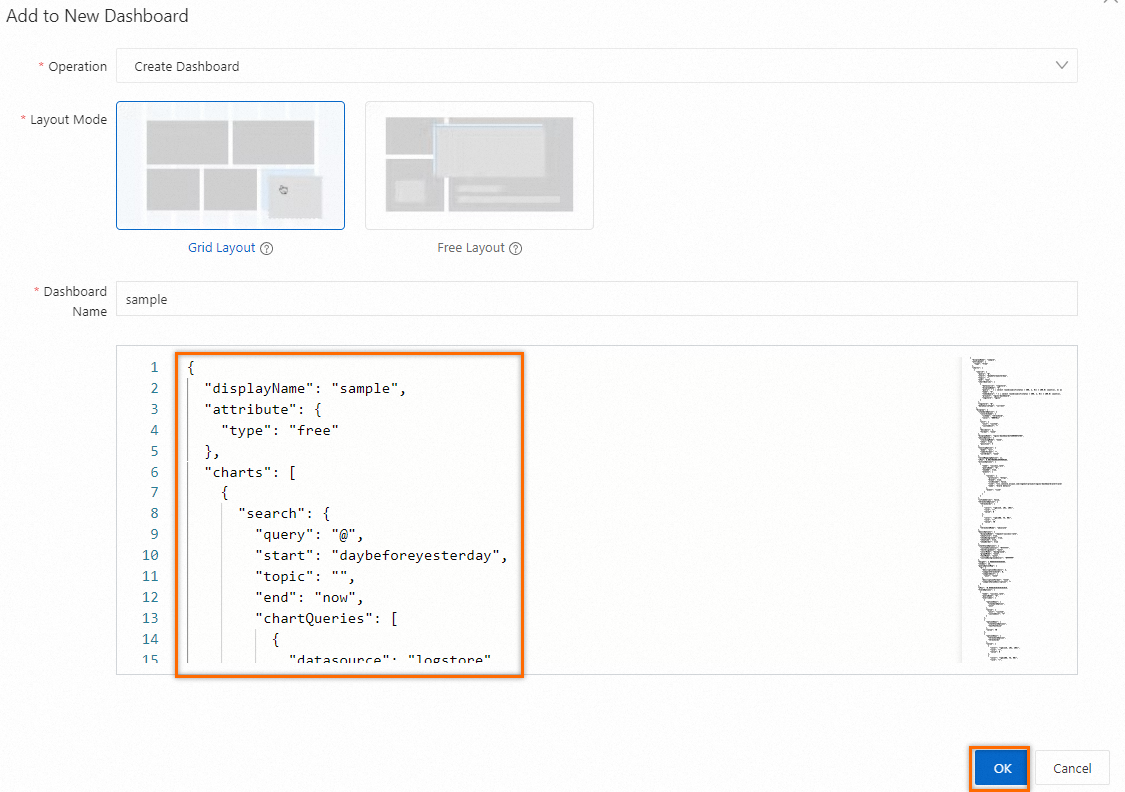
In the upper-right corner of the Dashboard section, choose .
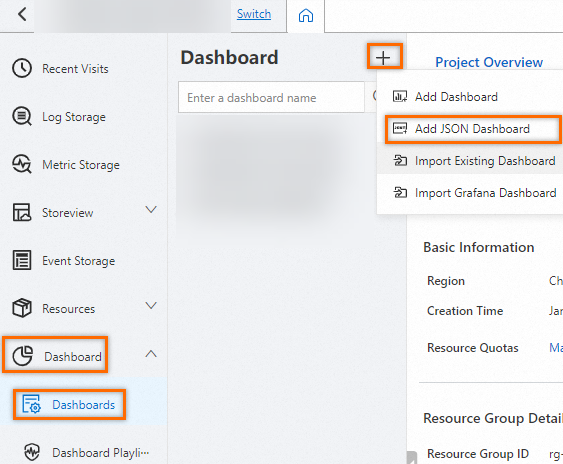
In the Add to New Dashboard dialog box, paste the JSON-formatted content and click OK. After the dashboard is added, you are navigated to the dashboard page.
Export a Simple Log Service dashboard and import the dashboard to Grafana
Prerequisites
Grafana 8.0.0 or later is installed. For more information, see the Grafana documentation.
NoteIn this topic, Grafana 9.2.4 is used.
If you install Grafana on your computer, you must enable port 3000 in your browser settings.
The Simple Log Service plug-in of version 2 is installed. For more information, see Connect to Grafana.
If the Convert to Grafana Dashboard tab is not displayed on the page of your Simple Log Service dashboard, submit a ticket to add the dashboard to the whitelist.
If you want to use pie charts, run the
grafana-cli plugins install grafana-piechart-panelcommand to install the pie chart plug-in.If a message indicating a conversion error appears, handle the error based on the message. Otherwise, chart elements may not be displayed as expected.
Limits
Grafana does not support the free layout provided by Simple Log Service. After you convert a free-layout Simple Log Service dashboard to a Grafana dashboard, the dashboard layout is disordered.
If specific settings such as the x-axis or y-axis setting are missing, chart display issues may occur. In this case, you must check the parameter settings in the Query and Analysis Configurations section.
Simple Log Service provides single value charts that allow you to configure various features such as interval-valued comparison, periodicity-valued comparison, and customization. However, Grafana supports only numeric values that are displayed in the charts for conversion.
Grafana supports less table settings than Simple Log Service. Specific table settings that Simple Log Service supports are incompatible with Grafana. For example, you cannot configure mini line charts, mini column charts, custom interaction occurrences, or filters for Grafana tables.
The details of chart styles such as line types and custom settings are not supported for conversion. After you import a Simple Log Service dashboard, the details of chart styles are displayed based on the default settings of Grafana.
Features such as data conversion, interaction occurrences, and field settings that are supported in Simple Log Service cannot be implemented in the same manner in Grafana.
1. Generate and export Grafana-compliant JSON-formatted content
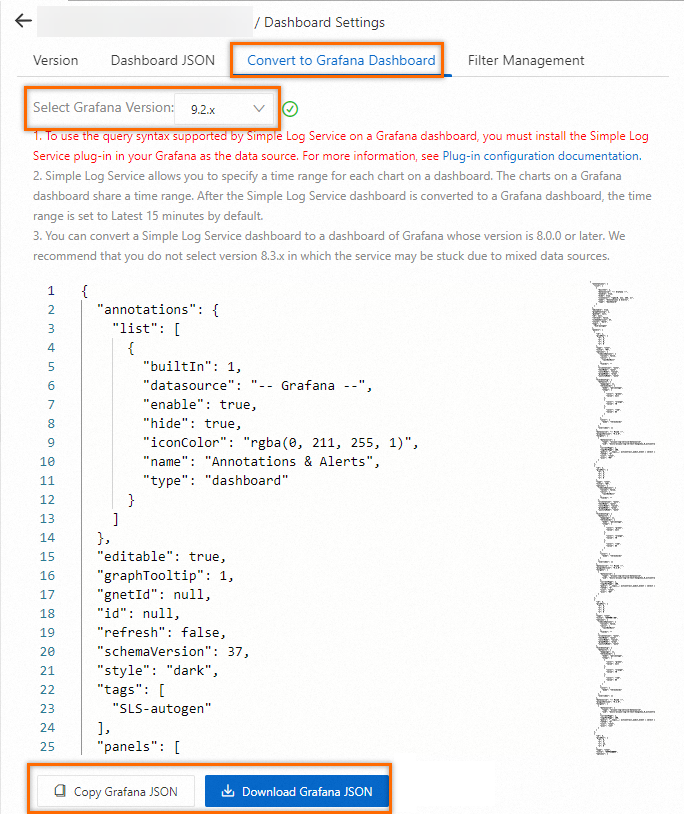
In the dashboard list, click the dashboard that you want to manage and choose .
On the Convert to Grafana Dashboard tab, select the version of Grafana that you use. Click Copy Grafana JSON or Download Grafana JSON to obtain the JSON-formatted content.
2. Import the Simple Log Service dashboard to Grafana
Log on to Grafana.
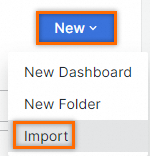
In the left-side navigation pane, choose . On the dashboard page, choose .
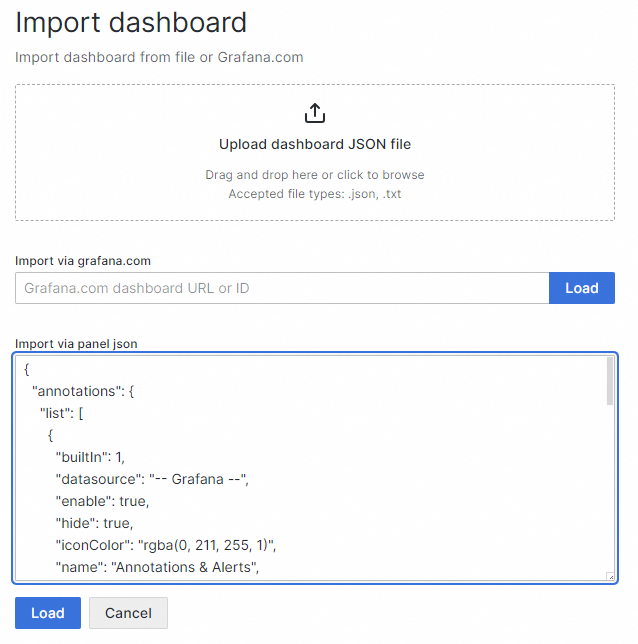
Click Upload dashboard JSON file to import the JSON file or enter the JSON-formatted content in the Import via panel json field. Then, click Load.
In the Options step, complete the following operations.
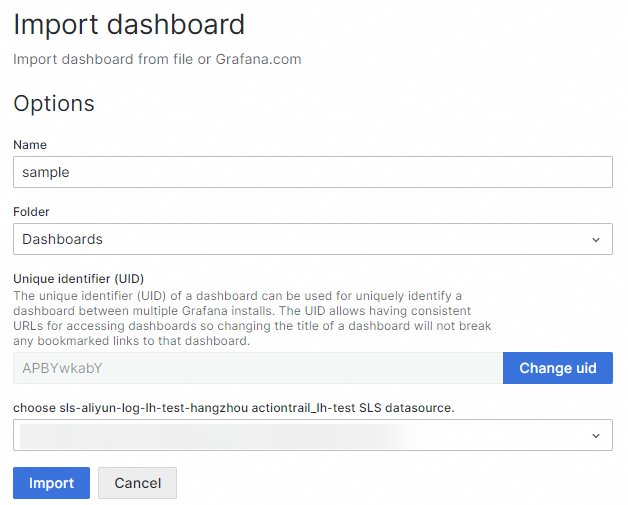
Specify a name for the dashboard.
Select a folder in which you want to store the dashboard.
Select a data source for the dashboard.
Click Import.
View the dashboard on the dashboard page after the dashboard is imported.
Conversion scope
Export a Grafana dashboard and import the dashboard to Simple Log Service
Prerequisites
Grafana 8.0.0 or later is installed. For more information, see the Grafana documentation.
In this topic, Grafana 9.2.4 is used.
ImportantIf you install Grafana on your computer, you must enable port 3000 in your browser settings.
The Simple Log Service plug-in of version 2 is installed. For more information, see Install the Simple Log Service plug-in.
If you want to use pie charts, run the
grafana-cli plugins install grafana-piechart-panelcommand to install the pie chart plug-in.
Limits
When you import a Grafana dashboard, the Prometheus data source is not supported by the variables of the Grafana dashboard. You must use log-service-datasource.
The details of chart styles such as line types and custom settings are not supported for conversion. After you import a Grafana dashboard, the details of chart styles are displayed based on the default settings of Simple Log Service.
Features such as Transform, Expression, Annotations, Links, and Permissions that are supported in Grafana cannot be implemented in the same manner in Simple Log Service.
1. Obtain the JSON file of a Grafana dashboard
Log on to Grafana.
In the left-side navigation pane, choose .
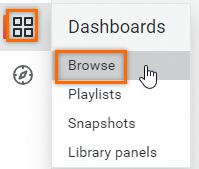
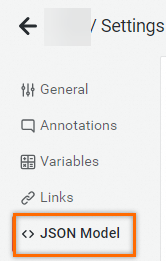
In the dashboard list, find and click the dashboard that you want to manage. In the upper-right corner of the dashboard page, click the
 icon. In the left-side navigation pane of the Settings page, click JSON Model. Copy the JSON-formatted content and save the content as a JSON file or copy the content to the clipboard.
2. Import the Grafana dashboard
In the upper-right corner of the Dashboard section, choose .
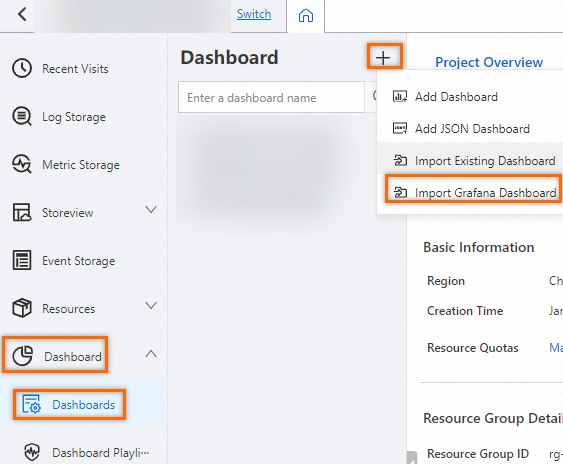
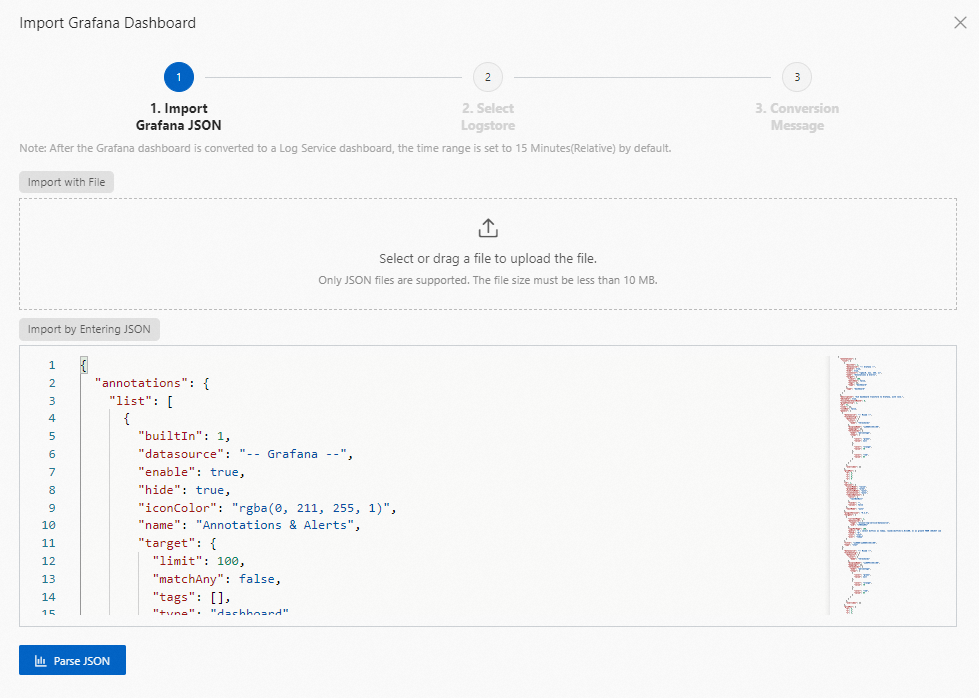
In the Import Grafana JSON step, import the JSON file or enter the JSON-formatted content and click Parse JSON.
-
In the Select Logstore step, complete the following operations.
Simple Log Service automatically parses the data source ID or name from the JSON content. You can use this information to find the associated Project and Logstore.
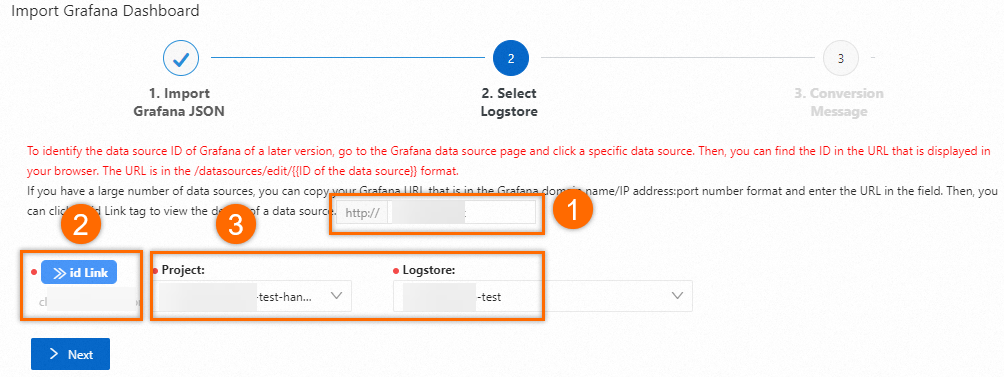
In the http:// field, enter
Grafana IP address:Port.-
Click id Link.
You are redirected to the Grafana data source settings page, where you can view the associated Simple Log Service Project and Logstore. Whether a data source ID or name is displayed depends on your Grafana version. This topic uses the data source ID as an example.
-
Select the target Project and Logstore, and then click Next.
In the Conversion Message step, confirm that an error-free message appears and click Generate Dashboard.
One of the following messages may appear: a conversion incompatibility message, an error message, an invalid format message, and an error-free message.

View the dashboard on the dashboard page after the dashboard is imported.
