You can use Logtail plug-ins to collect Windows event logs. This topic describes how to create a Logtail configuration that is used to collect Windows event logs in the Simple Log Service console.
Prerequisites
Logtail V1.0.0.0 or later is installed on a Windows server. For more information, see Install Logtail on a Windows server.
The server from which you want to collect logs continuously generates logs.
ImportantLogtail collects only incremental logs. If a log file on a server is not updated after the applied Logtail configuration is delivered to the server, Logtail does not collect logs from the file. For more information, see Read log files.
Implementation
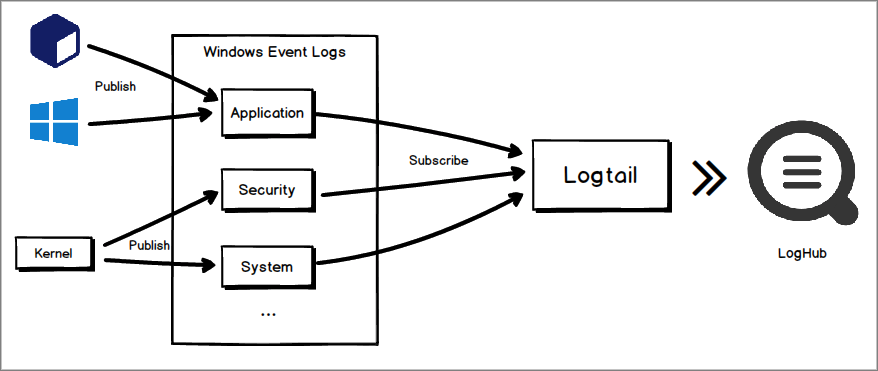
To obtain event logs, Windows operating systems provide Windows Event Log API and Event Logging API. Windows Event Log API is an upgraded version of Event Logging API and is provided only in the Windows Vista operating system or later. For more information, see Windows Event Log and Event Logging. Logtail plug-ins automatically select an API based on the operating system to obtain Windows event logs. Windows Event Log API is preferentially selected.
The publish-subscribe model is used to collect Windows event logs. An application or kernel publishes event logs to a specified channel, such as an application, security, or system channel. Logtail uses the required plug-in to call Windows Event Log API or Event Logging API to subscribe to the channel. This way, Logtail can continuously collect event logs and send the logs to Simple Log Service.
Logtail allows you to collect event logs from multiple channels at a time. For example, you can collect event logs from the application and system channels at a time.
View the information about a channel
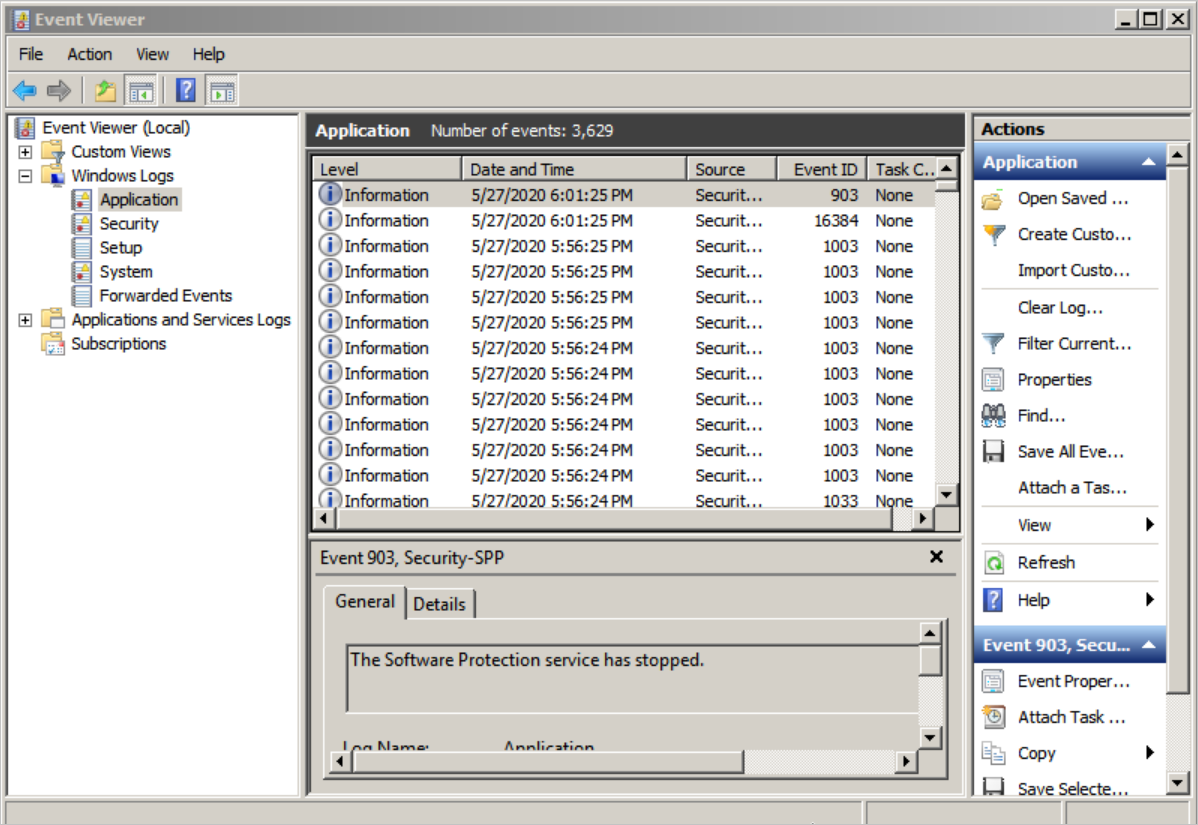
You can view the information about a channel in the Event Viewer window of your Windows server.
Click Start.
Search for and click Event Viewer. The Event Viewer window appears.
In the left-side navigation pane, expand Windows Logs.
View the full name of a channel.
Right-click a channel below Windows Logs and select Properties. In the window that appears, you can view the full name of the channel. The following channels are provided:
Application
Security
Setup
System
View the information about a channel.
Click the channel below Windows Logs. Then, you can view Level, Date and Time, Source, and Event ID of each event.
In a Logtail configuration, you can filter logs based on the preceding information.
Procedure
Log on to the Simple Log Service console.
In the Import Data section, click Windows Event Logs.
Select the project and Logstore. Then, click Next.
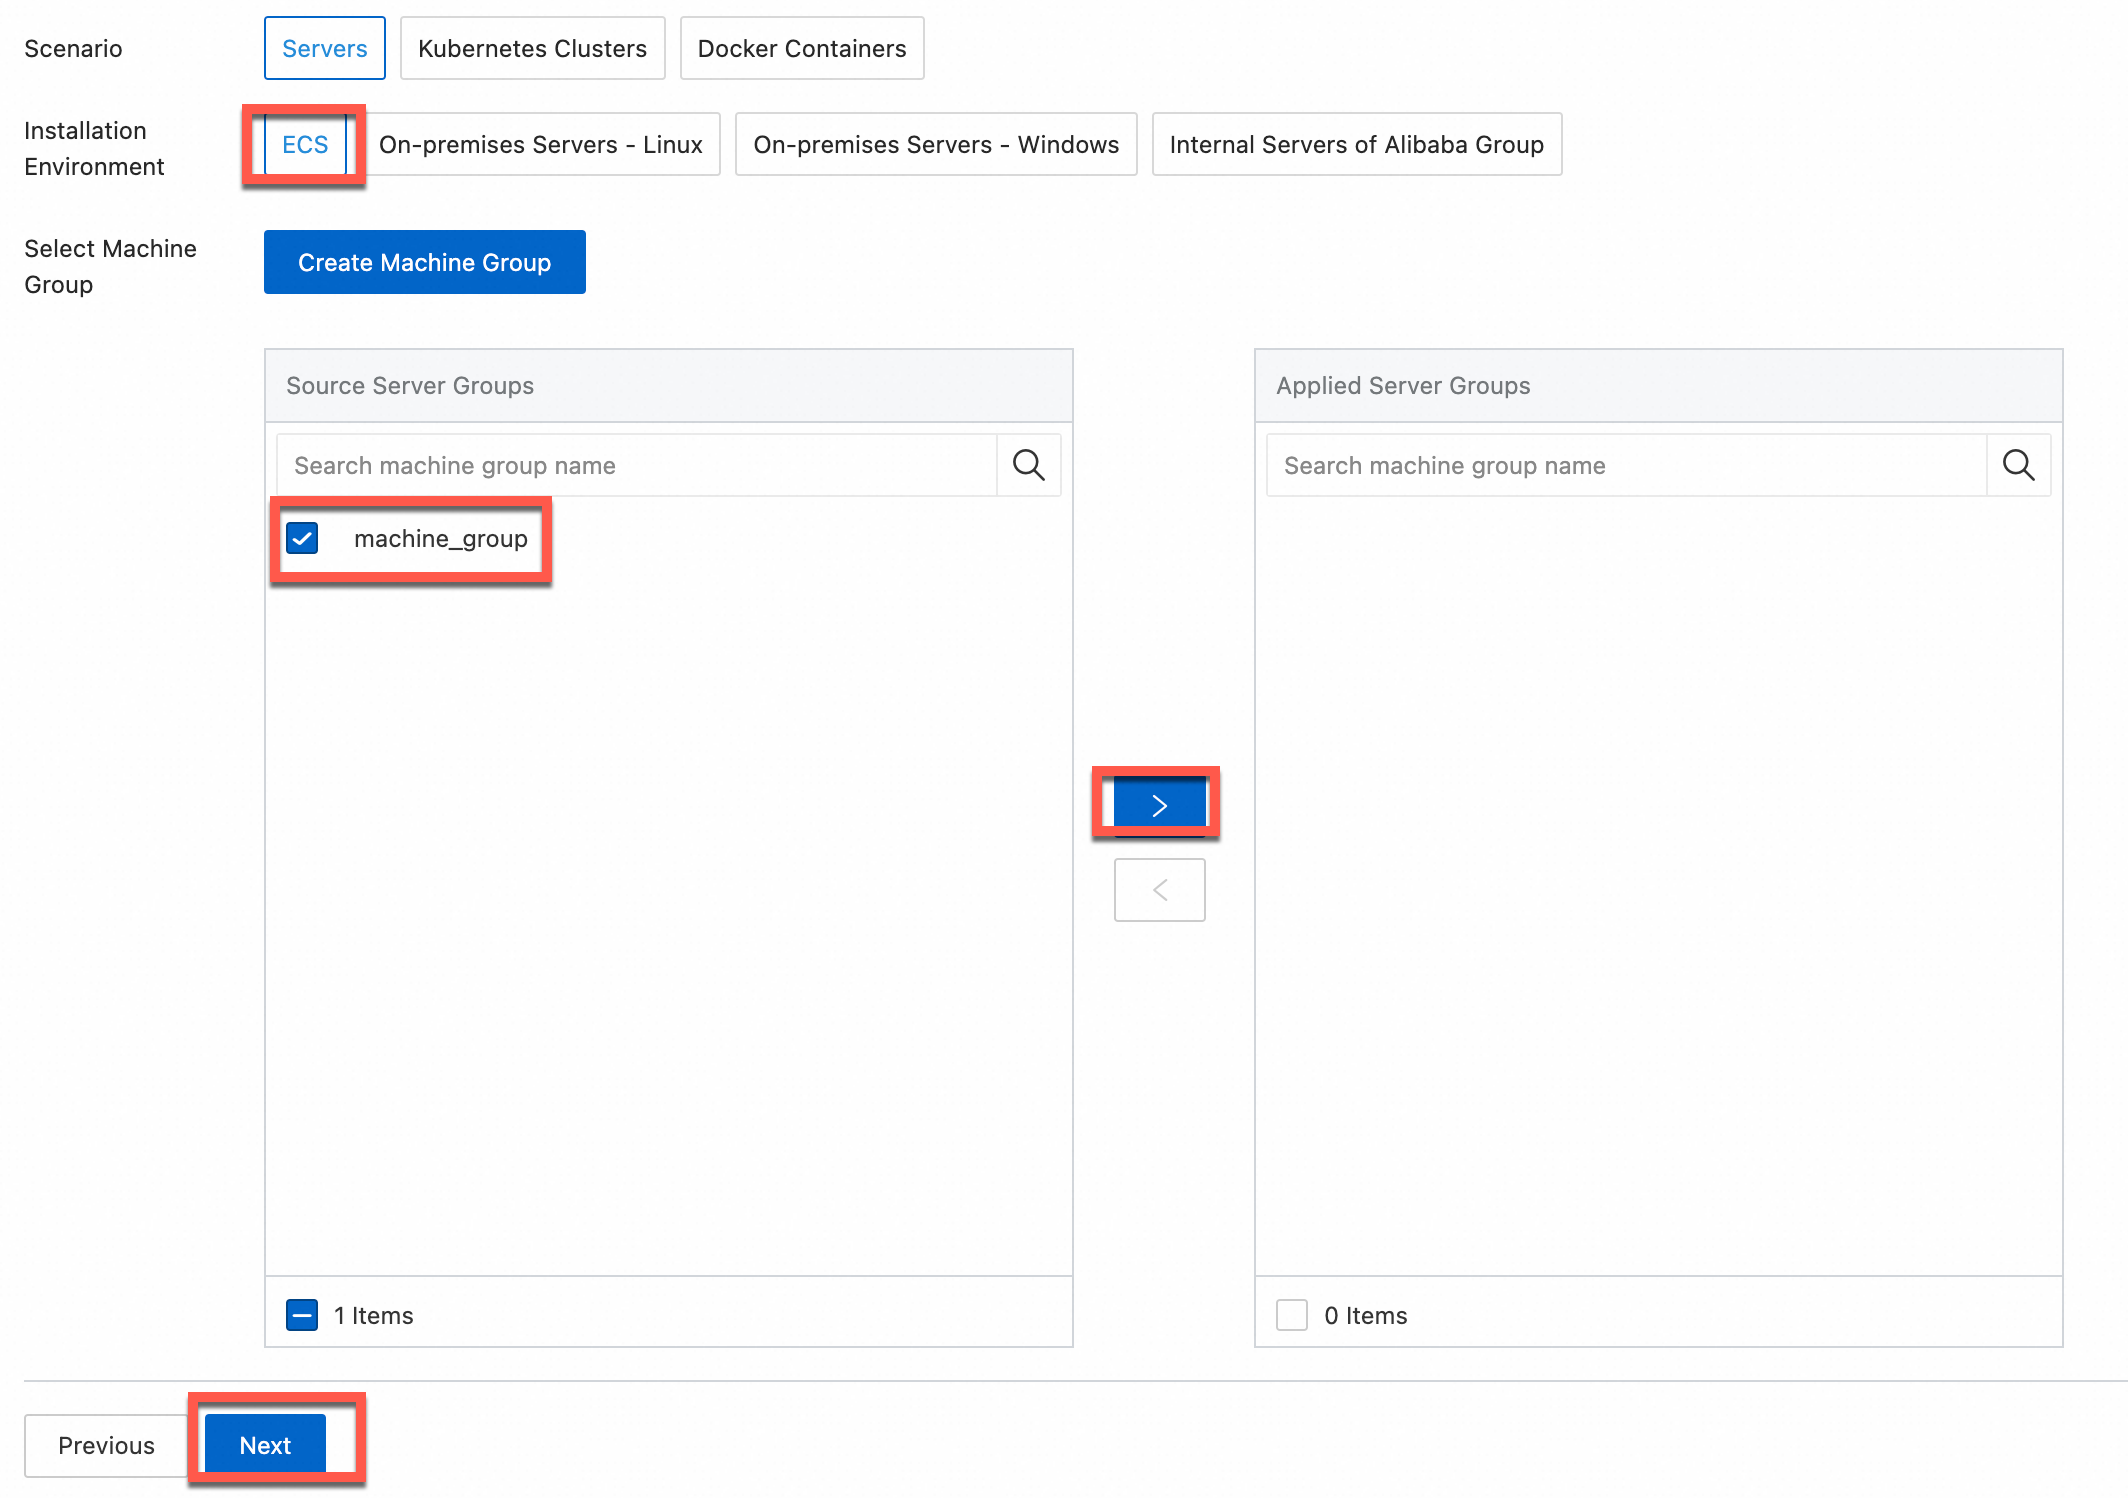
In the Machine Group Configurations step, configure a machine group.
Configure the Scenario and Installation Environment parameters based on your business requirements.
ImportantYou must configure the Scenario and Installation Environment parameters regardless of whether a machine group is available. The parameter settings affect subsequent configurations.
Make sure that a machine group is displayed in the Applied Server Groups section and click Next.
Machine group available
Select a machine group from the Source Machine Group section.
No machine group available
Click Create Machine Group. In the Create Machine Group panel, configure the parameters. You can set the Machine Group Identifier parameter to IP Address or Custom Identifier. For more information, see Create a custom identifier-based machine group or Create an IP address-based machine group.
ImportantIf you apply a machine group immediately after you create the machine group, the heartbeat status of the machine group may be FAIL. This issue occurs because the machine group is not connected to Simple Log Service. To resolve this issue, you can click Retry. If the issue persists, see What do I do if no heartbeat connections are detected on Logtail?
In the Configure Data Source step, set the Configuration Name and Plug-in Configuration parameters, and then click Next.
inputs is required and is used to configure the data source settings for the Logtail configuration.
ImportantYou can specify only one type of data source in inputs.
processors is optional and is used to configure the data processing settings for the Logtail configuration to parse data. You can specify one or more processing methods.
If your logs cannot be parsed based only on the setting of inputs, you can configure processors in the Plug-in Configuration field to add plug-ins for data processing. For example, you can extract fields, extract log time, mask data, and filter logs. For more information, see Use Logtail plug-ins to process data.
Create indexes and preview data. Then, click Next. By default, full-text indexing is enabled in Simple Log Service. You can also manually create field indexes for the collected logs or click Automatic Index Generation. Then, Simple Log Service generates field indexes. For more information, see Create indexes.
ImportantIf you want to query all fields in logs, we recommend that you use full-text indexes. If you want to query only specific fields, we recommend that you use field indexes. This helps reduce index traffic. If you want to analyze fields, you must create field indexes. You must include a SELECT statement in your query statement for analysis.
Click Log Query. You are redirected to the query and analysis page of your Logstore.
You must wait approximately 1 minute for the indexes to take effect. Then, you can view the collected logs on the Raw Logs tab. For more information, see Guide to log query and analysis.
Troubleshooting
If no data is displayed on the preview page or query page after logs are collected by using Logtail, you can troubleshoot the errors based on the instructions that are provided in What do I do if errors occur when I use Logtail to collect logs?
What to do next
After Windows event logs are collected to Simple Log Service, you can view the logs in the Simple Log Service console. 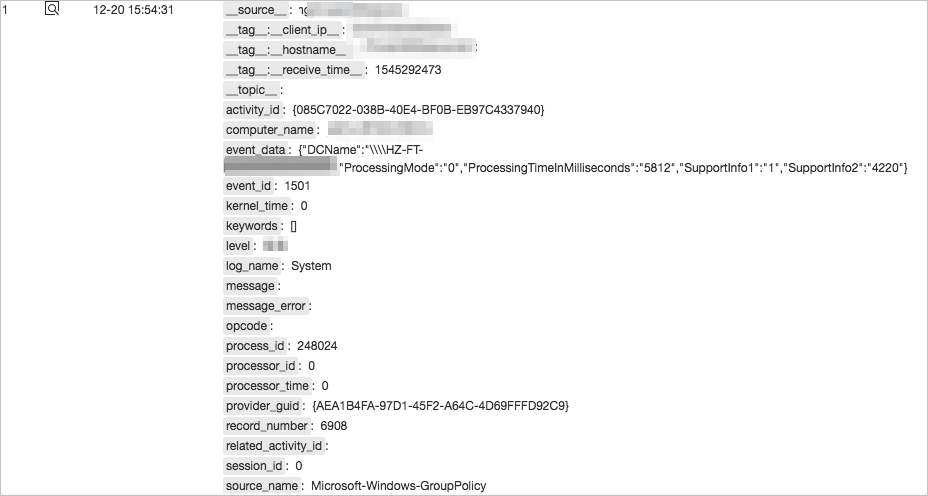
Log field | Description |
activity_id | The global transaction identifier (GTID) of the transaction to which the event belongs. Events that belong to the same transaction use the same GTID. |
computer_name | The name of the server on which the event is generated. |
event_data | The data that is related to the event. |
event_id | The ID of the event. |
kernel_time | The kernel time that is consumed by the event. In most cases, the value is 0. |
keywords | The keyword that is associated with the event. Keywords are used to classify events. |
level | The level of the event. |
log_name | The name of the channel from which the logs of the event are collected. The value of this field is the same as the value of the Name parameter that is specified in your Logtail configuration. |
message | The message that is associated with the event. |
message_error | The error that occurred when the message associated with the event was parsed. |
opcode | The operation code that is associated with the event. |
process_id | The process ID of the event. |
processor_id | The processor ID that is associated with the event. In most cases, the value is 0. |
processor_time | The processor time that is consumed by the event. In most cases, the value is 0. |
provider_guid | The GTID of the event source. |
record_number | The record number that is associated with the event. The record number increases when an event is written to Simple Log Service. If the number exceeds 2 32 for Event Logging API or 2 64 for Windows Event Log API, the record number starts from 0 again. |
related_activity_id | The GTID of another transaction that is associated with the transaction to which the event belongs. |
session_id | The session ID of the event. In most cases, the value is 0. |
source_name | The source of the event. The value of this field is the same as the value of the Provider parameter that is specified in your Logtail configuration. |
task | The task that is associated with the event. |
thread_id | The thread ID of the event. |
type | The API that is used to obtain the event. |
user_data | The user data that is associated with the event. |
user_domain | The user domain that is associated with the event. |
user_identifier | The Windows security identifier of the user that is associated with the event. |
user_name | The username that is associated with the event. |
user_time | The time that is consumed by the event in user mode. In most cases, the value is 0. |
user_type | The user type that is associated with the event. |
version | The version of the event. |
xml | The raw information of the event. The information is in the XML format. |