SLS evaluates query results at your configured check frequency, fires alerts when trigger conditions are met, and routes them through your alert and action policies for noise reduction and notification.
Prerequisites
-
You have collected data.
You can collect logs and metric data.
ImportantBefore you can create an alert rule based on a query statement, you must store logs in a Standard logstore. For more information, see Manage a logstore.
-
If you collect logs, you must create an index.
Procedure
Log on to the Simple Log Service console.
In the Projects section, click the one you want.

On the tab, click the logstore you want.
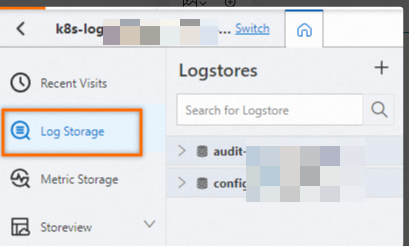
On the query and analysis page, click the
 icon.
icon. 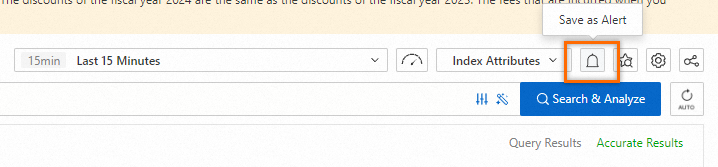
-
In the Alert Monitoring Rule panel, configure the following parameters and click OK.
Parameter
Description
Rule Name
The name of the alert rule.
Check Frequency
How often SLS checks query and analysis results.
-
Hourly: Checks query and analysis results every hour.
-
Daily: Checks query and analysis results daily at a specified time.
-
Weekly: Checks query and analysis results weekly on a specified day and time.
-
Fixed Interval: Checks query and analysis results at a fixed interval.
-
Cron: Checks query and analysis results based on a Cron expression.
NoteCron expressions use a 24-hour clock with minute-level precision. Examples:
-
0/5 * * * *: Checks every 5 minutes, starting from minute 0. -
0 0/1 * * *: Checks every hour, starting from 00:00. -
0 18 * * *: Checks at 18:00 every day. -
0 0 1 * *: Checks at 00:00 on the first day of every month.
Cron expression syntax: Cron jobs.
-
Query statistics
Click the input box to open the Query statistics dialog box and configure a query and analysis statement.
-
Associated report tab: Select a dashboard to monitor.
-
Advanced Settings tab:
-
From the Type list, select a data source type:
-
Logstore: Stores logs. Quick start for query and analysis.
-
Metricstore: Stores metric data. Query and analyze metric data.
-
Resource Data: External data linked to a specific alert rule. Create resource data.
-
-
If you select Logstore or Metricstore for Type and specify a query and analysis statement, you can enable Dedicated SQL. High-performance and high-accuracy query and analysis (Dedicated SQL).
-
Auto: Dedicated SQL is off by default. If a concurrency limit is reached or results are imprecise, SLS automatically retries with Dedicated SQL.
-
Enable: Uses Dedicated SQL for all queries and analyses.
-
Close: Disables Dedicated SQL.
-
-
For multiple queries, use Set operations to correlate results. Configure query statements.
Group evaluation
Groups query and analysis results. Configure group evaluation.
-
Custom label: SLS groups query and analysis results by the fields you specify. The trigger condition is evaluated per group, generating an alert for each matching group per check interval.
You can specify multiple fields.
-
No grouping: Generates one alert per check interval when the trigger condition is met.
-
Auto label: Available when Metricstore is selected in Query statistics. SLS automatically groups results by labels.
The trigger condition is evaluated per group, generating an alert for each matching group per check interval.
Trigger Condition
Set the condition that triggers an alert and its severity.
-
Trigger condition
-
Data exists: Triggers an alert if query results contain data.
-
A specific number of data rows exists: Triggers an alert if the number of data rows in query results is N.
-
Data matches expression: Triggers an alert if query results contain data matching the expression.
-
A specific number of data rows match expression: Triggers an alert if N data rows in query results match the expression.
-
-
Severity
Use severity-based conditions in alert and action policies for noise reduction and notification routing. Configure alert severity.
-
Simple: Select a severity. All alerts from this rule share the same severity.
-
Conditional: Click Add to set different severities based on specific conditions.
-
Alert condition expression syntax: Syntax for alert condition expressions.
Add Tag
Key-value attributes that identify alerts. Use label-based conditions in alert and action policies for noise reduction and notification routing. Add labels and annotations.
Add Annotation
Key-value metadata attached to alerts. Use annotation-based conditions in alert and action policies for noise reduction and notification routing. Add labels and annotations.
Enable Auto-add annotations to automatically attach fields such as __count__ to alerts. Automatic annotations.
Recovery Notification
When the Recovery Notification switch is enabled, a recovery notification is sent when an alert is resolved. For example, if CPU usage exceeds 95% and later drops to 95% or below, SLS sends a recovery notification. Configure a recovery notification.
Advanced settings > Consecutive trigger threshold
Number of consecutive checks that must meet the trigger condition before an alert fires. Non-matching checks do not count.
Advanced settings > No-data alert
When No-data alert is enabled, an alert fires if consecutive no-data checks exceed the Threshold of Continuous Triggers. For multiple queries, this applies to the post-set-operation result. No-data alert.
Destination
Select one or more destinations for alert events.
-
Eventstores: Writes alert events to an Eventstore.
-
CloudMonitor Event Center: Sends alerts to CloudMonitor Event Center for management and notification.
-
SLS notification: Routes alerts through the SLS notification service using alert and action policies.
Destination - Eventstore
-
Enable: Turn on to write alerts to the specified Eventstore.
-
Region: Region of the destination Eventstore.
-
Project: Project of the destination Eventstore.
-
Eventstores: Target Eventstore for alert events.
-
Authorization Method:
-
Default Role: Click Authorize Now to authorize AliyunLogETLRole to write alerts to the destination Eventstore. Grant permissions to a default role.
-
Custom Role: Uses a custom role to write alerts to the Eventstore. Enter the role ARN. Grant permissions to a custom role.
-
Destination - CloudMonitor Event Center
-
Enable: Turn on to send alerts to CloudMonitor Event Center. View system events.
Destination - SLS notification
-
Enable: Turn on to route alerts through the SLS notification service.
-
Alert Policy
Simple mode
-
SLS uses the built-in dynamic alert policy (sls.builtin.dynamic) by default.
-
Configure an action group.
After you configure an action group, SLS automatically creates an action policy named
Rule Name-Action Policy. All alerts from this rule use this policy. Notification channels.ImportantModify this action policy on the Action policies page. Adding a condition changes the Alert Policy setting to Standard Mode automatically.
-
Repeat interval: During this interval, repeated alerts trigger the action policy only once.
Standard mode
-
SLS uses the built-in dynamic alert policy (sls.builtin.dynamic) by default.
-
Select a built-in or custom action policy. Action policies.
-
Repeat interval: During this interval, repeated alerts trigger the action policy only once.
Advanced mode
-
Select a built-in or custom alert policy. Create an alert policy.
-
Select a built-in or custom action policy. Action policies. You can also toggle Custom action policy. Dynamic action policy mechanism.
-
Repeat interval: During this interval, repeated alerts trigger the action policy only once.
-
-