You can collect garbage collection (GC) logs to the Full-stack Observability application. This way, you can view the logs in the Simple Log Service console.
The application is under maintenance. We recommend that you collect metrics from servers to Application Real-Time Monitoring Service (ARMS). For more information, see ARMS.
Prerequisites
A Full-stack Observability instance is created. For more information, see Create an instance.
The GC logging options are configured for Java processes and GC logs are collected to specific files. The following table describes the options.
JDK 8 options
-XX:+PrintGCDetails -XX:+PrintGCDateStamps -XX:+PrintGCTimeStamps -Xloggc:gc-%p.log -XX:+UseGCLogFileRotation -XX:NumberOfGCLogFiles=5 -XX:GCLogFileSize=100MOption
Required
Description
-XX:+PrintGCDetailsYes
Displays detailed GC logs.
-XX:+PrintGCDateStampsYes
Adds date timestamps to GC logs.
If you enable this option, JVM adds the date and time information to each GC log. The information can be used to analyze the time sequence of GC logs and help you understand the behavior and effects of GC.
In most cases, this option is used together with other GC logging options, such as
-XX:+PrintGCDetailsand-XX:+PrintGCTimeStamps, to provide more detailed GC logs.-XX:+PrintGCTimeStampsYes
Adds timestamps to GC logs.
If you enable this option, JVM adds the timestamp information to each GC log, including the start time and end time of GC. The information can be used to analyze the time sequence and performance of GC and help you understand the GC behavior of applications and optimize performance.
In most cases, this option is used together with other GC logging options, such as
-XX:+PrintGCDetailsand-XX:+PrintGCDateStamps, to provide more detailed GC logs.-XloggcYes
Collects GC logs to a specific file. Format:
-Xloggc:gc-%p.log.gc-%p.logspecifies a file path.In JDK 8, the
-Xloggcoption is valid and must be configured in the-Xloggc:gc-%p.logformat. In most cases, this option is used together with other GC logging options, such as-XX:+PrintGCDetailsand-XX:+PrintGCTimeStamps, to provide more detailed GC logs.-XX:+UseGCLogFileRotationNo (recommended)
Enables rotation for GC log files.
If you enable this option, JVM automatically rotates GC log files. If the size of a file reaches a specific value or a specific period of time elapses, JVM automatically creates a log file and retains the previous log file. This prevents GC log files from becoming excessively large and occupying a large volume of disk space. The log file rotation feature helps you efficiently manage and analyze log files.
In most cases, this option is used together with other GC logging options, such as
-XX:GCLogFileSizeand-XX:GCLogFileSize, to manage the rotation conditions and policies for log files.-XX:NumberOfGCLogFilesNo (recommended)
Specifies the maximum number of GC log files that can be retained during rotation.
If you configure this option, JVM retains up to the specified number of GC log files. When the number of log files exceeds the value of this option, the earliest log file is deleted. This prevents excessive disk usage.
In most cases, this option is used together with the
-XX:+UseGCLogFileRotationoption to manage the rotation of GC log files.-XX:GCLogFileSizeNo (recommended)
Specifies the maximum size of a GC log file.
If you configure this option, JVM monitors the size of each GC log file based on the value of this option. When the size of a log file exceeds the value of this option, JVM automatically creates a new log file and retains the previous log file. This prevents excessive disk usage.
In most cases, this option is used together with the
-XX:+UseGCLogFileRotationoption to manage the rotation of GC log files.JDK 11 options
In JDK 11, the preceding options are unavailable, except for
-Xloggc. JDK 11 introduces a new GC logging system referred to as Unified Logging. You can use-Xlog:gc*:fileinstead of-Xloggc:. This option allows you to manage the output formats and levels of logs in a fine-grained manner.-Xlog:gc*:file=gc-%p-%t.log:time,pid:filecount=5,filesize=10MNote%t specifies a point in time, %p specifies a process ID, filecount specifies the number of times that a file can be rotated, and filesize specifies the size of a file.
Background information
If an issue related to Java application performance occurs, you can analyze JVM GC logs to troubleshoot the issue. GC logs provide information about GC, including the cause of GC triggers, GC types, GC duration, and the number of objects that are collected. You can identify and handle the following common issues by analyzing GC logs:
Memory leaks: You can obtain the creation and destruction process of objects and the allocation of objects in the heap memory by analyzing GC logs. If specific objects are not released after you use the objects, memory leaks may occur. You can check whether memory leaks occur, identify the cause of the memory leaks, and handle the issue at the earliest opportunity by analyzing GC logs.
High memory usage: GC logs show the memory usage of your application, including the heap memory usage and object distribution. You can reduce memory usage based on the objects that occupy a large volume of memory space by analyzing GC logs.
GC performance-related issues: GC logs provide information about GC, including the cause of GC triggers, GC frequency, and GC duration. You can obtain the performance information about GC, such as the GC frequency and GC duration, by analyzing GC logs. If the GC frequency is high or the GC duration is long, the performance of your application may be affected. You can also identify the causes of issues that are related to GC performance and use GC logs to handle the issues.
GC policy selection: JVM provides multiple GC algorithms, such as Mark-Sweep, Copying, Mark-Compact. Analysis of GC logs allows you to evaluate the performance of each GC algorithm and select an appropriate GC policy. This helps improve the performance and stability of your application.
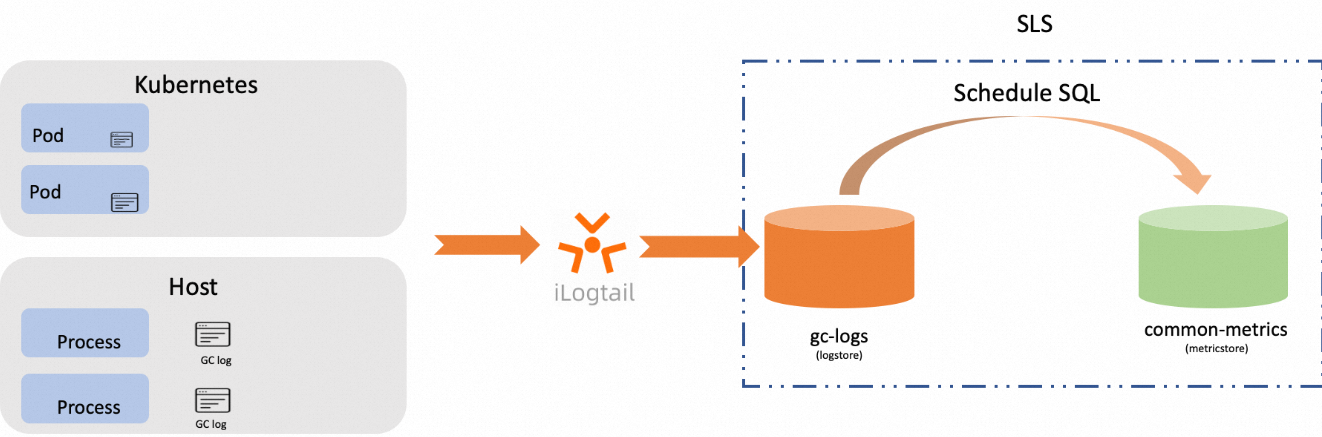
Data flow
The following figure shows the data flow of GC logs.
Procedure
Log on to the Simple Log Service console.
In the Log Application section, click the Intelligent O&M tab. Then, click Full-stack Observability.
On the Simple Log Service Full-stack Observability page, click the instance that you want to manage.
In the left-side navigation pane, click Full-stack Monitoring.
If this is your first time to use Performance Monitoring in the instance, click Enable.
In the left-side navigation pane, click Data Collection. On the Data Import Configurations page, turn on GC Log Analysis in the JVM Monitoring section.
The first time you create a Logtail configuration for host monitoring data, turn on the switch to go to the configuration page. If you created a Logtail configuration, click the
 icon to go to the configuration page.
 Create and select a machine group.
For more information about how to create a machine group, see Machine groups.
In the Logtail Configuration step, configure the parameters and click Next.
For more information about how to create a Logtail configuration, see Manage Logtail configurations.
After you configure the settings, Simple Log Service automatically creates assets such as Metricstores. For more information, see Assets.
GC metrics
The following GC metrics are generated by using the Scheduled SQL feature of Simple Log Service.
GC metrics are categorized based on time and space.
Time-based GC metrics: specify the duration of each GC subphase and the total duration of a GC phase.
Space-based GC metrics: specify the size of each area before and after each GC phase and the change of space promotion in each area.
Time
CPU time of a GC thread (GC_CPU_USED)
Label | Description |
instance_id | The instance ID. |
gc_type | The GC type. Examples: G1, CMS, and ZGC. |
type | The type of the GC duration. Valid values:
|
GC pause time (GC_PAUSE_TIME)
During a GC process, specific threads concurrently run and do not affect your application. The pause time is calculated by subtracting the concurrency time from the duration. The GC pause time affects your application.
Label | Description |
instance_id | The instance ID. |
gc_type | The GC algorithm. Valid values:
|
type | The GC type. Valid values:
|
GC subphase time (GC_SUBPHASE_TIME)
Label | Description |
instance_id | The instance ID. |
gc_type | The GC algorithm. Valid values:
|
type | The GC type. Valid values:
|
subphase | The name of the GC subphase.
|
GC time (GC_COST_TIME)
Label | Description |
instance_id | The instance ID. |
gc_type | The GC type. Valid values:
|
Space
Memory before GC (BEFORE_GC_REGION_SIZE)
Label | Description |
instance_id | The instance ID |
gc_type | The GC type.
|
type | The area name.
|
Memory after GC (AFTER_GC_REGION_SIZE)
Label | Description |
instance_id | The instance ID. |
gc_type | The GC type.
|
type | The area name.
|
Promotion size (GC_PROMOTION)
Label | Description |
instance_id | The instance ID. |
gc_type | The GC type.
|
What to do next
After JVM monitoring data is collected to the Full-stack Observability application, the application automatically creates dedicated dashboards for the monitoring data. You can use the dashboards to analyze the monitoring data. For more information, see View dashboards.