You can use Simple Log Service SDK to upload metric data. However, manually maintaining custom metrics is inefficient. Prometheus automatically generates multi-dimensional metrics and maintains built-in labels. In most cases, Prometheus uses a third-party collector to pull metric data in Pull mode by using an HTTP endpoint. In Function Compute scenarios, Prometheus cannot upload metric data in Pull mode because computing services cannot provide an HTTP endpoint. This topic describes how to use Prometheus SDK to upload metric data in Push mode.
Prerequisites
Simple Log Service is activated. For more information, see Activate Simple Log Service.
A project and a Metricstore are created. For more information, see Manage a project and Manage a Metricstore.
Integrate Prometheus into Simple Log Service
Prometheus automatically generates multi-dimensional metrics, maintains built-in labels, and uploads metric data to a Metricstore based on the labels. The mode that Prometheus uses to upload metric data to Simple Log Service varies based on the scenario. The following table describes the modes.
Mode | Description |
Pull mode | In Pull mode, Prometheus collects and uploads metric data to Simple Log Service based on the following phases:
|
Push mode | In Push mode, metric data is actively pushed to a Metricstore. Metric data can be pushed to a Simple Log Service Metricstore by using one of the following methods:
|
Sample code
You can use Prometheus SDK to integrate the operations that are executed by a collection process to collect metric data in Pull mode into your project process.
Go
Simple Log Service SDK for Go is installed. For more information, see Install Simple Log Service SDK for Go. The Gather() function is used to query all metrics. Then, the Encode or Decode operation is called.
package main

import (
	"bytes"
	"fmt"
	"time"

	"github.com/gogo/protobuf/proto"
	"github.com/golang/snappy"
	"github.com/prometheus/client_golang/prometheus"
	"github.com/prometheus/common/expfmt"
	"github.com/prometheus/prometheus/util/fmtutil"

	"io/ioutil"
	"math/rand"
	"net/http"
)

var durationHistogram = prometheus.NewHistogram(
	prometheus.HistogramOpts{
		Name:    "server_handling_seconds",
		Buckets: prometheus.DefBuckets,
	},
)

var requestCount = prometheus.NewCounter(
	prometheus.CounterOpts{
		Name: "server_requests_count",
	},
)

func main() {
	prometheus.MustRegister(durationHistogram)

	// Replace your-project-name, endpoint, your-project-name, and your-metricstore-name based on your business requirements.
	u := fmt.Sprintf("https://%s.%s/prometheus/%s/%s/api/v1/write", "your-project-name", "endpoint", "your-project-name", "your-metricstore-name")

	for i := 0; i < 300; i++ {
		// Update metric data.
		for j := 0; j < 100; j++ {
			val := rand.Float64() * 10
			durationHistogram.Observe(val)
			requestCount.Inc()
		}

		// Collect all registered metric data.
		mfs, err := prometheus.DefaultGatherer.Gather()
		if err != nil {
			panic(err)
		}

		// Encode the metric data.
		// Note: The metric data must be encoded because the le label +Inf is added to Histogram metrics during data encoding.
		buf := bytes.NewBuffer(nil)
		encoder := expfmt.NewEncoder(buf, expfmt.NewFormat(expfmt.TypeTextPlain))
		for _, mf := range mfs {
			if err := encoder.Encode(mf); err != nil {
				panic(err)
			}
		}

		// Parse the encoded metric data and convert the parsed data into the data that conforms to the Prometheus Remote Write PB protocol.
		// In this example, an error occurs and the process is directly terminated without handling the error. In actual scenarios, you must select a handling method based on your business requirements. For example, you can skip the error or exit and retry the process.
		request, err := fmtutil.MetricTextToWriteRequest(buf, nil)
		if err != nil {
			panic(err)
		}

		// Serialize and compress the *prompb.WriteRequest object.
		data, _ := proto.Marshal(request)
		bufBody := snappy.Encode(nil, data)
		rwR, err := http.NewRequest("POST", u, ioutil.NopCloser(bytes.NewReader(bufBody)))
		if err != nil {
			panic(err)
		}
		rwR.Header.Add("Content-Encoding", "snappy")
		rwR.Header.Set("Content-Type", "application/x-protobuf")
		// Configure the BasicAuth parameter. You must specify an AccessKey ID and an AccessKey secret.
		rwR.SetBasicAuth("yourAccessKeyID", "yourAccessKeySecret")

		// Send metric data to the Simple Log Service Metricstore.
		resp, err := http.DefaultClient.Do(rwR)
		if err != nil {
			panic(err)
		}
		d, err := ioutil.ReadAll(resp.Body)
		if err != nil {
			panic(err)
		}
		fmt.Println(string(d))

		time.Sleep(time.Second)
	}

}
Verify the collected data
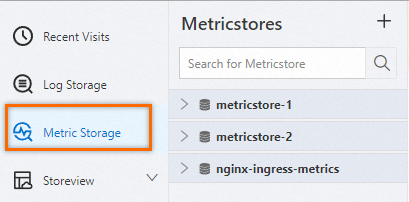
Log on to the Simple Log Service console. In the Projects section, click the project that you want to manage.
On the tab, click the metricstore that you want to manage.
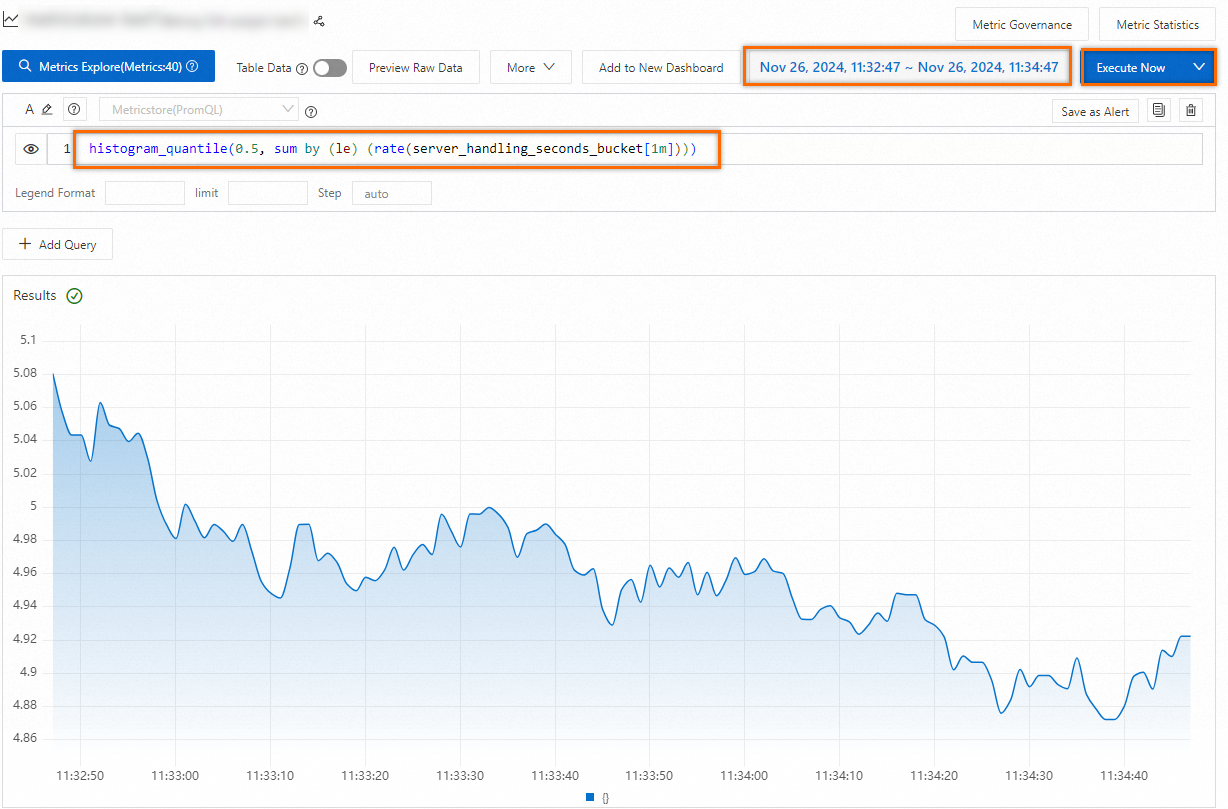
In the upper-right corner of the Metricstore page, specify a query time range. Enter a PromQL statement to calculate the 50th percentile of the total duration and click Execute Now. For more information, see PromQL.
histogram_quantile(0.5, sum by (le) (rate(server_handling_seconds_bucket[1m])))