Use CloudLens for SLS to monitor Project resource quota usage, detect overages through global error logs and metrics, and request quota increases.
Background
Alibaba Cloud Lens provides cloud product observability built on Simple Log Service (SLS), with one-click collection of instance logs (important logs, detailed logs, and job operational logs) and global logs (audit logs, billing logs, error logs, and metrics).
|
Log type |
Subtype |
Description |
|
Instance logs |
Detailed logs |
Access traffic monitoring Access exception monitoring |
|
Important logs |
Consumer group monitoring Logtail collection monitoring |
|
|
Job operational logs |
Data transformation (new) monitoring Scheduled SQL job monitoring |
|
|
Global logs |
Audit logs |
Resource operation monitoring |
|
Error logs |
Quota overage monitoring Access exception monitoring Operation exception monitoring |
|
|
Metrics |
Access traffic monitoring Access exception monitoring Resource quota usage monitoring |
|
|
Billing logs |
Resource usage tracking |
For details on log types, see the log index table.
Prerequisites
-
You have created a RAM user and granted it the required permissions. For more information, see Create a RAM user and Authorize a RAM user to operate CloudLens for SLS.
-
You have enabled the log collection feature for global logs, including error logs and metrics. For more information, see Enable the log collection feature.
-
To monitor resource quota usage in real time, enable log collection for the following global logs: error logs and metrics. These logs must be stored in the same project.
-
To prevent monitoring logs from consuming a business project's resource quota, store them in a dedicated project. For example, you can use the
log-service-{user ID}-cn-hangzhouproject in the China (Hangzhou) region.
Quota monitoring dashboard
The quota monitoring dashboard in CloudLens for SLS shows resource quota alerts, real-time usage of key Project resources, and quota overages.
Log on to the Simple Log Service console.
-
Under , click CloudLens for SLS.
-
In the left-side navigation pane, choose to view quota information.
Resource quota alerting
Shows resource quota alerts when usage exceeds 80% and the distribution of over-limit resources.
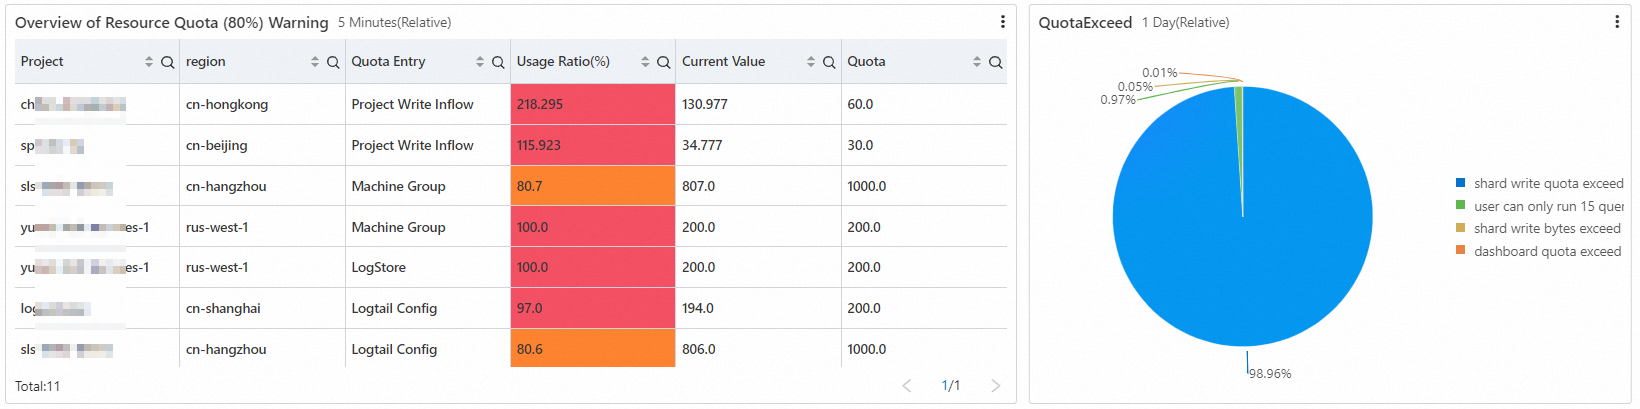
Real-time quota usage
Shows real-time usage of basic project resources and data read/write quotas.

Lists resource quota usage per Project, including Region, Logstore Usage (%), Machine Group Usage (%), and Logtail configuration Usage (%), and their limits. Cells turn red when usage reaches or approaches 100% and orange around 80%. Click Adjust Resource Quotas in the upper-right corner to modify quotas.
The data read/write quota table shows columns for Project, region, Project write throughput (%), Project write operations (%), Project read operations (%), Project write throughput (GB/min) (watermark/limit), Project write operations (watermark/limit), and Project read operations (watermark/limit). Click Adjust Resource Quota in the upper-right corner to modify quota limits.
Project quota overage
Shows overages of Project resource quotas.
Lists the Project, error message, and count for each type of quota exceedance. Common types include report quota exceeded and Logstore count exceeded. Click Adjust Resource Quota in the upper-right corner to adjust the corresponding resource quota.
Resource monitoring
CloudLens for SLS supports resource quota monitoring, data read/write quota monitoring, and advanced monitoring for Logstores, machine groups, and Project write operations.
Log on to the Simple Log Service console.
-
In the Log Application section, click CloudLens for SLS.
-
On the CloudLens for SLS page, in the left navigation pane, click Anomaly Detection to configure alert rules for resource monitoring.
Quota monitoring
The following table lists the quota metric categories.
|
Category |
Metric |
Description |
|
real-time usage monitoring |
|
|
|
||
|
quota overage monitoring |
|
Resource quota monitoring
-
Click Create Alert to configure an alert rule.
-
Select the Project that stores global error logs and metrics for the alert rule.
-
Configure the trigger condition and alert policy to meet your needs.
Configure the parameters in the following table. Keep the default values for the other parameters. For more information, see Create a log-based alert rule.
Parameter
Value
Rule Name
basic resource quota usage
Check Frequency
Fixed Interval, 15 minutes
Query statistics
-
Type: Metricstore
-
Authorization: Default
-
Metricstore: internal-monitor-metric
-
Time Range: 15 Minutes (Relative)
-
Query:
ImportantBy default, an SQL query returns 100 rows. If you append
limit 1000to the end of the query, up to 1,000 rows are returned.* | select Project, region, logstore_ratio, machine_group_ratio, logtail_config_ratio from (SELECT A.id as Project , A.region as region, round(COALESCE(SUM(B.count_logstore), 0)/cast(json_extract(A.quota, '$.logstore') as double) * 100, 3) as logstore_ratio, cast(json_extract(A.quota, '$.logstore') as double) as quota_logstore, round(COALESCE(SUM(C.count_machine_group), 0)/cast(json_extract(A.quota, '$.machine_group') as double) * 100, 3) as machine_group_ratio, cast(json_extract(A.quota, '$.machine_group') as double) as quota_machine_group, round(COALESCE(SUM(D.count_logtail_config), 0)/cast(json_extract(A.quota, '$.config') as double) * 100, 3) as logtail_config_ratio, cast(json_extract(A.quota, '$.config') as double) as quota_logtail_config FROM "resource.sls.cmdb.project" as A LEFT JOIN ( SELECT project, COUNT(*) AS count_logstore FROM "resource.sls.cmdb.logstore" as B GROUP BY project ) AS B ON A.id = B.project LEFT JOIN ( SELECT project, COUNT(*) AS count_machine_group FROM "resource.sls.cmdb.machine_group" as C GROUP BY project ) AS C ON A.id = C.project LEFT JOIN ( SELECT project, COUNT(*) AS count_logtail_config FROM "resource.sls.cmdb.logtail_config" as D GROUP BY project ) AS D ON A.id = D.project group by A.id, A.quota, A.region) where quota_logstore is not null and quota_machine_group is not null and quota_logtail_config is not null and (logstore_ratio > 80 or machine_group_ratio > 80 or logtail_config_ratio > 80) limit 10000
Group evaluation
Auto Label
Trigger Condition
-
A Critical alert is triggered if the quota usage for Logstores, machine groups, or Logtail configurations in a Project exceeds 90%.
-
A Medium alert is triggered if the quota usage for Logstores, machine groups, or Logtail configurations in a Project exceeds 80%.
-
When data matches
logstore_ratio > 90 || machine_group_ratio > 90 || logtail_config_ratio > 90, Severity: Critical. -
When data matches
logstore_ratio > 80 || machine_group_ratio > 80 || logtail_config_ratio > 80, Severity: Medium.
NoteDestination
Simple Log Service Notification
Alert Policy
Standard Mode
Action Policy
Select an existing action policy that meets your needs, or click Add to create one. For more information, see Action policies.
In the Add Annotation section, set
titleto${alert_name} alert triggeredanddescto${alert_name} alert triggered. Keep Auto Add Annotation disabled. -
-
After you configure the parameters, click OK.
Data read/write quota usage
-
Click Create Alert to configure an alert rule.
-
Select the Project that stores global error logs and metrics for the alert rule.
-
Configure the trigger condition and alert policy.
Configure the parameters in the following table. Keep the default values for the other parameters. For more information, see Create Log Alert Monitoring Rules.
Parameter
Value
Rule Name
Data read/write quota usage
Check Frequency
Fixed interval, 15 minutes
Query statistics
-
Type: Metricstore
-
Authorization: Default
-
Metricstore: internal-monitor-metric
-
Time Range: 5 minutes (relative)
-
Query:
ImportantBy default, queries return 100 rows. To return up to 1,000 rows, add
limit 1000to the end of your query.(*)| select Project, region, inflow_ratio, write_cnt_ratio from (SELECT cmdb.id as Project, cmdb.region as region, round(COALESCE(M.name1,0)/round(cast(json_extract(cmdb.quota, '$.inflow_per_min') as double)/1000000000, 3) * 100, 3) as inflow_ratio, round(COALESCE(M.name2,0)/cast(json_extract(cmdb.quota, '$.write_cnt_per_min') as double) * 100, 3) as write_cnt_ratio from "resource.sls.cmdb.project" as cmdb LEFT JOIN ( select project, round(MAX(name1)/1000000000, 3) as name1, MAX(name2) as name2 from (SELECT __time_nano__ as time, element_at( split_to_map(__labels__, '|', '#$#') , 'project') as project, sum(CASE WHEN __name__ = 'logstore_origin_inflow_bytes' THEN __value__ ELSE NULL END) AS name1, sum(CASE WHEN __name__ = 'logstore_write_count' THEN __value__ ELSE NULL END) AS name2 FROM "internal-monitor-metric.prom" where __name__ in ('logstore_origin_inflow_bytes','logstore_write_count' ) and regexp_like(element_at( split_to_map(__labels__, '|', '#$#') , 'project') , '.*') group by project,time )group by project) AS M ON cmdb.id = M.project) where inflow_ratio > 80 or write_cnt_ratio > 80 limit 10000
Group evaluation
Auto label
Trigger Condition
-
An alert with a critical severity is triggered if the write traffic or write count usage for a Project exceeds 90% of the quota.
-
An alert with a medium severity is triggered if the write traffic or write count usage for a Project exceeds 80% of the quota.
-
Sets the severity to Critical when data matches
where inflow_ratio > 90 || write_cnt_ratio > 90. -
Sets the severity to Medium when data matches
where inflow_ratio > 80 || write_cnt_ratio > 80.
NoteDestination
Simple Log Service Notification
Alert Policy
Standard mode
Action Policy
Select an existing action policy or click Add to create a new one. For more information, see Action policies.
In the Add annotation section, set title to
${alert_name} alert triggeredand desc to${alert_name} alert triggered. -
-
After you configure the parameters, click OK.
Resource quota exceedance monitoring
-
Click Create Alert to configure an alert rule.
-
Select the Project that stores global error logs and metrics for the alert rule.
-
Configure the trigger condition and alert policy based on your business requirements.
Configure the parameters according to the table below. You can keep the default values for other parameters. For more information, see Create log alert rules.
Parameter
Value
Rule Name
Resource quota exceedance monitoring
Check Frequency
Fixed interval, 15 minutes
Query and statistics
-
Type: Logstore
-
Authorization: Default
-
Logstore: internal-error_log
-
Time Range: 15 minutes (Relative)
-
Query Statement:
ImportantBy default, queries return a maximum of 100 results. Appending
limit 1000to the query statement increases this maximum to 1,000.((* and (ErrorCode: ExceedQuota or ErrorCode: QuotaExceed or ErrorCode: ProjectQuotaExceed or ErrorCode:WriteQuotaExceed or ErrorCode: ShardWriteQuotaExceed or ErrorCode: ShardReadQuotaExceed)))| SELECT Project, CASE WHEN ErrorMsg like '%Project write quota exceed: inflow%' then 'The Project write traffic quota is exceeded.' WHEN ErrorMsg like '%Project write quota exceed: qps%' then 'The Project write operation quota is exceeded.' WHEN ErrorMsg like '%dashboard quota exceed%' then 'The dashboard quota is exceeded.' WHEN ErrorMsg like '%config count%' then 'The Logtail configuration quota is exceeded.' WHEN ErrorMsg like '%machine group count%' then 'The machine group quota is exceeded.' WHEN ErrorMsg like '%Alert count %' then 'The alert rule quota is exceeded.' WHEN ErrorMsg like '%logstore count %' then 'The Logstore quota is exceeded.' WHEN ErrorMsg like '%shard count%' then 'The shard quota is exceeded.' WHEN ErrorMsg like '%shard write bytes%' then 'The shard write traffic quota is exceeded.' WHEN ErrorMsg like '%shard write quota%' then 'The shard write operation quota is exceeded.' WHEN ErrorMsg like '%user can only run%' then 'The concurrent SQL analysis operation quota is exceeded.' ELSE ErrorMsg END AS ErrorMsg, COUNT(1) AS count GROUP BY Project, ErrorMsg Limit 1000
Group evaluation
No grouping
Trigger Condition
-
Exceeding a quota more than 10 times triggers a Critical alert.
-
Exceeding a quota more than once triggers a Medium alert.
-
For data matching
count > 10, the severity is Critical. -
For data matching
count > 1, the severity is Medium.
NoteDestination
SLS Notification
Alert Policy
Standard Mode
Action Policy
Select an action policy as needed, or click Add to create one. For more information, see Action policies.
-
-
After you configure the parameters, click OK.
Advanced monitoring
Advanced monitoring covers the following metrics:
|
Category |
Scenario |
Metric |
Description |
|
Basic resource quota |
Real-time usage |
|
|
|
Quota exceeded |
|
||
|
Real-time usage |
|
||
|
Quota exceeded |
|
||
|
Real-time usage |
|
||
|
Quota exceeded |
|
||
|
Data read/write quota |
Real-time usage |
|
|
|
Quota exceeded |
|
||
|
Real-time usage |
|
||
|
Quota exceeded |
|
Logstore monitoring
Real-time usage monitoring
-
Click Create Alert to configure an alert rule.
-
Select the Project for the alert rule. This Project must store your global error logs and metrics.
-
Configure the trigger condition and alert policy based on your business requirements.
Configure the parameters as described in the following table. You can leave the other parameters at their defaults. For more information, see Create Log Alert Monitoring Rules.
Parameter
Value
Rule Name
Logstore usage monitoring
Check Frequency
Fixed Interval, 15 minutes
Query statistics
-
Type: Metricstore
-
Authorization: Default
-
Metricstore: internal-monitor-metric
-
Time range: 15 minutes (Relative)
-
Query:
ImportantBy default, a query returns a maximum of 100 results. If you add limit 1000 to the end of the query, it can return up to 1,000 results.
* |  select Project, region, round(count_logstore/quota_logstore * 100, 3)  as logstore_ratio from
(SELECT A.id as Project , A.region as region, COALESCE(SUM(B.count_logstore), 0)  AS count_logstore , cast(json_extract(A.quota, '$.logstore') as double)  as quota_logstore
FROM  "resource.sls.cmdb.project" as A
LEFT JOIN (
  SELECT project, COUNT(*) AS count_logstore
  FROM "resource.sls.cmdb.logstore" as B
  GROUP BY project
) AS B ON A.id = B.project
group by A.id, A.quota, A.region) where  quota_logstore is not null   order by logstore_ratio desc limit 1000
Group evaluation
Auto Label
Trigger Condition
-
The system triggers a Critical alert if the number of Logstores in a Project exceeds 90% of its quota.
-
The system triggers a Medium alert if the number of Logstores in a Project exceeds 80% of its quota.
-
If data matches the expression
logstore_ratio > 90, the alert Severity is Critical. -
If data matches the expression
logstore_ratio > 80, the alert Severity is Medium.
NoteDestination
Simple Log Service Notification
Alert Policy
Standard Mode
Action Policy
Select an existing action policy or click Add to create a new one. For more information, see action policy.
-
-
After you configure the parameters, click OK.
Quota exceedance monitoring
-
Click Create Alert to configure an alert rule.
-
Select the Project for the alert rule. This Project must store your global error logs and metrics.
-
Configure the trigger condition and alert policy based on your business requirements.
Configure the parameters as described in the following table. You can leave the other parameters at their defaults. For more information, see Create Log Alert Monitoring Rules.
Parameter
Value
Rule Name
Logstore quota exceeded
Check Frequency
Fixed Interval, 15 minutes
Query statistics
-
Type: Logstore
-
Authorization: Default
-
Logstore: internal-error_log
-
Time range: 15 minutes (Relative)
-
Query:
ImportantBy default, a query returns a maximum of 100 results. If you add limit 1000 to the end of the query, it can return up to 1,000 results.
* and (ErrorCode: ExceedQuota or ErrorCode: QuotaExceed or ErrorCode: ProjectQuotaExceed or ErrorCode:WriteQuotaExceed)| SELECT Project,
COUNT(1) AS count where ErrorMsg like '%logstore count %' GROUP BY Project ORDER BY count DESC LIMIT 1000
Group evaluation
No Grouping
Trigger Condition
-
The system triggers a Critical alert if a Project exceeds its Logstore quota more than 10 times.
-
The system triggers a Medium alert if a Project exceeds its Logstore quota more than once.
-
If data matches the expression
count > 10, the alert Severity is Critical. -
If data matches the expression
count > 1, the alert Severity is Medium.
NoteDestination
Simple Log Service Notification
Alert Policy
Standard Mode
Action Policy
Select an existing action policy or click Add to create a new one. For more information, see action policy.
-
-
After you configure the parameters, click OK.
Machine group monitoring
Real-time usage monitoring
-
Click Create Alert to configure an alert rule.
-
Select the Project for the alert rule. This Project must store your global error logs and monitoring metrics.
-
Configure the trigger condition and alert policy as needed.
Configure the parameters as described in the table below. Keep the default settings for other parameters. For more information, see Create alert rules for logs.
Parameter
Value
Rule Name
Machine group usage
Check Frequency
Fixed Interval, 15 Minutes
Query statistics
-
Type: Metricstore
-
Authorization: Default
-
Metricstore: internal-monitor-metric
-
Time Range: 15 Minutes (Relative)
-
Query:
ImportantBy default, an SQL statement can return up to 100 rows. If you add
limit 1000to the end of the statement, it can return up to 1,000 rows.* | select Project, region, round(count_machine_group/quota_machine_group * 100, 3) as machine_group_ratio from (SELECT A.id as Project , A.region as region, COALESCE(SUM(B.count_machine_group), 0) AS count_machine_group , cast(json_extract(A.quota, '$.machine_group') as double) as quota_machine_group FROM "resource.sls.cmdb.project" as A LEFT JOIN ( SELECT project, COUNT(*) AS count_machine_group FROM "resource.sls.cmdb.machine_group" as B GROUP BY project ) AS B ON A.id = B.project group by A.id, A.quota, A.region) where quota_machine_group is not null order by machine_group_ratio desc limit 1000
Group evaluation
Auto Label
Trigger Condition
-
A Critical alert triggers if the machine group count in a Project exceeds 90% of its quota.
-
A Medium alert triggers if the machine group count in a Project exceeds 80% of its quota.
-
When data matches
machine_group_ratio > 90, Severity: Critical. -
When data matches
machine_group_ratio > 80, Severity: Medium.
NoteDestination
SLS Notification
Alert Policy
Standard Mode
Action Policy
Select an existing action policy, or click Add to create one. For more information, see Action policies.
-
-
After configuring the parameters, click OK.
Quota exceedance monitoring
-
Click Create Alert to configure an alert rule.
-
Select the Project for the alert rule. This Project must store your global error logs and monitoring metrics.
-
Configure the trigger condition and alert policy as needed.
Configure the parameters as described in the table below. Keep the default settings for other parameters. For more information, see Create alert rules for logs.
Parameter
Value
Rule Name
Machine group quota exceeded
Check Frequency
Fixed Interval, 15 Minutes
Query statistics
-
Type: Logstore
-
Authorization: Default
-
Logstore: internal-error_log
-
Time Range: 15 Minutes (Relative)
-
Query:
ImportantBy default, an SQL statement can return up to 100 rows. If you add
limit 1000to the end of the statement, it can return up to 1,000 rows.* and (ErrorCode: ExceedQuota or ErrorCode: QuotaExceed or ErrorCode: ProjectQuotaExceed or ErrorCode:WriteQuotaExceed)| SELECT Project, COUNT(1) AS count where ErrorMsg like '%machine group count%' GROUP BY Project ORDER BY count DESC LIMIT 1000
Group evaluation
No grouping
Trigger Condition
-
A Critical alert triggers if more than 10 machine group quota errors are recorded for a Project.
-
A Medium alert triggers if more than one machine group quota error is recorded for a Project.
-
When data matches
count > 10, Severity: Critical. -
When data matches
count > 1, Severity: Medium.
NoteDestination
SLS Notification
Alert Policy
Standard Mode
Action Policy
Select an existing action policy, or click Add to create one. For more information, see Action policies.
-
-
After configuring the parameters, click OK.
Logtail collection
Usage level monitoring
-
Click Create Alert to configure an alert rule.
-
Select the Project for the alert rule. This Project must store your global error logs and monitoring metrics.
-
Configure the trigger condition and alert policy based on your business requirements.
Configure the parameters as described in the following table. You can leave the other parameters at their default values. For more information, see Create a log alert monitoring rule.
Parameter
Value
Rule Name
Logtail collection configuration quota usage
Check Frequency
fixed interval, 15 minutes
Query statistics
-
Type: Metricstore
-
Authorization: Default
-
Metricstore: internal-monitor-metric
-
time range: 15 minutes (relative)
-
query statement:
ImportantBy default, a query returns up to 100 rows. If you add
limit 1000to the end of the query statement, it can return up to 1,000 rows.* | select Project, region, round(count_logtail_config/quota_logtail_config * 100, 3) as logtail_config_ratio from (SELECT A.id as Project , A.region as region, COALESCE(SUM(B.count_logtail_config), 0) AS count_logtail_config , cast(json_extract(A.quota, '$.config') as double) as quota_logtail_config FROM "resource.sls.cmdb.project" as A LEFT JOIN ( SELECT project, COUNT(*) AS count_logtail_config FROM "resource.sls.cmdb.logtail_config" as B GROUP BY project ) AS B ON A.id = B.project group by A.id, A.quota, A.region) where quota_logtail_config is not null order by logtail_config_ratio desc limit 1000
Group evaluation
Auto Label
Trigger Condition
-
If the number of Logtail collection configurations in a Project exceeds 90% of the quota, a Critical alert is triggered.
-
If the number of Logtail collection configurations in a Project exceeds 80% of the quota, a Medium alert is triggered.
-
When data matches the expression
logtail_config_ratio > 90, severity: Critical. -
When data matches the expression
logtail_config_ratio > 80, severity: Medium.
NoteDestination
Simple Log Service Notification
Alert Policy
standard mode
Action Policy
Select an existing action policy, or click Add to create one. For more information, see Action policies.
-
-
After configuring the parameters, click OK.
Quota exceedance monitoring
-
Click Create Alert to configure an alert rule.
-
Select the Project for the alert rule. This Project must store your global error logs and monitoring metrics.
-
Configure the trigger condition and alert policy based on your business requirements.
Configure the parameters as described in the following table. You can leave the other parameters at their default values. For more information, see Create a log alert monitoring rule.
Parameter
Value
Rule Name
Logtail collection configuration quota exceeded
Check Frequency
fixed interval, 15 minutes
Query statistics
-
Type: Logstore
-
Authorization: Default
-
Logstore: internal-error_log
-
time range: 15 minutes (relative)
-
query statement:
ImportantBy default, a query returns up to 100 rows. If you add
limit 1000to the end of the query statement, it can return up to 1,000 rows.* and (ErrorCode: ExceedQuota or ErrorCode: QuotaExceed or ErrorCode: ProjectQuotaExceed or ErrorCode:WriteQuotaExceed)| SELECT Project, COUNT(1) AS count where ErrorMsg like '%config count%' GROUP BY Project ORDER BY count DESC LIMIT 1000
Group evaluation
No Grouping
Trigger Condition
-
Exceeding the Logtail configuration quota for a Project more than 10 times triggers a Critical alert.
-
Exceeding the Logtail configuration quota for a Project more than once triggers a Medium alert.
-
When data matches the expression
count > 10, severity: Critical. -
When data matches the expression
count > 1, severity: Medium.
NoteDestination
Simple Log Service Notification
Alert Policy
standard mode
Action Policy
Select an existing action policy, or click Add to create one. For more information, see Action policies.
-
-
After configuring the parameters, click OK.
Project write traffic monitoring
Real-time usage monitoring
-
Click Create Alert to configure an alert rule.
-
Select the project for the alert rule. This must be the project where your global error logs and metrics are stored.
-
Configure the alert trigger condition and alert policy based on your business scenario.
Configure the parameters as described in the following table and keep the default values for the other parameters. For more information, see Create log alert monitoring rules.
Parameter
Value
Rule Name
project write traffic quota usage
Check Frequency
Fixed interval, 15 minutes
Query statistics
-
Type: Metricstore
-
Authorization: Default
-
Metricstore: internal-monitor-metric
-
Time range: 15 minutes (relative)
-
Query statement:
ImportantBy default, a query statement returns up to 100 rows. Adding 'limit 1000' to the end of the statement allows it to return up to 1,000 rows.
(*)| SELECT Project, region , round(count_inflow/cast(quota_inflow as double) * 100, 3) as inflow_ratio
FROM
(SELECT cmdb.id as Project, cmdb.region as region, COALESCE(M.name1,0) as count_inflow, round(cast(json_extract(cmdb.quota, '$.inflow_per_min') as double)/1000000000, 3) as quota_inflow  from "resource.sls.cmdb.project" as cmdb
LEFT JOIN (
    select project,  round(MAX(name1)/1000000000, 3) as name1 from (SELECT __time_nano__ as time, element_at( split_to_map(__labels__, '|', '#$#') , 'project') as project,   sum(CASE WHEN __name__ = 'logstore_origin_inflow_bytes' THEN __value__ ELSE NULL END) AS name1
    FROM "internal-monitor-metric.prom" where __name__ ='logstore_origin_inflow_bytes' and regexp_like(element_at( split_to_map(__labels__, '|', '#$#') , 'project') , '.*') group by project,time )group by project) AS M ON cmdb.id = M.project )order by inflow_ratio desc  limit 1000
Group evaluation
Auto Label
Trigger Condition
-
Exceeding 90% of a project's write traffic quota triggers a Critical alert.
-
Exceeding 80% of a project's write traffic quota triggers a Medium alert.
-
Data matching the expression
inflow_ratio > 90triggers a Critical alert. -
Data matching the expression
inflow_ratio > 80triggers a Medium alert.
NoteDestination
Simple Log Service Notification
Alert Policy
Standard mode
Action Policy
Select an action policy based on your business requirements, or click Add to create one. For more information, see Action policy.
-
-
After you configure the parameters, click OK.
Quota exceedance monitoring
-
Click Create Alert to configure an alert rule.
-
Select the project for the alert rule. This must be the project where your global error logs and metrics are stored.
-
Configure the alert trigger condition and alert policy based on your business scenario.
Configure the parameters as described in the following table and keep the default values for the other parameters. For more information, see Create log alert monitoring rules.
Parameter
Value
Rule Name
project write traffic quota exceeded
Check Frequency
Fixed interval, 15 minutes
Query statistics
-
Type: Logstore
-
Authorization: Default
-
Logstore: internal-error_log
-
Time range: 15 minutes (relative)
-
Query statement:
ImportantBy default, a query statement returns up to 100 rows. Adding 'limit 1000' to the end of the statement allows it to return up to 1,000 rows.
* and (ErrorCode: ExceedQuota or ErrorCode: QuotaExceed or ErrorCode: ProjectQuotaExceed or ErrorCode:WriteQuotaExceed)| SELECT Project,
COUNT(1) AS count where ErrorMsg like '%Project write quota exceed: inflow%' GROUP BY Project ORDER BY count DESC LIMIT 1000
Group evaluation
No grouping
Trigger Condition
-
Exceeding the project's write traffic quota more than 10 times triggers a Critical alert.
-
Exceeding the project's write traffic quota more than once triggers a Medium alert.
-
Data matching the expression
count > 10triggers a Critical alert. -
Data matching the expression
count > 1triggers a Medium alert.
NoteDestination
Simple Log Service Notification
Alert Policy
Standard mode
Action Policy
Select an action policy based on your business requirements, or click Add to create one. For more information, see Action policy.
-
-
After you configure the parameters, click OK.
Project write monitoring
Real-time usage monitoring
-
Click Create Alert to configure an alert rule.
-
Select the Project that stores your global error logs and monitoring metrics.
-
Configure the trigger condition and alert policy based on your business requirements.
Set the parameters as shown in the following table. You can leave the other parameters at their default values. For more information, see Create a log alert rule.
Parameter
Value
Rule Name
Project write operation quota usage
Check Frequency
Fixed interval, 15 minutes
Query statistics
-
Type: MetricStore
-
Authorization: Default
-
MetricStore: internal-monitor-metric
-
Time Range: 15 minutes (relative)
-
Query Statement:
ImportantBy default, a query returns up to 100 results. If you add
limit 1000to the end of the query, it can return up to 1,000 results.(*)| SELECT Project, region, round(count_write_cnt/cast(quota_write_cnt as double) * 100, 3) as write_cnt_ratio FROM (SELECT cmdb.id as Project, cmdb.region as region, COALESCE(M.name1,0) as count_write_cnt, cast(json_extract(cmdb.quota, '$.write_cnt_per_min') as bigint) as quota_write_cnt from "resource.sls.cmdb.project" as cmdb LEFT JOIN ( select project, MAX(name1) as name1 from (SELECT __time_nano__ as time, element_at( split_to_map(__labels__, '|', '#$#') , 'project') as project, sum(CASE WHEN __name__ = 'logstore_write_count' THEN __value__ ELSE NULL END) AS name1 FROM "internal-monitor-metric.prom" where __name__ = 'logstore_write_count' and regexp_like(element_at( split_to_map(__labels__, '|', '#$#') , 'project') , '.*') group by project,time )group by project) AS M ON cmdb.id = M.project ) order by write_cnt_ratio desc limit 1000
Group evaluation
Auto Label
Trigger Condition
-
SLS triggers a Critical alert if a Project's write operations exceed 90% of its quota.
-
SLS triggers a Medium alert if a Project's write operations exceed 80% of its quota.
-
When data matches
write_cnt_ratio > 90, Severity: Critical. -
When data matches
write_cnt_ratio > 80, Severity: Medium.
NoteDestination
SLS notification
Alert Policy
Standard Mode
Action Policy
Select an action policy as needed, or click Add to create a new one. For more information, see action policies.
In the Add Tag section, set title to
${alert_name} alert triggeredand desc to${alert_name} alert triggered. -
-
After configuring the parameters, click OK.
Quota overage monitoring
-
Click Create Alert to configure an alert rule.
-
Select the Project that stores your global error logs and monitoring metrics.
-
Configure the trigger condition and alert policy based on your business requirements.
Set the parameters as shown in the following table. You can leave the other parameters at their default values. For more information, see Create a log alert rule.
Parameter
Value
Rule Name
Project write operation quota exceeded
Check Frequency
Fixed interval, 15 minutes
Query statistics
-
Type: Logstore
-
Authorization: Default
-
Logstore: internal-error_log
-
Time Range: 15 minutes (relative)
-
Query Statement:
ImportantBy default, a query returns up to 100 results. If you add
limit 1000to the end of the query, it can return up to 1,000 results.* and (ErrorCode: ExceedQuota or ErrorCode: QuotaExceed or ErrorCode: ProjectQuotaExceed or ErrorCode:WriteQuotaExceed)| SELECT Project, COUNT(1) AS count where ErrorMsg like '%Project write quota exceed: qps%' GROUP BY Project ORDER BY count DESC LIMIT 1000
Group evaluation
No Grouping
Trigger Condition
-
SLS triggers a Critical alert if a Project's write operation quota is exceeded more than 10 times.
-
SLS triggers a Medium alert if a Project's write operation quota is exceeded more than once.
-
When data matches
count > 10, Severity: Critical. -
When data matches
count > 1, Severity: Medium.
NoteDestination
SLS notification
Alert Policy
Standard Mode
Action Policy
Select an action policy as needed, or click Add to create a new one. For more information, see action policies.
-
-
After configuring the parameters, click OK.
Resource quota adjustment
Log on to the Simple Log Service console.
In the Projects section, click the one you want.

-
Click the
 icon.
icon. -
Click Manage next to Resource Quotas.
-
In the Resource Quotas panel, adjust the quotas for the target resources and click Save.