A topology chart visualizes system architecture, service dependencies, and data flow direction.
Introduction
A topology chart is a system-level view that shows dependencies and high-level status across modules or applications.
Log Service parses and structures collected topology data. The following figure shows a raw data sample. The child and parent fields indicate dependencies between modules or applications, but this format is not intuitive.
To visualize topology data, run a query and analysis statement that extracts the relationship fields. For example, * | SELECT child, parent, child_type, parent_type FROM log retrieves the child, child_type, parent, and parent_type fields to generate a topology chart. Supported layouts: Force-directed Layout, Hierarchical Layout, or Circular Layout.
To get started, Add a chart to a dashboard.
Configuration example
Log on to the Simple Log Service console. In the Projects section, click the project you want.

-
In the left-side navigation pane, choose . In the Dashboard list, click the dashboard you want. In the upper-right corner of the dashboard page, click Edit. In edit mode, choose .
-
Configure the Topology Configuration and Layout Configuration sections on the right. On the left, set the time range, select a Logstore, and enter a query and analysis statement. Click Apply at the top of the page to view the chart.
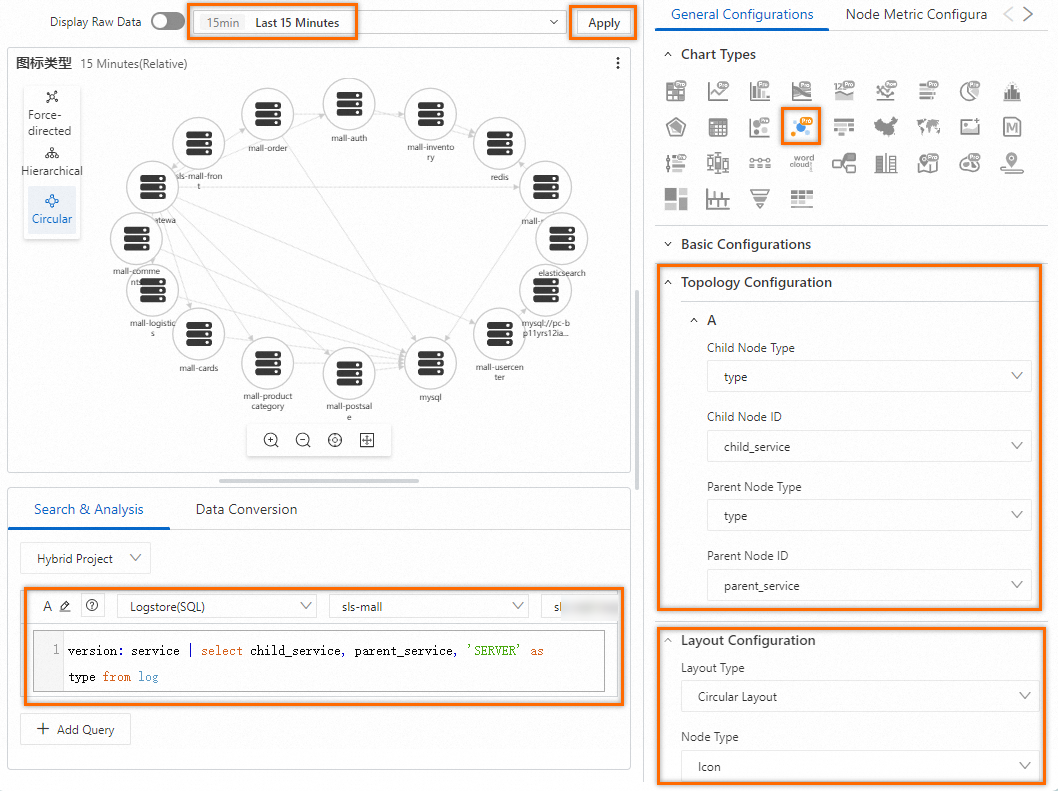
The following statement retrieves the child_service, parent_service, and type fields to generate the topology chart.
version: service | select child_service, parent_service, 'SERVER' as type from log
General configurations
Set global properties for the topology chart.
-
Basic configurations
Parameter
Description
Title
Set the title of the chart.
Display Title
When you turn on the Display Title switch, the title is displayed in the chart.
Display Border
When you turn on Display Border, a border is displayed in the chart.
Display Background
After you turn on the Display Background switch, a background color is displayed in the chart.
Display Time
After you turn on the Display Time switch, the query time is displayed in the chart.
Fixed Time
After you turn on the Fixed Time switch, the time range for the query and analysis is fixed and is not affected by the global time of the dashboard.
-
Topology configuration
Parameter
Description
Child Node Type
Select the field that represents the child node type.
Child Node ID
Select the field that represents the child node ID.
Parent Node Type
Select the field that represents the parent node type.
Parent Node ID
Select the field that represents the parent node ID.
Note-
Log Service provides 13 built-in node icons: Server, Database, WEB, MQ, Server Load Balancer (SLB), Web Application Firewall (WAF), Object Storage Service (OSS), Alibaba Cloud DNS, Switch, Router, Android, iOS, and Windows.
-
If no node type is specified in the Child Node Type and Parent Node Type fields, Log Service uses the default Server icon.
-
Variable substitution
Parameter
Description
Variable substitution
Variable substitution is equivalent to adding a filter of the variable type to a single chart. After you configure variable substitution in General configurations, Simple Log Service adds a filter to the upper-left corner of the current chart. You can select a value from the filter. Simple Log Service automatically replaces the variable in the query and analysis statement with the selected variable value and runs a query and analysis operation. For a configuration example, see Example 2: Set variable substitution.
Node metric configuration
The general configurations produce a topology chart showing node dependencies without metrics. Configure node metrics to add metric data.
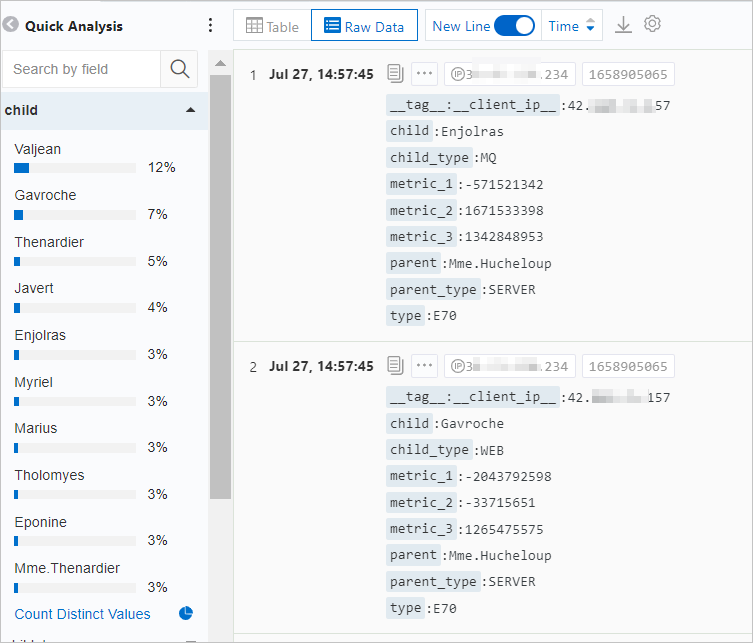
The following figure shows sample metric data. The node field corresponds to the child and parent fields in topology data. Use the node field to link metrics to nodes in the chart.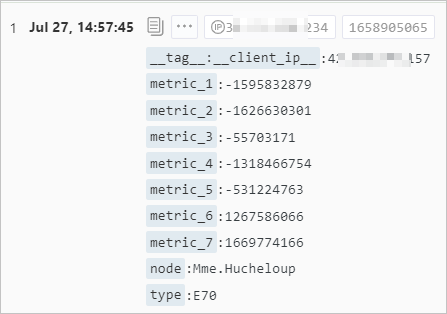
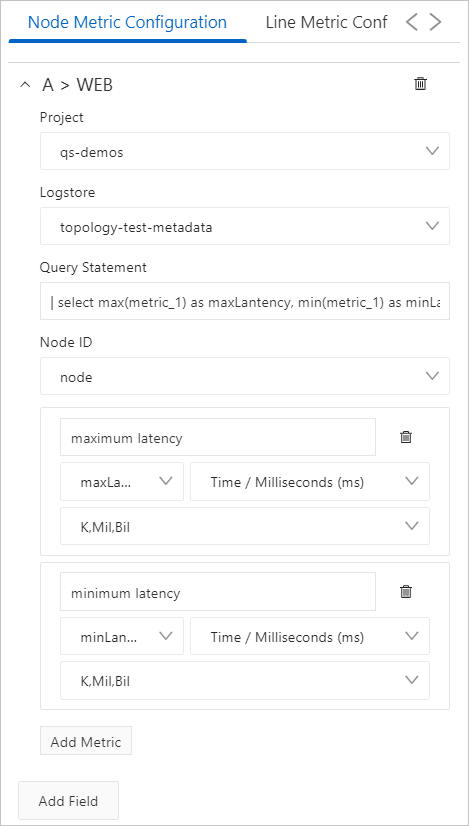
You can configure different metrics for each node type. This example uses A > WEB.
In A > WEB, select the Project and Logstore that contain the metric data, then enter a query and analysis statement. For example, if metric_1 represents latency, run * | SELECT max(metric_1) AS maxLantency, min(metric_1) AS minLantency, node FROM log GROUP BY node to calculate the maximum and minimum latency per node.
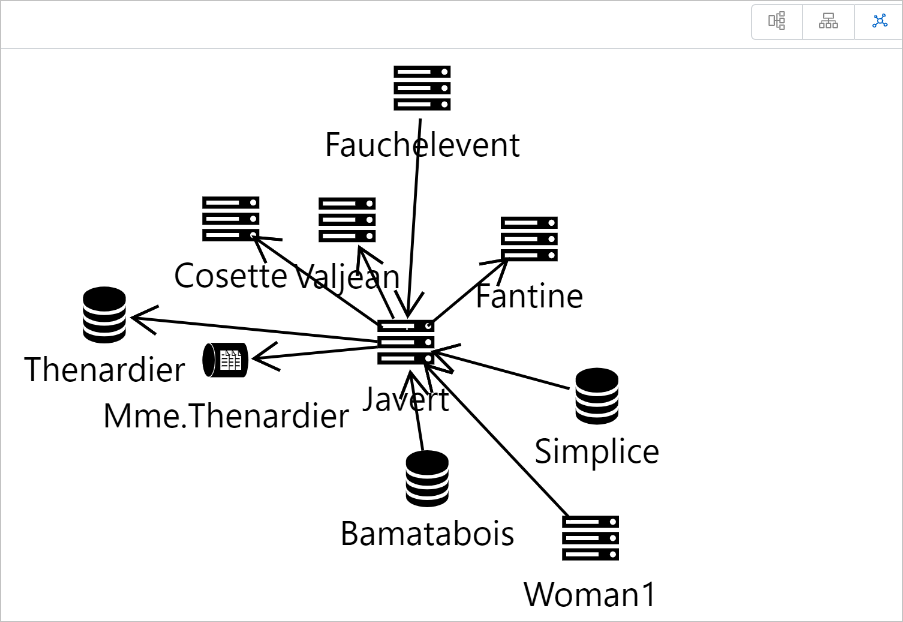
Hover over a node to view its metrics, or click a node to hide unrelated nodes and connections.
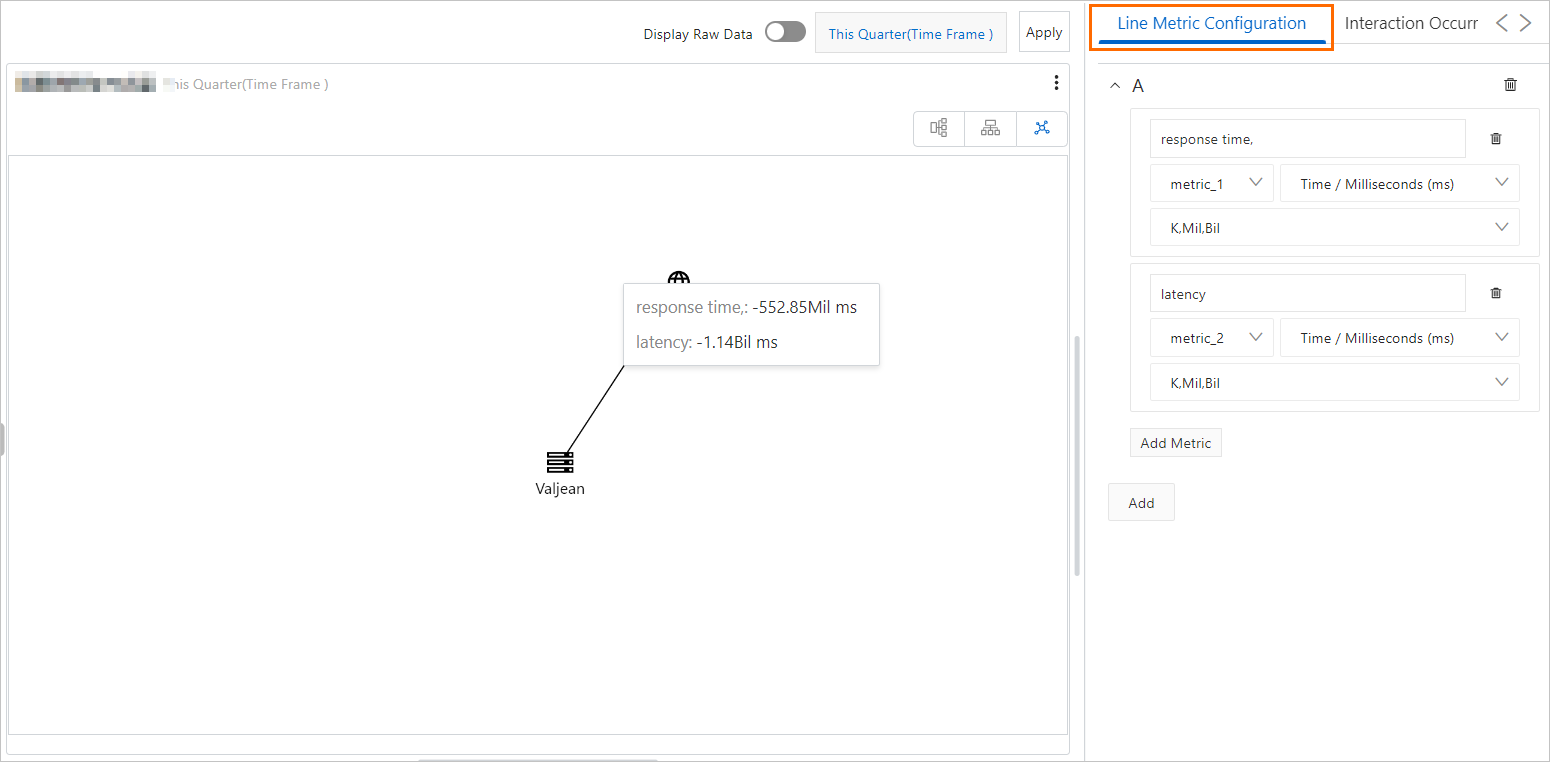
Line metric configuration
The query and analysis statement and its fields determine node dependencies. Different line types correspond to different query and analysis statements. To configure line metrics, include the line metric fields in the topology query and analysis statement.
For example, if metric_1 indicates response time and metric_2 indicates latency, use Query A to extract metric_1 and metric_2, then configure these fields in Line Metric Configuration.
Hover over a connection line to view its metrics, or click a line to hide unrelated nodes and connections.
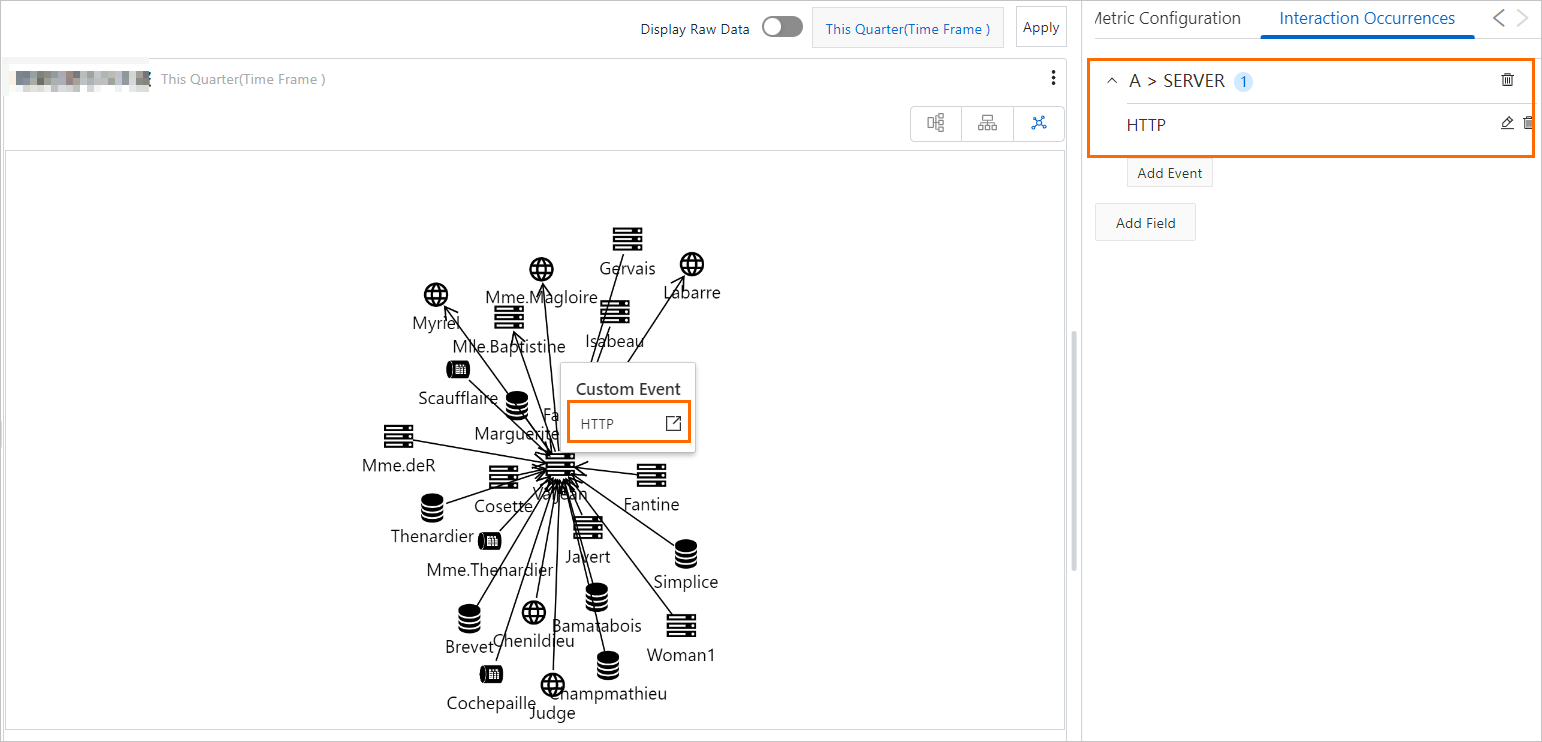
Interaction events
Interaction events enable drill-down analysis on nodes. Supported events: Open Logstore, Open Quick Query, Open Dashboard, Open Trace Analysis, Open Trace Details, and Custom HTTP URL. Add interaction events to a dashboard for drill-down analysis.
For example, A > SERVER sets an interaction event for SERVER nodes from Query A. If you set it to Create Custom HTTP URL, right-click a SERVER node and select Create Custom HTTP URL to open the specified URL.