The logstore contains much time series data. Simple Log Service simplifies the processing of this data using time-series Simple Log Service Processing Language (SPL) instructions and functions.
What is time series?
Time series is a two-dimensional data structure comprising time and metric dimension sequences, suitable for representing collections of time-varying observations. It corresponds to tabular data.
Time series model vs. table model
Aspect | Table model | Time series model |
Data organization | Discrete time point records (row storage) | Continuous time series (column storage) |
Query mode | Aggregation calculation based on discrete points | Supports time series operations such as sliding window |
Storage efficiency | Suitable for low-frequency discrete events | Optimized for high-frequency continuous metric storage |
Example
In analyzing NGINX access logs, calculate the average response time per minute by URI.
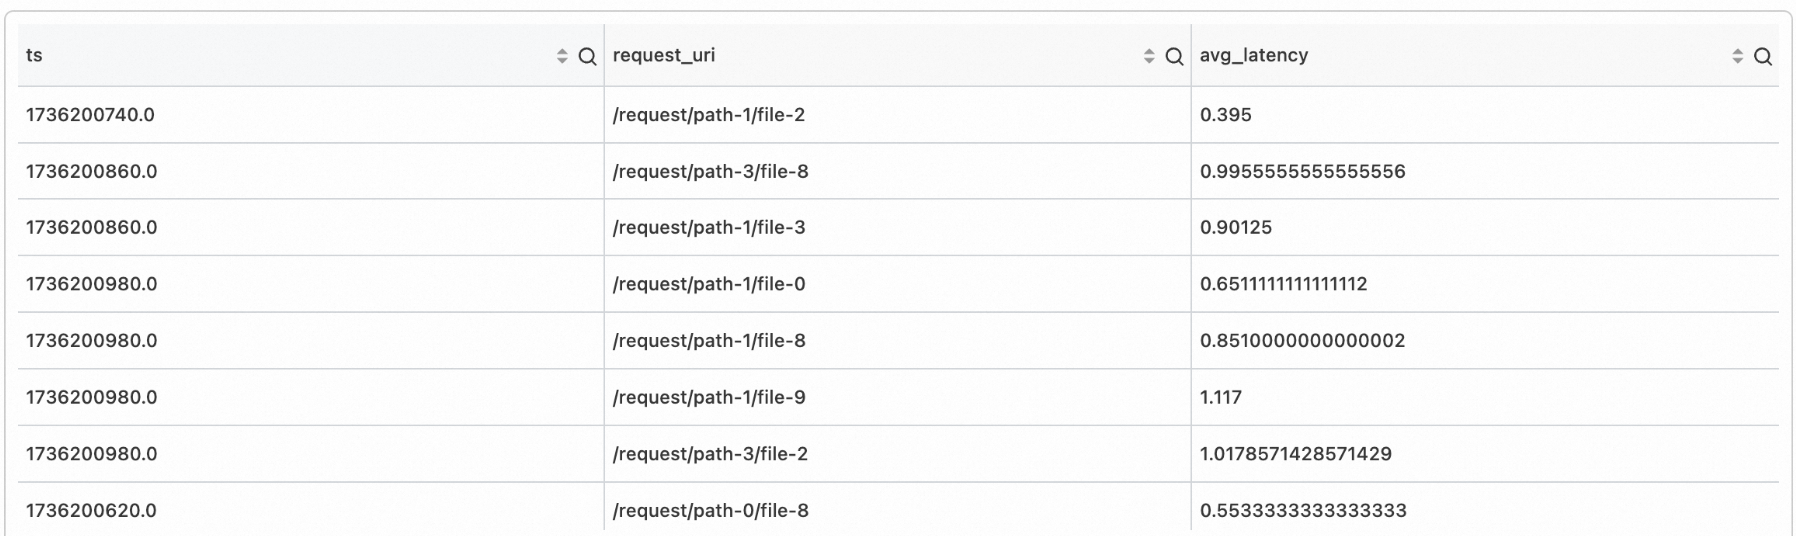
Table model
*
| extend ts =  to_unixtime(date_trunc('hour',date_parse(time_local, '%d/%b/%Y:%H:%i:%s')))
| stats avg_latency = avg(cast(upstream_response_time as double)) by ts,request_uri
Example of discrete time point aggregation result:
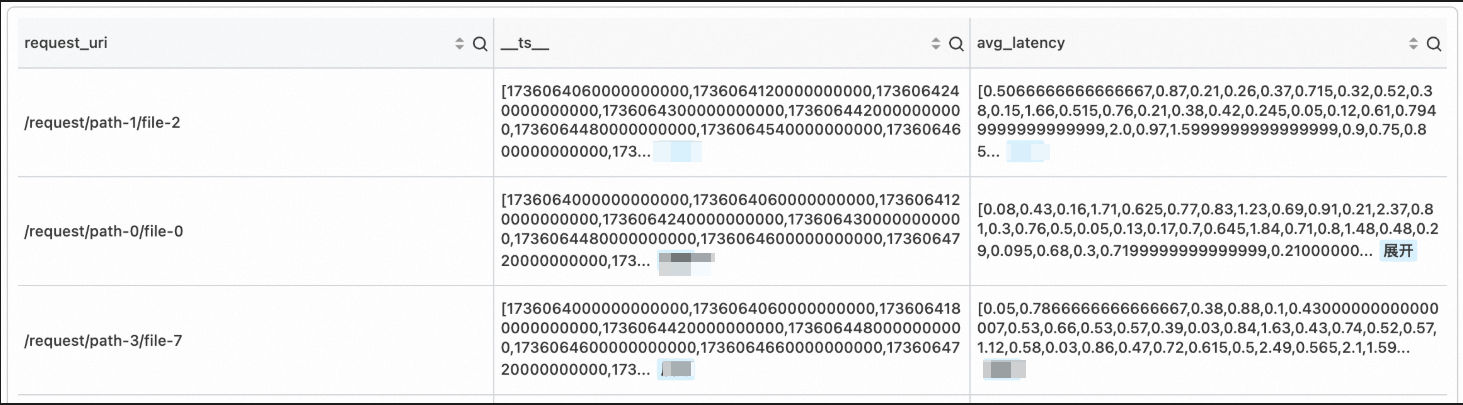
Time series model implementation
*
| stats avg_latency=avg(cast(upstream_response_time as double)) by time_local, request_uri
| make-series avg_latency default = 'last'
    on time_local
    from 'sls_begin_time' to 'sls_end_time'
    step '1m'
    by request_uri
Example of continuous time series visualization:
SPL instructions
SPL instructions are used to transform tabular data into time series data.
Instruction | Description |
Builds tabular data into time series data. | |
Renders SPL query results as charts for visualization. |
SPL functions
After data is processed into a time series, SPL functions can be called for visualization.
Function name | Description |
Time conversion function: Converts second-level timestamps to nanosecond-level, suitable for high-precision scenarios. | |
Time series prediction function: Predicts future trends based on historical data, suitable for monitoring, analysis, and planning. | |
Anomaly detection function: Based on machine learning algorithms, identifies anomalous points or patterns in time series, suitable for monitoring, alerting, and data analysis scenarios. | |
Time series decomposition and anomaly detection function: Based on time series decomposition algorithms, splits raw data into trend, seasonality, and residual components, and analyzes the residual component using statistical methods to identify anomalies, suitable for real-time monitoring, root cause analysis, and data quality detection scenarios. | |
A drill-down function for time series analysis that allows for more granular analysis of data within specific time periods based on time-grouped statistics. | |
Supports quick group analysis of multiple time series (or vector data) to identify similar metric curves, detect anomalous patterns, or categorize data patterns. |