SLS scan queries and analyzes logs by scanning target fields without requiring index configuration. It supports scan query (SPL) and scan analysis (SQL).
Prerequisites
-
Logs are collected. Data collection.
-
Indexes are created. Create an index.
ImportantThe target scan field does not need an index, but query statements still depend on indexes.
Procedure
Log on to the Simple Log Service console.
In the Projects section, click the one you want.

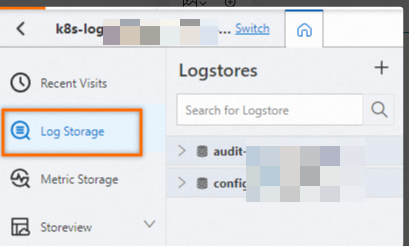
On the tab, click the logstore you want.
-
In the search box, enter a scan statement.
Supported formats:
Query statement | SPL statementorQuery statement | set session mode=scan; Analytic statement (Standard SQL). -
In the upper-right corner, set the time range.
You can set a relative time, a time frame, or a custom time range. Minimum granularity: one minute.
Automatic scanning
Automatic scanning and page turning are available only for scan queries.
If No results found for this scan appears after a scan query, click the Scan icon. The system automatically scans until it finds matching logs or reaches 20 attempts.
The Automatic Scanning dialog box shows the scan progress.
Each scan record shows the scan sequence number, current result count, scan progress percentage, processing timestamp, and scan status (e.g., Scan complete, no results).
Pagination
When you turn a page, SLS runs another scan to ensure continuous results.
Each scan processes up to 100,000 logs. A page may return fewer results than the Items per Page value, but you can still go to the next page. This means fewer than Items per Page matching logs were found in the current 100,000-log batch.
For example, with 200,000 total logs and Items per Page set to 20, one scan may return only 15 logs while the next page button remains active. This means only 15 of the first 100,000 logs matched. Click next to scan the remaining 100,000 logs.
Examples
-
Query logs for successful requests.
-
Scan statement
* | where Status='Success' -
Scan results: Query results are returned in Scan mode, with 56.74 KiB of data scanned and 4.19% scan progress. The histogram shows log distribution over time, and raw log records contain fields such as AlertStatus (value: inactive) and Condition (value:
Count:__count__ > 0; Condition:inflow > 27).
-
-
Query logs for a specific file at a specific time.
-
Scan statement
* | where file = 'file:Android' | where time ='[2024-04-24T10:07:27.427014479]' -
Scan results: In Scan mode, 375.46 KiB of data is scanned, returning 2 matching logs at 2024-04-24 10:38:13 and 2024-04-24 10:38:00, with the file field value
/var/log/nginx/test.log.
-
-
Count requests by status.
-
Scan statement
NoteScan analysis requires
set session mode=scan;before the SQL statement.* | set session mode=scan; SELECT Status, count(*) AS PV GROUP BY Status -
Scan results: Scan results show 470 rows scanned, 1.29 MiB of data. The query results table shows Status as Success and PV as 470.
-
API calls
Call the GetLogs operation to use scan programmatically. Query logs in a Logstore.
Add set session mode=scan; to the analytic statement in the query parameter. For example: * | set session mode=scan; select count(*) as pv.