Analyzing Java error logs in big data and high-concurrency scenarios helps reduce O&M costs. Simple Log Service collects Java error logs from Alibaba Cloud services and parses them by using data transformation.
Prerequisites
Java error logs from SLS, OSS, SLB, and ApsaraDB RDS are collected and stored in a Logstore named cloud_product_error_log. For more information, see Use Logtail to collect logs.
Use cases
For example, you have developed a Java application named Application A by using multiple Alibaba Cloud services, such as OSS and SLS. You have created a Logstore named cloud_product_error_log in the China (Hangzhou) region to store Java error logs generated by API calls to these services. To fix Java errors efficiently, you need to analyze the error logs at regular intervals by using Simple Log Service.
To meet these requirements, parse the log time, error code, status code, service information, error message, request method, and error line number from the collected logs. Then store the parsed logs in each service's Logstore for error analysis.
The following is a sample raw log:
__source__:192.0.2.10
__tag__:__client_ip__:203.0.113.10
__tag__:__receive_time__:1591957901
__topic__:
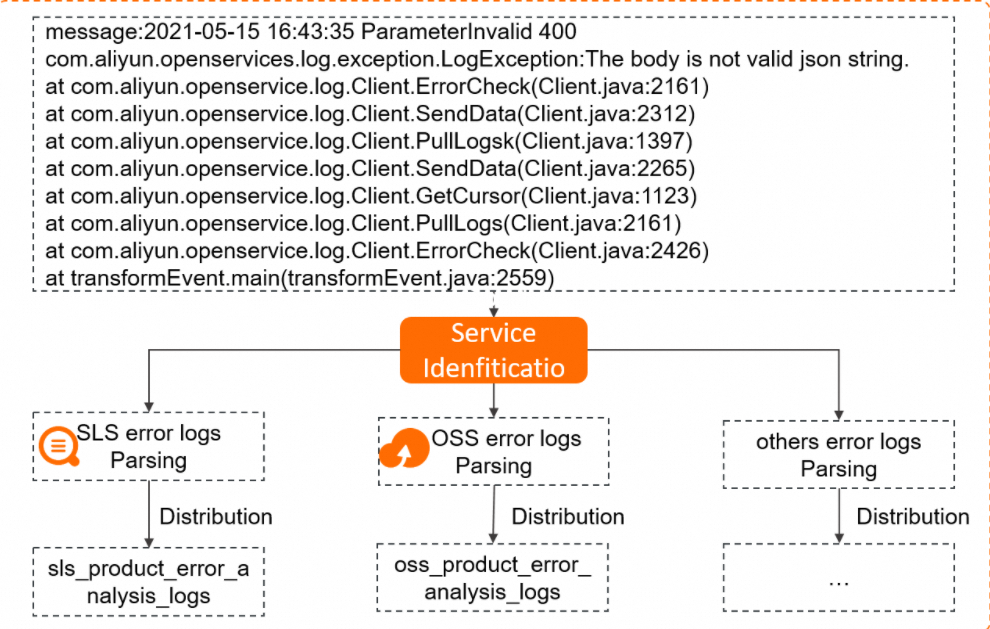
message: 2021-05-15 16:43:35 ParameterInvalid 400
com.aliyun.openservices.log.exception.LogException:The body is not valid json string.
at com.aliyun.openservice.log.Client.ErrorCheck(Client.java:2161)
at com.aliyun.openservice.log.Client.SendData(Client.java:2312)
at com.aliyun.openservice.log.Client.PullLogsk(Client.java:1397)
at com.aliyun.openservice.log.Client.SendData(Client.java:2265)
at com.aliyun.openservice.log.Client.GetCursor(Client.java:1123)
at com.aliyun.openservice.log.Client.PullLogs(Client.java:2161)
at com.aliyun.openservice.log.Client.ErrorCheck(Client.java:2426)
at transformEvent.main(transformEvent.java:2559)Workflow
Logtail collects error logs from Application A and sends them to a Logstore named cloud_product_error_log. The logs are then processed by using data transformation and delivered to the respective Logstores for analysis. The overall workflow is as follows:

-
Design a data transformation statement: Analyze the data and write a transformation statement.
-
Create a data transformation job: Distribute logs to Logstores based on the service for error analysis.
-
Query and analyze data: Analyze the error logs in each service's Logstore.
Step 1: Design a data transformation statement
Transformation process
To analyze error logs:
-
Extract the timestamp, error code, status code, service information, error message, request method, and error line number from the
messagefield. -
Store the error logs in each service's Logstore.
Transformation logic
Analyze the timestamp, error code, status code, service information, error message, request method, and error line number in the raw logs. Then design a regular expression to extract these fields.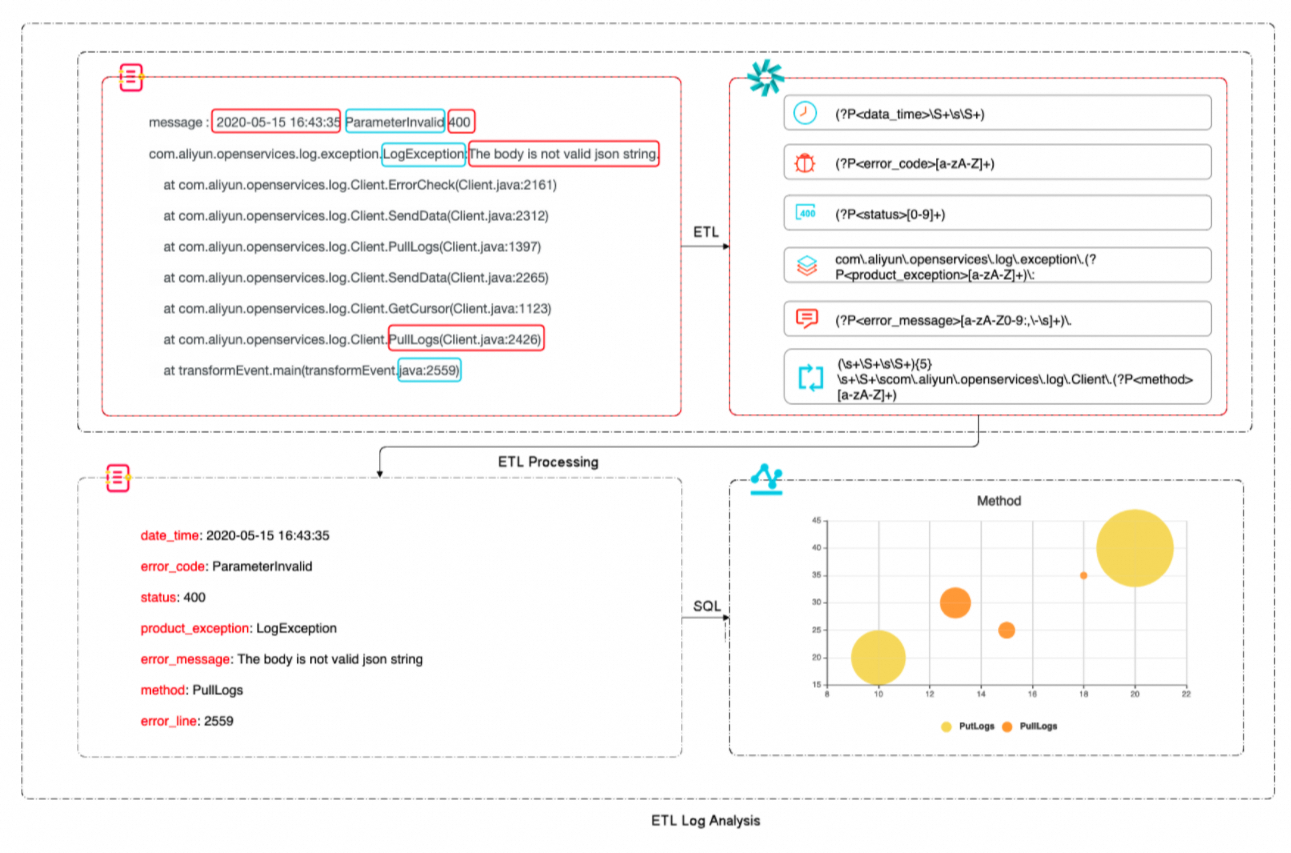
Syntax reference
-
Use the
regex_matchfunction to check if a log entry containsLogException. For more information, see regex_match. -
If a log matches
LogException, it is processed according to the parsing rules for SLS error logs. If it matchesOSSException, it is processed according to the rules for OSS error logs. For more information, see e_switch. -
Use the
e_regexfunction to parse the corresponding error logs with a regular expression. For more information, see e_regex. -
Delete the original
messagefield and deliver the parsed data to the appropriate service's Logstore. For more information, see e_drop_fields and e_output. -
For more information, see Groups in regular expressions.
Syntax analysis
The following example shows how to parse an SLS error log by using a regular expression:
The complete transformation syntax is as follows:
e_switch(
    regex_match(v("message"), r"LogException"),
    e_compose(
        e_regex(
            "message",
            "(?P<data_time>\S+\s\S+)\s(?P<error_code>[a-zA-Z]+)\s(?P<status>[0-9]+)\scom\.aliyun\.openservices\.log\.exception\.(?P<product_exception>[a-zA-Z]+)\:(?P<error_message>[a-zA-Z0-9:,\-\s]+)\.(\s+\S+\s\S+){5}\s+\S+\scom\.aliyun\.openservices\.log\.Client\.(?P<method>[a-zA-Z]+)\S+\s+\S+\stransformEvent\.main\(transformEvent\.java\:(?P<error_line>[0-9]+)\)",
        ),
        e_drop_fields("message"),
        e_output("sls-error"),
    ),
    regex_match(v("message"), r"OSSException"),
    e_compose(
        e_regex(
            "message",
            "(?P<data_time>\S+\s\S+)\scom\.aliyun\.oss\.(?P<product_exception>[a-zA-Z]+)\:(?P<error_message>[a-zA-Z0-9,\s]+)\.\n\[ErrorCode\]\:\s(?P<error_code>[a-zA-Z]+)\n\[RequestId\]\:\s(?P<request_id>[a-zA-Z0-9]+)\n\[HostId\]\:\s(?P<host_id>[a-zA-Z-.]+)\n\S+\n\S+(\s\S+){3}\n\s+\S+\s+(.+)(\s+\S+){24}\scom\.aliyun\.oss\.OSSClient\.(?P<method>[a-zA-Z]+)\S+\s+\S+\stransformEvent\.main\(transformEvent\.java:(?P<error_line>[0-9]+)\)",
        ),
        e_drop_fields("message"),
        e_output("oss-error"),
    ),
)
Step 2: Create a data transformation job
-
Navigate to the data transformation page.
In the Projects section, click the project you want.
On the tab, click the logstore you want.
-
On the query and analysis page, click Data Transformation.
-
In the upper-right corner of the page, select a time range for the log data.
Make sure that logs are available on the Raw Logs tab.
-
In the editor, enter the data transformation statement.
e_switch( regex_match(v("message"), r"LogException"), e_compose( e_regex( "message", "(?P<data_time>\S+\s\S+)\s(?P<error_code>[a-zA-Z]+)\s(?P<status>[0-9]+)\scom\.aliyun\.openservices\.log\.exception\.(?P<product_exception>[a-zA-Z]+)\:(?P<error_message>[a-zA-Z0-9:,\-\s]+)\.(\s+\S+\s\S+){5}\s+\S+\scom\.aliyun\.openservices\.log\.Client\.(?P<method>[a-zA-Z]+)\S+\s+\S+\stransformEvent\.main\(transformEvent\.java\:(?P<error_line>[0-9]+)\)", ), e_drop_fields("message"), e_output("sls-error"), ), regex_match(v("message"), r"OSSException"), e_compose( e_regex( "message", "(?P<data_time>\S+\s\S+)\scom\.aliyun\.oss\.(?P<product_exception>[a-zA-Z]+)\:(?P<error_message>[a-zA-Z0-9,\s]+)\.\n\[ErrorCode\]\:\s(?P<error_code>[a-zA-Z]+)\n\[RequestId\]\:\s(?P<request_id>[a-zA-Z0-9]+)\n\[HostId\]\:\s(?P<host_id>[a-zA-Z-.]+)\n\S+\n\S+(\s\S+){3}\n\s+\S+\s+(.+)(\s+\S+){24}\scom\.aliyun\.oss\.OSSClient\.(?P<method>[a-zA-Z]+)\S+\s+\S+\stransformEvent\.main\(transformEvent\.java:(?P<error_line>[0-9]+)\)", ), e_drop_fields("message"), e_output("oss-error"), ), ) -
Click Preview Data.
__source__: xxx __tag__:__client_ip__: xxx __tag__:__receive_time__: 1590978615 __topic__: data_time: 2020-05-16 18:30:06 error_code: AccessDenied error_line: 399 error_message: You are forbidden to list buckets host_id: xxx.oss-cn-hangzhou.aliyuncs.com method: getBucket product_exception: OSSException request_id: YGYLUM9LG2USA6M7HYUBT1L0 -
Create the data transformation job.
-
Click Save as Transformation Job.
-
In the Create Data Transformation Job panel, configure the following parameters and click OK.
Parameter
Description
Job name
The name of the data transformation job. For example, enter test.
Authorization method
Select Default Role to grant permissions to read data from the source Logstore.
Storage target
Target name
The name of the storage target. For example, enter sls-error and oss-error.
Target region
Select the region of the destination project. For example, select China (Hangzhou).
Target project
The destination project for transformed data.
Target store
The destination Logstore for transformed data. For example, enter sls-error and oss-error.
Authorization method
Select default role to grant permissions to write the data transformation results to the destination Logstore.
Processing range
Time range
Select All for the time range.
After you create a data transformation job, Simple Log Service creates a dashboard for the job by default. You can view the job metrics on the dashboard.
The Exception Detail chart shows which log entries failed to parse, helping you refine your regular expression.
-
A WARNING-level log indicates a parsing failure that does not interrupt the job.
-
An ERROR-level log interrupts the job. Identify and resolve the issue, then modify the regular expression until the job can parse all types of error logs.
-
Step 3: Analyze error log data
After the raw error logs are transformed, you can analyze the structured data. This section uses Simple Log Service Java error logs as an example.
In the Projects section, click the one you want.

On the tab, click the logstore you want.

-
In the search box, enter a query statement.
-
Count the number of errors for each method.
* | SELECT COUNT(method) as m_ct, method GROUP BY method -
Find the most common error message for the
PutLogsmethod.* | SELECT error_message,COUNT(error_message) as ct_msg, method WHERE method LIKE 'PutLogs' GROUP BY error_message,method -
Count the occurrences of each error code.
* | SELECT error_code,COUNT(error_code) as count_code GROUP BY error_code -
Create a timeline of errors to view API call error information in real time.
* | SELECT date_format(data_time, '%Y-%m-%d %H:%m:%s') as date_time,status,product_exception,error_line, error_message,method ORDER BY date_time desc
-
-
Click 15Minutes(Relative) to set the time range for the query.
You can specify a relative time, a time frame, or a custom time range.
NoteThe query result may have a margin of error of up to one minute.
-
Click Search & Analyze to view the query and analysis results.