CloudLens for RDS collects audit logs, error logs, and slow query logs from ApsaraDB RDS instances for auditing, analysis, and alerting. You can enable collection manually for individual instances or configure automatic collection for multiple instances—including future ones—that match specific criteria.
Prerequisites
-
To enable manual log collection, create a Project and Logstore in the region of your ApsaraDB RDS instance.
-
If you use a RAM user, authorize it to use CloudLens for RDS.
Enable log collection manually
CloudLens for RDS collects audit logs, error logs, and slow query logs. The procedure is similar for all types. The following steps use audit logs as an example.
-
Log on to the Simple Log Service console.
-
In the Log Application section, on the Cloud Service Lens tab, click CloudLens for RDS.
-
If this is your first time enabling the feature, complete the authorization as prompted.
-
A system role named AliyunLogArchiveRole is automatically created. CloudLens for RDS assumes this role to write logs.
-
A service-linked role named AliyunServiceRoleForSLSAudit is created automatically. CloudLens for RDS assumes this role to collect ApsaraDB RDS audit logs. Manage the AliyunServiceRoleForSLSAudit service-linked role.
-
-
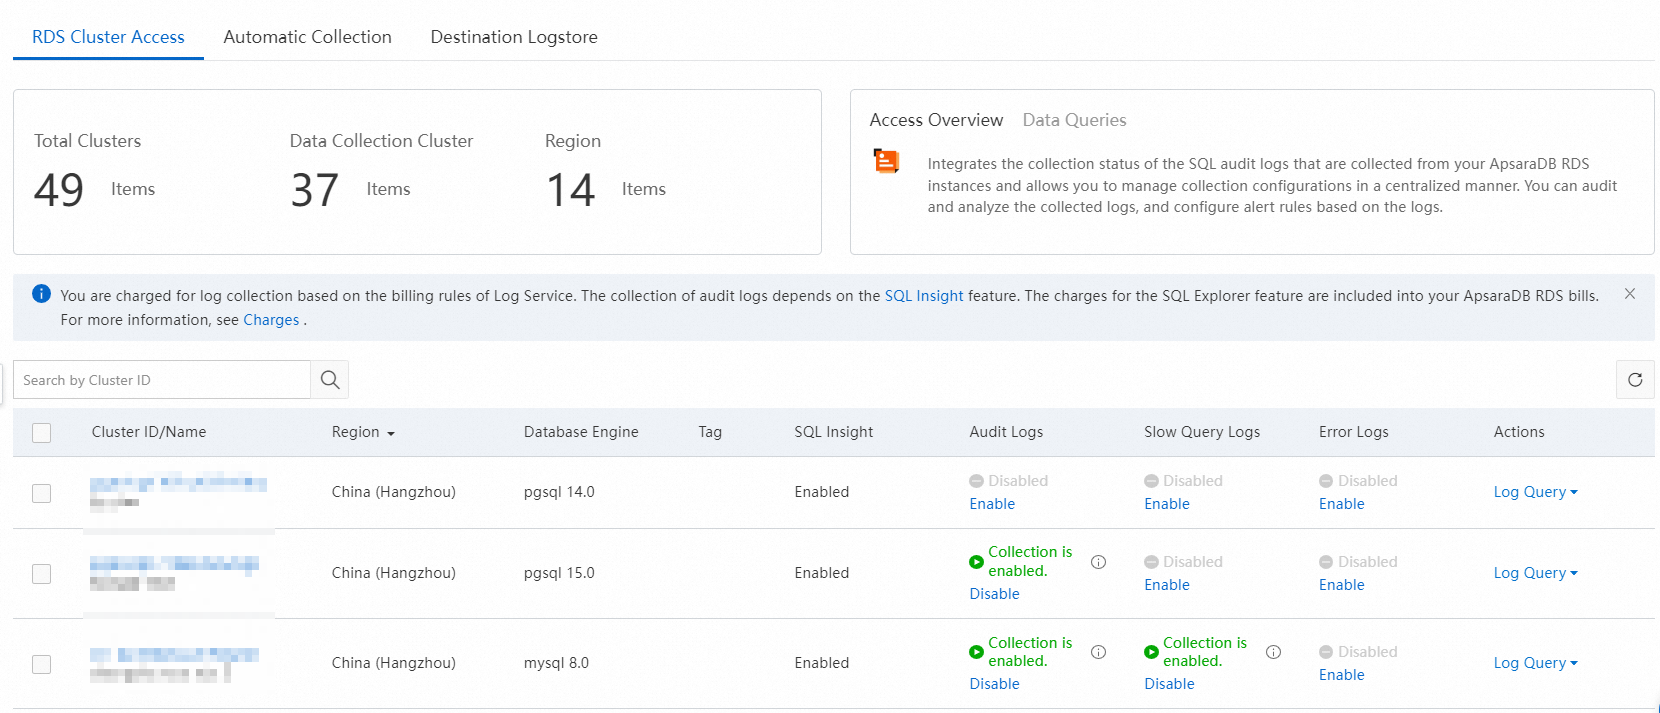
On the Data Import Management page, on the RDS Cluster Access tab, find the target ApsaraDB RDS instance and click Enable in the Audit Logs column.
-
In the Enable audit log collection dialog box, select the destination Project and Logstore, and then click Confirm.
After you enable log collection, SLS starts collecting audit logs from the ApsaraDB RDS instance.
Configure automatic log collection
CloudLens for RDS collects audit logs, error logs, and slow query logs. The procedure is similar for all types. The following steps use audit logs as an example.
-
Log on to the Simple Log Service console.
-
In the Log Application section, on the Cloud Service Lens tab, click CloudLens for RDS.
-
On the Data Import Management page, click the Automatic Collection Configuration tab.
-
Turn on the Automatic Collection Configuration switch.
-
Click the icon to create a workflow in the following order: Condition, Automatic Collection Configuration, and End, and then click Save in the upper-right corner. The Condition node is optional, while the Automatic Collection Configuration and End nodes are required.
Condition
-
Set conditions based on attributes such as Alibaba Cloud account ID, region, instance ID, instance name, DB type, DB version, and tag.
-
In the lower-left corner of the dialog box, switch between Advanced Mode and Standard Mode. Standard mode combines conditions with AND. Advanced mode supports flexible combination and nesting. Matching modes of a condition node.
Automatic collection configuration
Parameter
Description
Automatic collection type
The automatic collection type. Valid values:
-
Custom Logstore: Collects audit logs from matching ApsaraDB RDS instances and sends them to the specified Logstore.
The system automatically creates the Project or Logstore if it does not exist.
-
Keep collection unchanged: When you select Keep collection unchanged, you do not need to set the Region, Project, Logstore, and Conflict Policy parameters.
-
For matching instances with log collection disabled, the system does not enable it.
-
For matching instances with log collection already enabled, the destination Logstore remains unchanged.
-
Region
Automatically set to the region of the ApsaraDB RDS instance. This value cannot be changed.
Project
A Project is automatically created in the instance's region with the name
rds-xxx-${Alibaba Cloud account ID}-${region}, such as rds-test-117918634953****-cn-hangzhou.Logstore
A Logstore named
rds_logis automatically created in the Project namedrds-xxx-${Alibaba Cloud account ID}-${region}.Conflict policy
Action taken when the specified Logstore conflicts with an existing one:
-
Ignore: The system uses the existing destination Logstore.
-
Overwrite: The system uses the newly specified destination Logstore.
-
-
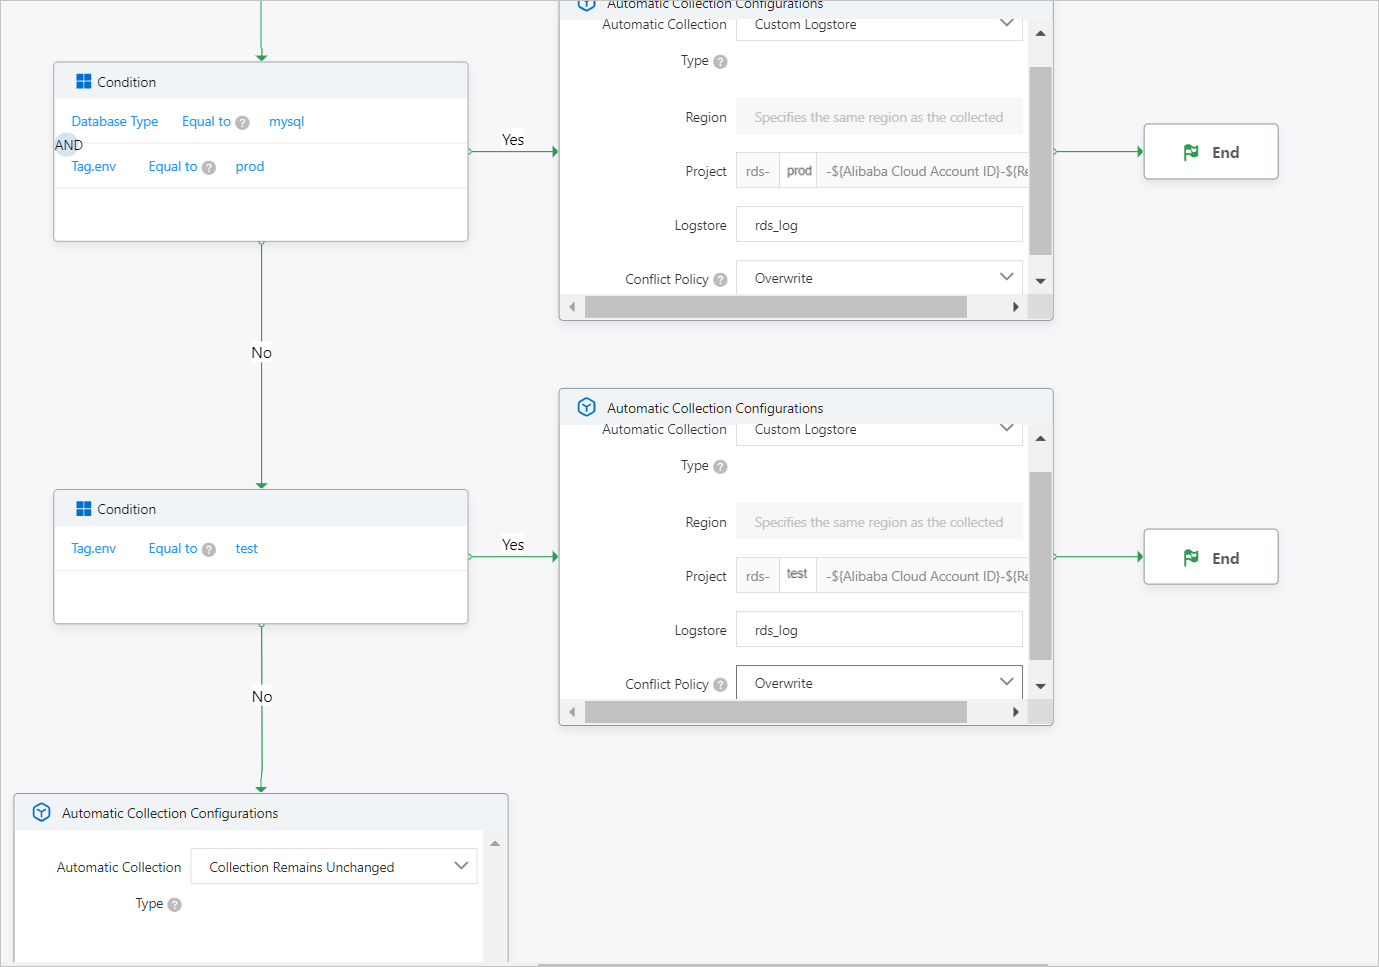
The following example shows an automatic collection configuration with three rules.
-
Audit logs from ApsaraDB RDS for MySQL instances with the
env==prodtag are sent to therds_logLogstore within therds-prod-${Alibaba Cloud account ID}-${region}Project. -
Audit logs from ApsaraDB RDS for MySQL instances with the
env==testtag are sent to therds_logLogstore within therds-test-${Alibaba Cloud account ID}-${region}Project. -
For all other ApsaraDB RDS instances, the existing destination Logstore is used.
-
Related operations
|
Actions |
Description |
|
Manage ApsaraDB RDS instances |
On the Data Import Management page, on the RDS Cluster Access tab, you can view all ApsaraDB RDS instances under your account, their regions, collection status, and other details. |
|
Disable log collection |
On the Data Import Management page, on the RDS Cluster Access tab, find the target ApsaraDB RDS instance and click Close in the column for the log type to stop collection. |
|
Query and analyze logs |
Click Log Query for the ApsaraDB RDS instance and select a log type to go to the Logstore, where you can view raw logs and run queries and analysis. Quick start for log query and analysis. |
|
Manage a destination Logstore |
On the Data Import Management page, on the Destination Logstores tab, you can view the Projects and Logstores used for ApsaraDB RDS logs and modify the data retention period for a destination Logstore. |
|
Set up alerts |
On the Anomaly Detection page, you can enable alerts. Set up alerts. |
|
View reports |
On the Report Center page, select a destination Logstore to view dashboards such as Audit Operation Center, Audit Security Center, or Audit Performance Center. |