Use the SLS Data Import feature to ingest OpenClaw AI agent logs with one click. Built-in audit and observability dashboards deliver out-of-the-box security auditing and operational monitoring.
Background
OpenClaw security risks
OpenClaw is a leading open-source AI agent platform that lets LLMs directly manipulate file systems, execute shell commands, browse the web, and send messages. This autonomous execution capability is both its core value and its primary risk.
-
Industry security incidents
In early 2026, security vendors disclosed multiple OpenClaw vulnerabilities:
Source
Findings
Security research statistics
Over 40,000 OpenClaw instances are accessible from the public internet across multiple countries. Of these, about 15,000 are unpatched or use default configurations, posing a remote control risk. Approximately 93% of exposed instances have severe authentication bypass vulnerabilities.
GitHub Security Advisory
(GHSA-g8p2-7wf7-98mq)
The Control UI blindly trusts the gatewayUrl parameter in the URL and connects automatically. By tricking a user into clicking a malicious link, an attacker can steal the gateway token and send it to their server, leading to one-click RCE (CVSS 8.8), even if the gateway is only listening on localhost. This was fixed in v2026.1.29.
Skills supply chain
Over 800 malicious Skills (about 20% of all published packages) were found in the OpenClaw Skills registry, including Skills for credential theft and installing backdoors. Installing unverified Skills escalates the AI agent's permissions.
Unit 42 and other research
Indirect prompt injection (IDPI) has been observed in real-world scenarios. Attackers embed hidden instructions in web page content. When the agent fetches this content, it may inadvertently execute these instructions, leading to data exfiltration or unauthorized operations.
Regulatory oversight and warnings
Regulators in multiple countries are focusing on the risks of AI agents. China's Ministry of Industry and Information Technology (MIIT) issued a security alert regarding the risks of the open-source OpenClaw AI agent, recommending immediate updates and security hardening.
-
Security fix frequency in OpenClaw source code
Beyond external threats, an audit of the OpenClaw source code reveals that the project itself is frequently fixing security issues. Semantic analysis of Git commit history quantifies the scale and distribution of security-related changes and identifies where the attack surface concentrates.
After filtering and categorizing recent commits in the OpenClaw repository, risks concentrate in the entry and execution layers:
Module
Security fixes
Percentage
Primary risks
src/tools/52
35%
Command injection, path traversal
src/gateway/38
26%
Access control, authentication, authorization
src/auth/18
12%
Authentication bypass, CSRF
src/sandbox/15
10%
Path traversal, SSRF
src/hooks/12
8%
Prompt injection, information disclosure
The
tools/andgateway/layers are inherent trade-offs of autonomous operations. Static audits cover only committed changes and cannot account for all runtime behavior variations or attack paths driven by external inputs. -
Why runtime protection is not enough
Properly configured, OpenClaw can reduce the attack surface. However, these are runtime checks within the same trust domain with inherent limitations:
Protection layer
Mechanism and capability
Inherent limitations
Tool policy pipeline
Allows, denies, or requires manual approval for tool calls based on policies (for example, by sender, channel, or tool name). Supports ACP approval workflows.
Policy misconfigurations, rule omissions, or policy bypasses (such as chaining legitimate tools to achieve high-risk effects) can lead to unauthorized execution. A lack of independent auditing for policy changes makes post-incident attribution difficult.
Stuck/loop detection
Detects when a session makes no substantive progress over several turns (for example, no new user/assistant messages, only repeated tool calls) and triggers an alert or termination.
Can only identify "no-progress" loops. It cannot detect multi-step operation chains that are logically consistent but have disastrous outcomes (for example, gradually inducing deletion or data exfiltration). False positives and negatives depend on threshold tuning.
Command allowlist/denylist
Filters executable commands for tools like
execandshellby using an allowlist or denylist to reduce arbitrary command execution.Obfuscated or encoded commands (such as base64-decoded execution, aliasing, or newline concatenation) have historically bypassed filters, leading to corresponding CVEs and fixes. List maintenance often lags behind new attack techniques.
Context and security instructions
Injects constraints like "Do not do X" or "Approval required for Y" through System Prompts, relying on the model to comply.
In long conversations, context window compression, summarization, or truncation can dilute or cause the model to "forget" critical security instructions. Adversarial inputs can attempt to override or weaken these constraints (prompt injection).
Runtime protection blocks most known attack paths but cannot guarantee perfect configuration or cover unknown bypasses. A secure architecture needs a complementary "sentinel" for continuous observability and auditing of the agent's callers, resource consumption, and tool call sequences.
Solution overview
Observability serves as this "sentinel," using log, metric, and trace data to monitor agent behavior, support audit trails, and answer "who is calling, how much is being spent, and what is being done." This enables early detection when policies fail or new attacks emerge.
Observability pillars for AI agents
Observability rests on three pillars: log, metric, and trace data. For OpenClaw, each pillar maps to specific data sources and core questions:
|
Pillar |
OpenClaw data source |
Core question |
|
Logs (Session audit logs) |
|
What did the agent do? Which tools did it call? How many tokens were used and how much cost was incurred? |
|
Logs (Application runtime logs) |
|
Where did the system go wrong? Webhook failures, authentication rejections, or gateway errors? |
|
Metrics |
OTLP output from the |
Are the current costs and latencies normal? Are there any stuck sessions or abnormal retries? |
|
Traces |
OTLP output from the |
What path did a single message take from receipt to response? How is the call chain connected? |
All three pillars are essential. Metrics alone cannot answer "who" or "why." Session logs alone lack a global view of system health. Runtime logs alone miss business behavior. Only together do they support security auditing, cost management, and operational troubleshooting.
SLS capabilities
SLS offers the following advantages for OpenClaw scenarios:
-
Native alignment with the OpenClaw tech stack
LoongCollector natively supports both log and OTLP protocols and excels at collecting long-text session logs. It integrates seamlessly with OpenClaw's
diagnostics-otelplugin, requiring no modifications, and sends metrics and traces directly to SLS via OTLP. -
Rich query, analysis, and processing operators
Session logs use nested JSON (for example,
message.content,message.usage.cost,message.toolName). The SLS SQL + SPL engine indexes and analyzes nested fields in real time without additional ETL. -
Security and compliance capabilities
RAM access control, sensitive data masking, and encrypted storage meet audit trail and compliance requirements. SLS holds a dedicated network security product certification, making it suitable for scenarios requiring Multi-Level Protection Scheme (MLPS) compliance. Alert channels support DingTalk, SMS, and email for timely incident notification.
-
Fully managed, pay-as-you-go, and auto scaling
Log analysis is a one-stop pipeline: "Collection → Storage → Indexing → Query → Dashboard → Alerting," fully managed by LogStore and MetricStore. The pay-as-you-go model keeps costs low at small scale, while auto scaling handles traffic growth without manual capacity planning or self-managed Elasticsearch or Prometheus clusters.
SLS is an ideal observability and audit foundation for controlled execution of OpenClaw.
SLS now offers a one-stop integration solution for OpenClaw:
-
Use the Data Import wizard to configure collection. The configuration auto-generates and provides a unified entry point and Project for session logs, application logs, and OTLP telemetry, reducing the complexity of managing separate sources.
-
A single source of session data serves multiple scenarios, including security auditing, cost analysis, and behavior analysis.
-
Pre-built dashboards for auditing, cost analysis, and runtime metrics provide a ready-to-use observability solution for controlled execution.
Procedure
Step 1: Log ingestion (session log example)
Session logs record every conversation turn, tool call, and token consumed.
Prerequisites
-
You have created a Project (for example,
openclaw-observability) and created a LogStore. -
Ensure that LoongCollector is installed on the ECS instance or on-premises server where OpenClaw is running.
Ingestion process
-
Log on to the Log Service console. In the right-side panel, click Quick Data Import, select the OpenClaw-Session Log integration card, and then select the destination Project and LogStore.
-
In the Machine Group Configurations section, find the machine group you created when installing LoongCollector in the Source Machine Group list and add it to the Applied Machine Group list.
If a machine group has a heartbeat exception: Troubleshoot heartbeat exceptions.
-
On the Logtail Configuration page, Log Service automatically fills in the built-in collection configuration. If no changes are needed, click Next.
-
The Configuration Name is pre-filled. You can modify it if needed.
-
Under Other Global Configurations, the Log Topic Type is pre-configured.
About log topic type: LoongCollector can automatically extract the topic and session_id from the file path. If you have customized the file path and it does not match the pre-filled value, you must adjust it accordingly.
-
The File Path is automatically pre-filled.
About text file path: The pre-filled file path assumes a default installation by a non-root user on a Linux host. If your actual path is different, be sure to modify it.
-
In Processing Method, a combination of processing plug-ins is pre-configured.
About time parsing: By default, OpenClaw outputs logs in the UTC+0 timezone. If you have customized this, you must also modify the timezone in the time parsing plug-in to avoid time mismatches.
-
-
On the Query and Analysis Configurations page, Log Service automatically creates a built-in index and reports. You can view them later in Dashboard and dashboards.
-
Built-in index:
-
Dashboards:
-
OpenClaw Behavior Analysis Dashboard
-
OpenClaw Security Audit Dashboard
-
OpenClaw Metrics Dashboard
-
OpenClaw Token Analysis Dashboard
-
-
Step 2: Audit and observe
SLS provides pre-built OpenClaw dashboards covering security auditing, cost analysis, behavior analysis, and runtime metrics.
-
Log on to the Log Service console. In the Projects, select the destination Project.
-
Under Log Storage, go to the destination LogStore and click Search & Analyze to verify the data ingestion and log format.
-
In the left-side navigation pane, click Dashboard to view the pre-built dashboards.
-
Security Audit Dashboard
The Security Audit Dashboard is the core panel for controlled OpenClaw execution. It answers: "What is the agent doing, are there high-risk actions, and who is performing out-of-bounds operations?" It provides real-time behavior monitoring, threat identification, and forensic capabilities across behavior overview, high-risk commands, prompt injection, and data exfiltration.
-
Security audit statistics overview page:
-
This page provides a risk snapshot with multi-dimensional counts of high-risk operations in a given time window. Seven metrics—high-risk command executions, outbound web requests, outbound command-line executions, outbound communications, sensitive file access, and prompt injection—are shown with period-over-period comparisons for quick anomaly assessment.
-
Pay special attention to high-risk operations that follow a prompt injection event. While ordinary high-risk operations may be legitimate, post-injection high-risk behavior is a strong threat signal indicating malicious instructions drove the agent to act. The "Number of sessions with tool calls after injection" is the highest-confidence signal on this page—three such sessions often warrant higher priority than hundreds of ordinary high-risk commands.
-
The high-risk sessions table aggregates risk counts per session and sorts by composite risk score, surfacing sessions that need manual intervention first.
-
-
Skills usage analysis
-
Skills are OpenClaw's mechanism for extending capabilities but also a primary entry point for prompt injection. Users may inadvertently install Skills with vulnerabilities or embedded malicious instructions. The distribution of Skills calls is therefore a crucial basis for analyzing attack paths.
-
The usage distribution pie chart establishes a baseline for Skills calls. A sudden increase in an uncommon Skill or the appearance of a new Skill often indicates the agent is being guided down an unintended path and requires investigation.
-
New entries in the Skills table are critical. Because new Skills have not been fully assessed for security, their permission boundaries and behavior patterns are a blind spot for the security team. To find new Skills as soon as they appear, sort them by first call time in descending order. This lets you review them before they are abused.
-
-
High-risk command call monitoring
-
OpenClaw's ability to execute system commands makes it a potential springboard for attackers. A compromised agent can delete files, elevate privileges, or exfiltrate data while appearing as normal task behavior.
-
High-risk command monitoring establishes an independent observability layer outside runtime protection. Configuration errors or poorly defined permission boundaries can let high-risk commands slip through. The observability layer ensures that even if runtime controls fail, high-risk operations are still detected.
-
The timeline view identifies behavior patterns beyond event counts. A dense burst of high-risk calls in a short period—a sign of a compromised agent executing malicious instructions—warrants immediate intervention. The details table provides full forensic context to trace anomalies to specific sessions and commands.
-
-
Prompt injection detection
-
Prompt injection is a core attack method that drives an AI to perform harmful actions. Regardless of the attack path, malicious instructions must enter the prompt to affect the Agent. These paths can include direct user input, data returned from Skills calls, or external data read by tools such as
web_fetchandread. The prompt is the final entry point for all attack paths. -
The distribution of injection sources helps determine the nature of the risk. Injections from direct user input are typically intentional. In contrast, users are often unaware of injections delivered through
toolResult. For personal assistant Agents such as OpenClaw, indirect injection is the primary threat. Installed Skills or accessed external content can become injection vectors that are difficult for users to identify and avoid. -
The value of classifying injections is to identify attack intent, not just to flag anomalies. For example,
ROLE_HIJACKandJAILBREAKinjections indicate an attacker is trying to bypass the Agent's behavioral boundaries.HIDDEN_INSTRUCTIONrepresents a more stealthy implantation technique. The response priority and handling procedures differ for each type. Continuously monitoring changes in the distribution of these classifications helps detect focused attempts on specific attack surfaces. -
A details table records the triggering tool, session context, and original content for each injection event. This table lets security teams quickly drill down from summary statistics to specific incidents. This closes the loop from pattern recognition to root cause analysis and response.
-
-
Sensitive data exfiltration detection
-
Data exfiltration from an AI agent is typically a chain: the agent reads a sensitive file, the content enters the model's context, and a subsequent tool call transmits it externally. Only correlating file access with outbound behavior reveals the full attack intent.
-
Detection uses a funnel approach: the first layer records sensitive file access by asset type (SSH_KEY, ENV_FILE, CREDENTIALS, CONFIG_SECRET, HISTORY). The second layer tracks outbound behavior by channel (API_CALL, MESSAGE_SEND, WEB_ACCESS, EMAIL). The third layer correlates both—if sensitive file access and an outbound operation occur in close succession within the same session, it flags a high-priority exfiltration event.
-
The value lies in causal localization, not single-point alerts. Reading an SSH_KEY alone is not a threat, nor is an API_CALL. But both in the same session, minutes apart, with outbound parameters containing the file content, dramatically increases threat confidence. The behavior chain table shows the time difference and full call parameters for forensic judgment without manual log correlation.
-
-
-
Token Analysis Dashboard
Token consumption relates directly to costs, and its fluctuations often signal anomalies such as context inflation from prompt injection. The Token Analysis Dashboard answers: "Where is the money being spent, is it reasonable, and are there anomalies?"
About cost data: The
costfield in the dashboard comes from theusage.costfield in OpenClaw. OpenClaw does not natively support tiered pricing, and its cacheRead + cacheWrite calculation logic may not align with the provider's. It only estimates the cost of a single call using a formula likeinputTokens × input + outputTokens × output + .... Therefore, the costs displayed in the dashboard are a baseline for cost estimation, not an exact billing statement. For models wherecostis not configured, the cost column will show 0.Take the Qwen3.5-Plus model as an example. The costs for Model Studio API calls can be found in the Model List.
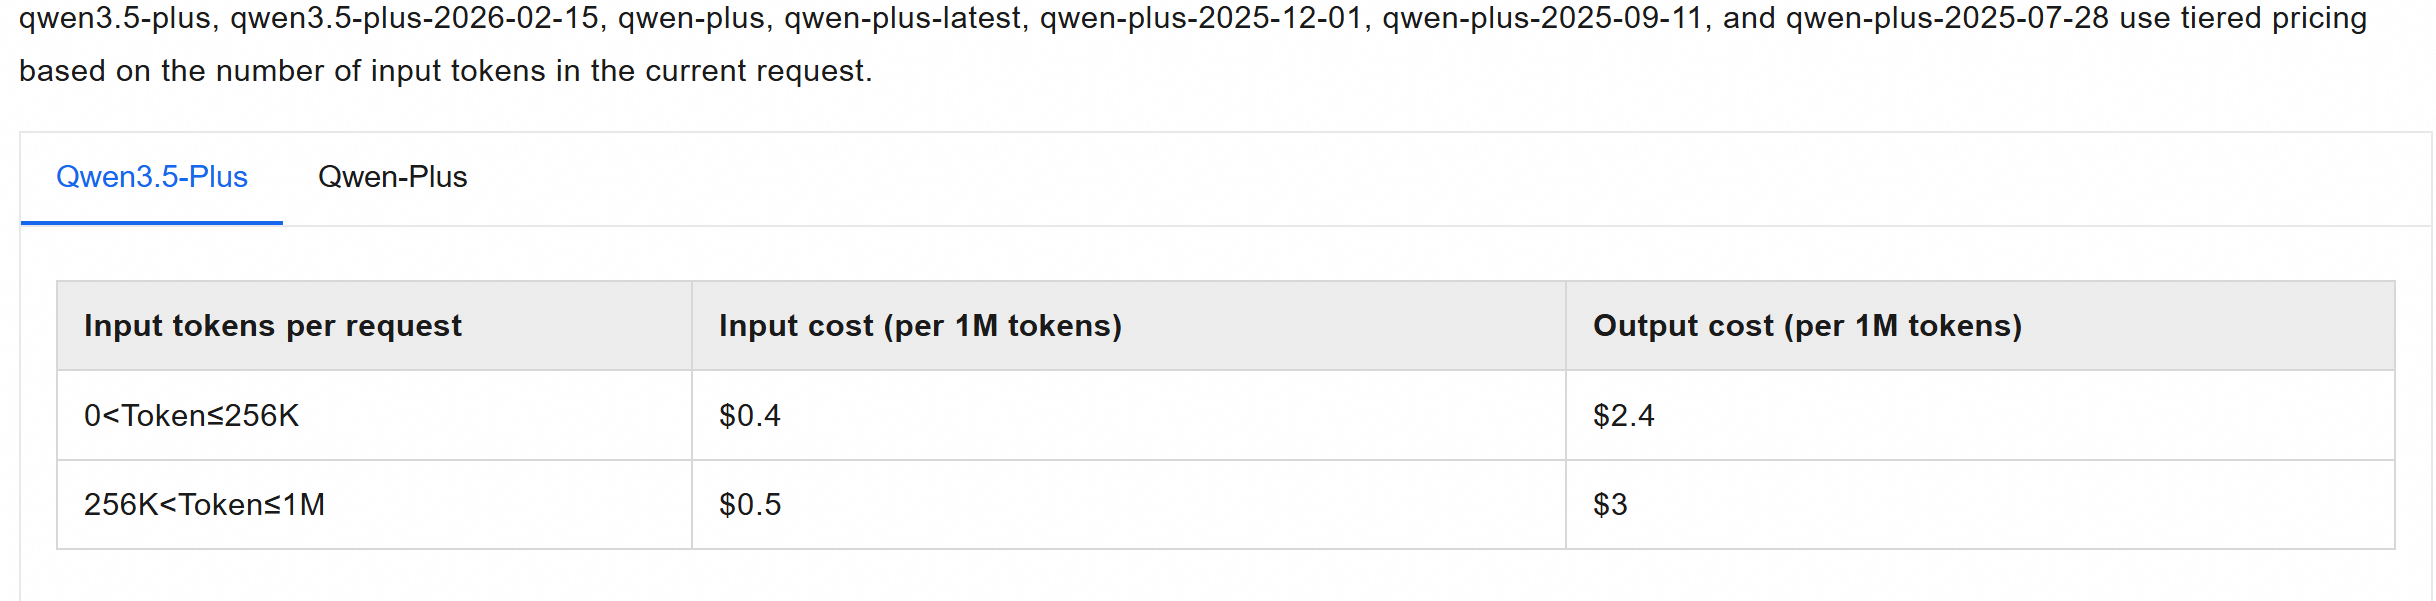
The model cost configuration in .openclaw is as follows:
{ "id": "qwen3.5-plus", "name": "Qwen3.5 Plus", "cost": { "input": 0.4, // From the lowest tier input price "output": 2.4, // From the lowest tier output price "cacheRead": 0.2, // Estimated as half of the input cost "cacheWrite": 0 }, }-
Overall overview and model distribution
-
The dashboard shows 1-day comparisons for overall tokens and cost with period-over-period percentages. If the daily change exceeds a threshold (for example, ±30%), it usually indicates prompt inflation, a call loop, or an anomalous session requiring investigation.
-
-
Consumption trends by provider / model (time series)
-
Two time-series charts (1-week) show token consumption and cost trends per model. Token spikes are often security signals: prompt injection inflating context, infinite tool call loops, or undetected session expansion. Color-coded by model, switches appear as color composition changes for quick identification.
-
-
Top consumption by session and by host/Pod (bar charts)
-
The 2×2 bar chart layout answers "who is spending the money" from session and host (or Pod) perspectives:
-
Top tokens by session / Top cost by session: Shows total tokens and costs per session for the past week, sorted descending. Cost distribution typically follows a long-tail distribution—a few sessions account for most consumption.
-
Top tokens by host / Top cost by host: Aggregates tokens and costs by host or Pod for cost analysis and risk localization in multi-instance deployments. Combined with asset ownership, this maps consumption to responsible parties and helps identify risk users or runaway sessions.
-
-
-
Model tokens details table (cost breakdown)
-
The details table (1-week relative) lists the following for each model:
totalTokens,inputTokens,outputTokens,cacheReadTokens, andcacheWriteTokens, along with their correspondingtotalCost,inputCost,outputCost,cacheReadCost, andcacheWriteCost. It supports sorting and filtering, letting you directly answer "which model spent the most money and what was the input/output breakdown." The ratio ofinputTokenstooutputTokensreflects the agent's interaction pattern: a high input ratio suggests redundant prompts or context, while a high output ratio may indicate that the model is generating a large amount of invalid content. ThecacheReadTokenspercentage directly shows the benefit of the caching strategy—the higher the percentage, the lower the actual billed amount, providing a quantitative basis for prompt engineering and cache tuning.
-
-
-
Behavior Analysis Dashboard
The Behavior Analysis Dashboard records and classifies OpenClaw's operational behavior by session, answering: "What did the agent do during the current time window?"
-
Session statistics
-
Count cards break down tool calls by behavior type—command execution, background processes, web requests, communication tools, and file I/O. Call exceptions are listed separately for stability assessment.
-
The session statistics table records call counts per behavior type within each session, sorted by last active time. Unusually active sessions (for example, 1,925 tool calls vs. typical low counts) are highlighted for priority review.
-
-
Tool call volume statistics and error analysis
-
Tool calls are the agent's only external interaction channel. The tool call timeline shows call frequency over time, color-coded by tool type—spikes are the first entry point for troubleshooting. The error rate trend chart shares a time axis; the time difference between error and volume peaks often reveals the true problem source.
-
The full tool call log provides the protocol error, execution status, and return content for each call, enabling you to quickly drill down from a trend anomaly to the specific failed call to locate the root cause.
-
-
External interactions
-
External interactions record all outbound actions initiated by the agent during its operation, including API calls, web access, message sending, and email sending. The data is presented categorized by session, tool name, and interaction type.
-
For an AI agent, external interactions are both necessary for completing tasks and a potential source of risk. A complete record of external interaction behavior helps teams understand the agent's actual capability boundaries and usage habits. On the other hand, it provides full behavioral context when anomalies occur, supporting correlation analysis and forensics across tools and sessions.
-
-
-
Step 3: Explore data with custom queries
Built-in dashboards are the starting point for problem discovery, not the end. When a dashboard flags a high-risk session, an abnormal spike, or a metric alert, you need to drill down from the statistical overview to the specific event to reconstruct the behavior chain and confirm the root cause.
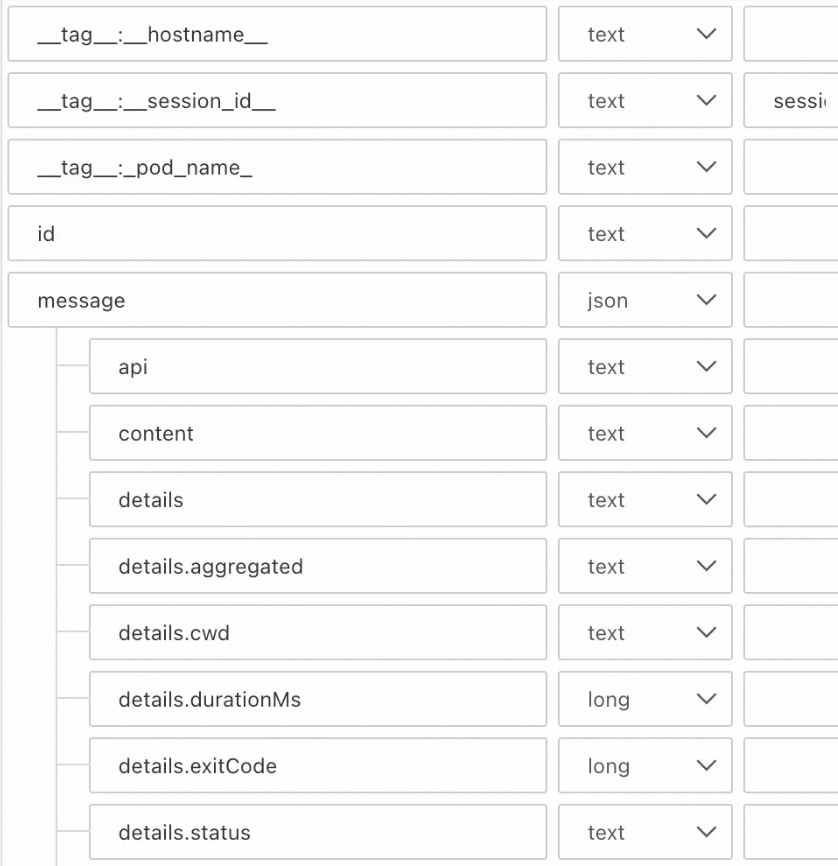
Log data model for custom analysis
SLS pre-builds an index for audit analysis, so you can query data directly. Two log types are the core data sources:
-
Session logs — Record the complete business behavior of the agent and are the primary basis for security auditing and cost analysis. These are the logs ingested in Step 1: Log ingestion (session log example).
Field path
Type
Purpose
__tag__:__session_id__text
Unique session identifier. A key field for isolating and aggregating data by session.
typetext
Entry type:
session(session metadata),message(conversation message), orcompaction(context compression summary). Use to filter for auditable conversation records.message.roletext
Message role:
user(user input),assistant(model response), ortoolResult(tool return). Use to identify the subject of the action.message.contenttext
Message body. Includes user input, model output, and tool parameters/return values. Supports injection detection, sensitive data matching, and full-text search.
message.providermessage.modeltext
Model provider and model name. Use for cost analysis and behavior statistics by model.
message.usage.totalTokensmessage.usage.cost.totallong / double
Token usage and estimated cost. Use for anomalous consumption detection and session-level cost ranking.
message.stopReasontext
Response termination reason:
stop(normal end),toolUse(tool call triggered; next entry is usually toolResult),error/aborted/timeout(abnormal termination). A key field for filtering anomalous sessions.message.toolNamemessage.isErrortext / bool
Tool call name and execution status. Use with the
toolResultrole for tool-level auditing.id,parentIdtext
Entry ID and parent ID. Use to build the conversation tree and reconstruct the message order. The
idof asessiontype entry is the sessionId.timestamptext
Event timestamp. Use for time window filtering, sorting, and defining alert scopes.
-
Runtime logs — Record the operational status of the gateway and various subsystems. This is the data foundation for troubleshooting and system health analysis.
NoteSelect the OpenClaw-Runtime Log card and follow the instructions in Step 1: Log ingestion (session log example) to complete the ingestion.
Field path
Type
Purpose
_meta.logLevelNametext
Log level (TRACE / DEBUG / INFO / WARN / ERROR / FATAL). Use to focus on ERROR and FATAL for troubleshooting.
_meta.pathtext
Source code file path and line number. Precisely links to code locations for stack trace analysis.
Numeric key
"0"object (JSON)
Structured context. Usually contains a
subsystemfield (such asgateway,channels,telegram, orplugins).Numeric key
"1"and subsequent keystext
Log message body and stack trace content. Supports full-text search and keyword matching.
Session-level drill-down
Typical scenario: The audit dashboard flags a high-risk session. The security team needs to reconstruct its complete interaction to confirm the threat.
In a multi-instance deployment, all logs are centrally written to one SLS LogStore. Isolate by session ID to clarify "who triggered what requests, what tools were called, and how the model responded."
-
Log on to the Log Service console. In the Projects, select the destination Project.
-
Under Log Storage, go to the destination LogStore and click Search & Analyze to explore the data. Use the query
* and __tag__:__session_id__:<Session_Id>to filter, replacing<Session_Id>with the actual session ID. -
After filtering the session, under the Raw Logs section, find the target log on the Raw Data tab and click the
 icon to open the contextual log view. This reconstructs the complete behavior chain within that session in its original order—user input, model inference, tool call requests, and tool execution results are clearly displayed sequentially. This is crucial for auditing—it identifies abnormal call sequences (such as a sensitive file read followed by an outbound operation) and provides full context for reproducing and preserving evidence of security incidents.
Runtime troubleshooting: keyword search and aggregation analysis
Typical scenario: An alert from the runtime metrics dashboard indicates a sudden increase in the error rate. You need to quickly locate the faulty module and root cause from a massive volume of runtime logs.
SLS supports a combination of full-text search and structured field search, which, along with time range filtering, allows you to progressively narrow down the investigation scope. A typical troubleshooting path involves two steps: first, narrow the scope, then quantify the distribution.
Step 1: Progressively filter to isolate the problem
-
Filter by log level: Use the query
_meta.logLevelName: ERROR or _meta.logLevelName: WARN or _meta.logLevelName: FATALto filter all error and warning logs, focusing attention on abnormal events. -
Drill down by subsystem: Add a field condition to the error log query, such as
0.subsystem: plugins. The full analysis statement would be(_meta.logLevelName: ERROR or _meta.logLevelName: WARN or _meta.logLevelName: FATAL) and 0.subsystem: plugins. This narrows the scope to a specific subsystem. These two filtering steps can quickly locate the relevant error logs.
Step 2: Use SQL aggregation to quantify the global distribution
While keyword filtering pinpoints individual events, SQL aggregation analysis elevates this to a global statistical view. For example, grouping by the subsystem field with the analysis statement _meta.logLevelName: ERROR or _meta.logLevelName: WARN or _meta.logLevelName: FATAL | select "0.subsystem" as subsystem, count(1) as c group by subsystem visually presents the error distribution across all subsystems. This helps you quickly identify concentrated anomalies and points you in the right direction for further investigation.
Step 4: Correlate data from multiple sources
In practice, observability data sources follow a fixed collaborative pattern of progressive narrowing and corroboration:
OTLP metrics → Application logs (error context) → Session audit logs (complete behavior chain). Discover an anomaly in OTLP metrics (latency, token usage, or error rate spike), locate error details in application logs for the time window (webhook timeout, authentication failure, or gateway error), then drill into session audit logs to reconstruct the tool call sequence and confirm the root cause.