Connect to Kibana
If you already use Kibana to visualize Elasticsearch log data and want to migrate to Simple Log Service (SLS), you can use the SLS Elasticsearch-compatible API without modifying your business code.
This document is an original work and the intellectual property of Alibaba Cloud. It describes the capabilities of Alibaba Cloud to interact with third-party products and may reference third-party companies or products.
Prerequisites
A project and a Standard logstore are created, and logs are collected. For more information, see Manage projects, Create a basic Logstore, and Data collection.
Indexes are created before you query logs. For more information, see Create indexes.
An AccessKey pair is created for the RAM user, and the required permissions to query logs in logstores are granted to the RAM user. For more information, see RAM authorization.
Background information
Kibana is an open-source data visualization and exploration tool built on Elasticsearch. Simple Log Service provides an Elasticsearch-compatible API that lets you query and analyze log data in Simple Log Service directly from Kibana.
How it works
Deploy Kibana, a proxy, and Elasticsearch in your client environment.
-
Kibana: Queries, analyzes, and visualizes data.
-
Elasticsearch: Stores Kibana metadata, primarily low-volume configuration data.
Kibana metadata requires frequent updates, but Simple Log Service does not support updates. Therefore, deploy a dedicated Elasticsearch instance to store Kibana metadata.
-
proxy: Routes API requests to either the local Elasticsearch instance (for Kibana metadata) or the Elasticsearch-compatible API of Simple Log Service (for log data).

Step 1: Deploy Elasticsearch, Kibana, and a proxy
-
The server should have at least 8 GB of memory.
-
The Docker version must be 1.18 or later.
Docker Compose
-
On the server, create a new directory named
sls-kibana. In thesls-kibanadirectory, create a subdirectory nameddata. Change the permissions of thedatadirectory to ensure that the Elasticsearch container has read, write, and execute permissions for this directory.mkdir sls-kibana cd sls-kibana mkdir data chmod 777 data -
In the
sls-kibanadirectory, create a.envfile with the following content. Modify the parameters to match your settings.ES_PASSWORD=aStrongPassword # Change the password based on your requirements. SLS_ENDPOINT=cn-huhehaote.log.aliyuncs.com SLS_PROJECT=etl-dev-7494ab**** SLS_ACCESS_KEY_ID=xxx SLS_ACCESS_KEY_SECRET=xxx # ECS_ROLE_NAME="" # If you use an ECS instance RAM role for access, specify the role name here. #SLS_PROJECT_ALIAS=etl-dev # Optional. If the SLS_PROJECT name is too long, you can set an alias. #SLS_LOGSTORE_FILTERS="access*" # Optional. Specifies the Logstores for which index patterns are automatically created. Separate multiple patterns with a comma (,) and enclose the value in double quotation marks ("). Example: "access*,error*". #KIBANA_SPACE=default # Optional. Specifies the space in which to create the index pattern. If the space does not exist, it is automatically created. # You can add more projects. If you add more than six projects, you must also reference them in the docker-compose.yml file. #SLS_ENDPOINT2=cn-huhehaote.log.aliyuncs.com #SLS_PROJECT2=etl-dev2 #SLS_ACCESS_KEY_ID2=xxx #SLS_ACCESS_KEY_SECRET2=xxx #SLS_PROJECT_ALIAS2=etl-dev2 # Optional. If the SLS_PROJECT name is too long, you can set an alias. #SLS_LOGSTORE_FILTERS2="test*log" # Optional. Specifies the Logstores for which index patterns are automatically created. Separate multiple patterns with a comma (,) and enclose the value in double quotation marks ("). Example: "access*,error*". #KIBANA_SPACE2=default # Optional. Specifies the space in which to create the index pattern. If the space does not exist, it is automatically created.Parameter
Description
ES_PASSWORD
The password for both Elasticsearch and Kibana.
ECS_ROLE_NAME
The name of the ECS instance RAM role. For details on the required permissions, see RAM authorization.
SLS_ENDPOINT
The endpoint of the project. For details, see Manage projects.
SLS_PROJECT
The name of the Simple Log Service project. For details, see Manage projects.
SLS_ACCESS_KEY_ID
The AccessKey ID of the RAM user created in the Prerequisites section. This user must have permission to query data in the Logstore. For details, see RAM authorization.
SLS_ACCESS_KEY_SECRET
The AccessKey secret of the RAM user created in the Prerequisites section. This user must have permission to query data in the Logstore. For details, see RAM authorization.
SLS_PROJECT_ALIAS
Optional. If the
SLS_PROJECTname is too long, you can set an alias.SLS_LOGSTORE_FILTERS
Optional. Specifies the Logstores for which index patterns are automatically created. Separate multiple patterns with commas and enclose the entire value in double quotation marks. Example:
"access*,error*".KIBANA_SPACE
Optional. Specifies the space in which to create the index pattern. If the space does not exist, the system creates it automatically.
-
In the
sls-kibanadirectory, create adocker-compose.yamlfile with the following content.services: es: image: sls-registry.cn-hangzhou.cr.aliyuncs.com/kproxy/elasticsearch:7.17.26 #image: sls-registry.cn-hangzhou.cr.aliyuncs.com/kproxy/elasticsearch:7.17.26-arm64 environment: - "discovery.type=single-node" - "ES_JAVA_OPTS=-Xms2G -Xmx2G" - ELASTIC_USERNAME=elastic - ELASTIC_PASSWORD=${ES_PASSWORD} - xpack.security.enabled=true volumes: # Make sure that you have created the ./data directory and granted permissions by running `mkdir data && chmod 777 data`. - ./data:/usr/share/elasticsearch/data kproxy: image: sls-registry.cn-hangzhou.cr.aliyuncs.com/kproxy/kproxy:2.1.8 #image: sls-registry.cn-hangzhou.cr.aliyuncs.com/kproxy/kproxy:2.1.8-arm64 depends_on: - es environment: - ES_ENDPOINT=es:9200 - ECS_ROLE_NAME=${ECS_ROLE_NAME} # The first Simple Log Service project. - SLS_ENDPOINT=${SLS_ENDPOINT} - SLS_PROJECT=${SLS_PROJECT} - SLS_LOGSTORE_FILTERS=${SLS_LOGSTORE_FILTERS} - KIBANA_SPACE=${KIBANA_SPACE} - SLS_PROJECT_ALIAS=${SLS_PROJECT_ALIAS} - SLS_ACCESS_KEY_ID=${SLS_ACCESS_KEY_ID} - SLS_ACCESS_KEY_SECRET=${SLS_ACCESS_KEY_SECRET} # The second Simple Log Service project. - SLS_ENDPOINT2=${SLS_ENDPOINT2} - SLS_PROJECT2=${SLS_PROJECT2} - SLS_LOGSTORE_FILTERS2=${SLS_LOGSTORE_FILTERS2} - KIBANA_SPACE2=${KIBANA_SPACE2} - SLS_PROJECT_ALIAS2=${SLS_PROJECT_ALIAS2} - SLS_ACCESS_KEY_ID2=${SLS_ACCESS_KEY_ID2} - SLS_ACCESS_KEY_SECRET2=${SLS_ACCESS_KEY_SECRET2} - SLS_ENDPOINT3=${SLS_ENDPOINT3} - SLS_PROJECT3=${SLS_PROJECT3} - SLS_LOGSTORE_FILTERS3=${SLS_LOGSTORE_FILTERS3} - KIBANA_SPACE3=${KIBANA_SPACE3} - SLS_PROJECT_ALIAS3=${SLS_PROJECT_ALIAS3} - SLS_ACCESS_KEY_ID3=${SLS_ACCESS_KEY_ID3} - SLS_ACCESS_KEY_SECRET3=${SLS_ACCESS_KEY_SECRET3} - SLS_ENDPOINT4=${SLS_ENDPOINT4} - SLS_PROJECT4=${SLS_PROJECT4} - SLS_LOGSTORE_FILTERS4=${SLS_LOGSTORE_FILTERS4} - KIBANA_SPACE4=${KIBANA_SPACE4} - SLS_PROJECT_ALIAS4=${SLS_PROJECT_ALIAS4} - SLS_ACCESS_KEY_ID4=${SLS_ACCESS_KEY_ID4} - SLS_ACCESS_KEY_SECRET4=${SLS_ACCESS_KEY_SECRET4} - SLS_ENDPOINT5=${SLS_ENDPOINT5} - SLS_PROJECT5=${SLS_PROJECT5} - SLS_LOGSTORE_FILTERS5=${SLS_LOGSTORE_FILTERS5} - KIBANA_SPACE5=${KIBANA_SPACE5} - SLS_PROJECT_ALIAS5=${SLS_PROJECT_ALIAS5} - SLS_ACCESS_KEY_ID5=${SLS_ACCESS_KEY_ID5} - SLS_ACCESS_KEY_SECRET5=${SLS_ACCESS_KEY_SECRET5} - SLS_ENDPOINT6=${SLS_ENDPOINT6} - SLS_PROJECT6=${SLS_PROJECT6} - SLS_LOGSTORE_FILTERS6=${SLS_LOGSTORE_FILTERS6} - KIBANA_SPACE6=${KIBANA_SPACE6} - SLS_PROJECT_ALIAS6=${SLS_PROJECT_ALIAS6} - SLS_ACCESS_KEY_ID6=${SLS_ACCESS_KEY_ID6} - SLS_ACCESS_KEY_SECRET6=${SLS_ACCESS_KEY_SECRET6} # You can add more projects, up to a maximum of 255. kibana: image: sls-registry.cn-hangzhou.cr.aliyuncs.com/kproxy/kibana:7.17.26 #image: sls-registry.cn-hangzhou.cr.aliyuncs.com/kproxy/kibana:7.17.26-arm64 depends_on: - kproxy environment: - ELASTICSEARCH_HOSTS=http://kproxy:9201 - ELASTICSEARCH_USERNAME=elastic - ELASTICSEARCH_PASSWORD=${ES_PASSWORD} - XPACK_MONITORING_UI_CONTAINER_ELASTICSEARCH_ENABLED=true ports: - "5601:5601" # This service component is optional. It automatically creates Kibana index patterns. index-patterner: image: sls-registry.cn-hangzhou.cr.aliyuncs.com/kproxy/kproxy:2.1.8 #image: sls-registry.cn-hangzhou.cr.aliyuncs.com/kproxy/kproxy:2.1.8-arm64 command: /usr/bin/python3 -u /workspace/create_index_pattern.py depends_on: - kibana environment: - KPROXY_ENDPOINT=http://kproxy:9201 - KIBANA_ENDPOINT=http://kibana:5601 - KIBANA_USER=elastic - KIBANA_PASSWORD=${ES_PASSWORD} - ECS_ROLE_NAME=${ECS_ROLE_NAME} - SLS_PROJECT_ALIAS=${SLS_PROJECT_ALIAS} - SLS_ACCESS_KEY_ID=${SLS_ACCESS_KEY_ID} - SLS_ACCESS_KEY_SECRET=${SLS_ACCESS_KEY_SECRET} - SLS_PROJECT_ALIAS2=${SLS_PROJECT_ALIAS2} - SLS_ACCESS_KEY_ID2=${SLS_ACCESS_KEY_ID2} - SLS_ACCESS_KEY_SECRET2=${SLS_ACCESS_KEY_SECRET2} - SLS_PROJECT_ALIAS3=${SLS_PROJECT_ALIAS3} - SLS_ACCESS_KEY_ID3=${SLS_ACCESS_KEY_ID3} - SLS_ACCESS_KEY_SECRET3=${SLS_ACCESS_KEY_SECRET3} - SLS_PROJECT_ALIAS4=${SLS_PROJECT_ALIAS4} - SLS_ACCESS_KEY_ID4=${SLS_ACCESS_KEY_ID4} - SLS_ACCESS_KEY_SECRET4=${SLS_ACCESS_KEY_SECRET4} - SLS_PROJECT_ALIAS5=${SLS_PROJECT_ALIAS5} - SLS_ACCESS_KEY_ID5=${SLS_ACCESS_KEY_ID5} - SLS_ACCESS_KEY_SECRET5=${SLS_ACCESS_KEY_SECRET5} - SLS_PROJECT_ALIAS6=${SLS_PROJECT_ALIAS6} - SLS_ACCESS_KEY_ID6=${SLS_ACCESS_KEY_ID6} - SLS_ACCESS_KEY_SECRET6=${SLS_ACCESS_KEY_SECRET6} # You can add more projects, up to a maximum of 255. -
Run the following command to start the services.
docker compose up -d -
Run the following command to check the service status.
docker compose ps -
After the deployment is complete, enter
http://${IP address of the server where Kibana is deployed}:5601in your browser to access the Kibana login page. Log in with the usernameelasticand the password you configured in the.envfile.ImportantYou must add port 5601 to the security group rules for the server. For more information, see Add a security group rule.
http://${IP address of the server where Kibana is deployed}:5601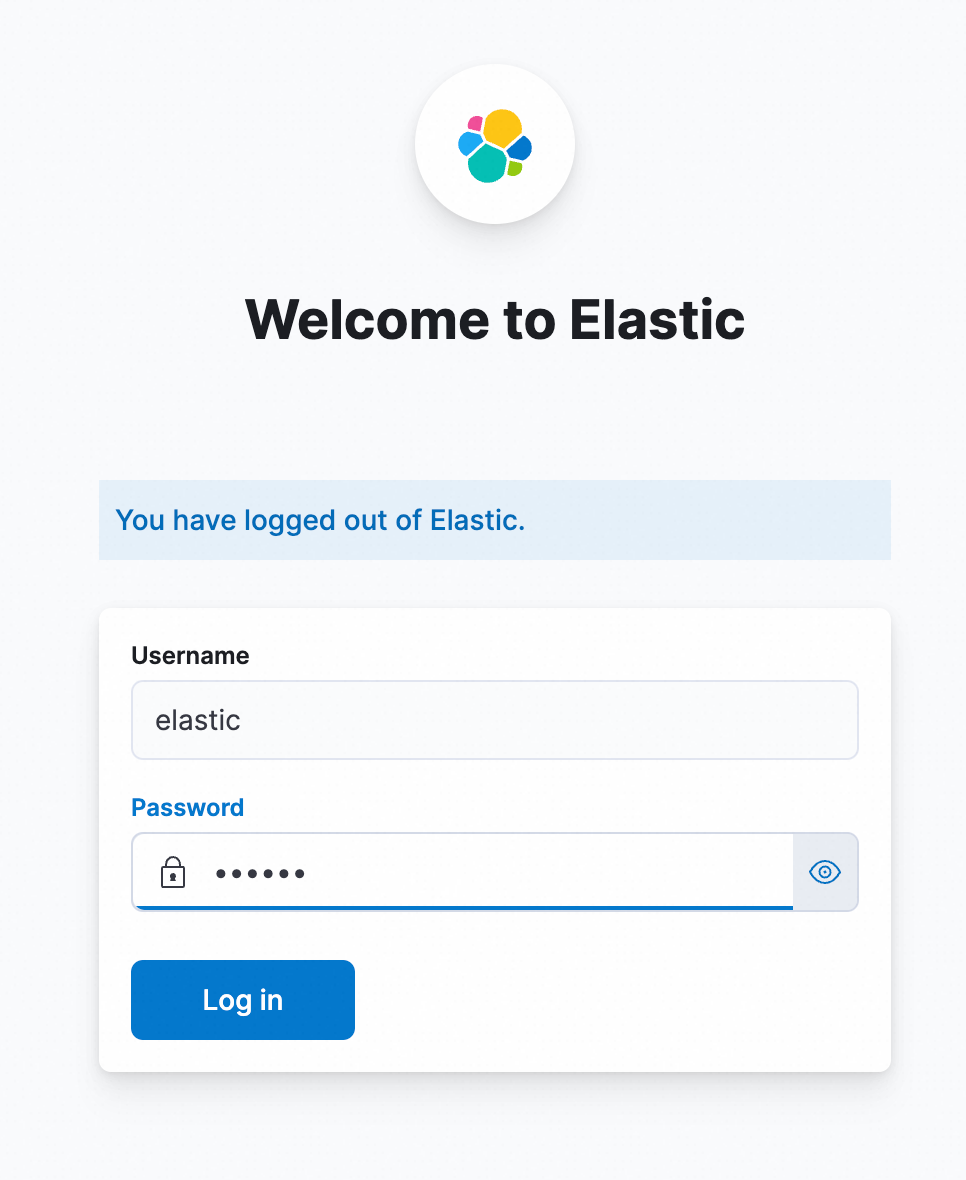
Helm
Prerequisites
Ensure your Container Service for Kubernetes (ACK) cluster has the following components installed. To view installed components, see Manage components.
-
One of the following Ingress controllers:
Procedure
-
Create a namespace.
# Create a namespace. kubectl create namespace sls-kibana -
Create and edit a
values.yamlfile with the following content. Modify the parameters to match your settings.kibana: ingressClass: nginx # Modify the value based on the installed Ingress controller. # To find this value, go to the Components page of your ACK cluster and search for Ingress. # For ALB Ingress Controller, set the value to alb. # For MSE Ingress Controller, set the value to mse. # For Nginx Ingress Controller, set the value to nginx. ingressDomain: # This can be empty. If you want to access Kibana via a domain name, set this value. ingressPath: /kibana/ # Required. The subpath used to access Kibana. # If ingressDomain is not empty, you can set ingressPath to /. #i18nLocale: en # Sets the Kibana language. The default is English (en). To use Chinese, set the value to zh-CN. elasticsearch: password: aStrongPass # Modify the Elasticsearch password based on your requirements. This is also the Kibana access password for the `elastic` user. #diskZoneId: cn-hongkong-c # Specifies the zone where the disk used by Elasticsearch resides. If not set, a zone is automatically selected. repository: region: cn-hangzhou # The region where the image is located. Set to cn-hangzhou for regions in mainland China and ap-southeast-1 for regions outside mainland China. The image is pulled over the public network. #kproxy: # ecsRoleName: # If you use an ECS instance RAM role for access, specify the role name. #arch: amd64 # amd64 or arm64. Default is amd64. sls: - project: k8s-log-c5****** # The Simple Log Service project. endpoint: cn-huhehaote.log.aliyuncs.com # The endpoint of the Simple Log Service project. accessKeyId: The AccessKey ID that has permissions to access Simple Log Service. accessKeySecret: The AccessKey secret that has permissions to access Simple Log Service. # alias: etl-logs # Optional. If the project name is too long in Kibana, you can set an alias. # kibanaSpace: default # Optional. Specifies the space in which to create the index pattern. If the space does not exist, it is automatically created. # logstoreFilters: "*" # Optional. Specifies the Logstores for which index patterns are automatically created. Separate multiple patterns with a comma (,) and enclose the value in double quotation marks ("). Example: "access*,error*". # To add a second project, use the same format as above. #- project: etl-dev2 # The Simple Log Service project. # endpoint: cn-huhehaote.log.aliyuncs.com # The endpoint of the Simple Log Service project. # accessKeyId: The AccessKey ID that has permissions to access Simple Log Service. # accessKeySecret: The AccessKey secret that has permissions to access Simple Log Service. # alias: etl-logs2 # Optional. If the project name is too long in Kibana, you can set an alias. # kibanaSpace: default # Optional. Specifies the space in which to create the index pattern. If the space does not exist, it is automatically created. # logstoreFilters: "*" # Optional. Specifies the Logstores for which index patterns are automatically created. Separate multiple patterns with a comma (,) and enclose the value in double quotation marks ("). Example: "access*,error*".Parameter
Description
kibana.ingressClass
Specify this parameter based on the Ingress controller that you installed. For details, see Manage components.
-
ALB Ingress Controller: set to
alb. -
MSE Ingress Controller: set to
mse. -
Nginx Ingress Controller: set to
nginx.
kibana.ingressDomain
Optional. The domain name for accessing Kibana. This parameter is required if you want to use a domain name.
repository.region
The region where the image is located. Set to
cn-hangzhoufor regions in the Chinese mainland andap-southeast-1for regions outside the Chinese mainland. The image is pulled over the public network.kibana.ingressPath
The subpath for accessing Kibana. If
ingressDomainis not empty, you can setingressPathto/.elasticsearch.password
Modify the Elasticsearch password, which is also the logon password for Kibana. The Elasticsearch account is
elastic.kproxy.ecsRoleName
The name of the ECS instance RAM role used for access. For details on the required permissions, see RAM authorization.
sls.project
The name of the Simple Log Service project. For details, see Manage projects.
sls.endpoint
The endpoint of the project. For details, see Manage projects.
sls.accessKeyId
The AccessKey ID of the RAM user created in the Prerequisites section. This user must have permission to query data in the Logstore. For details, see RAM authorization.
sls.accessKeySecret
The AccessKey secret of the RAM user created in the Prerequisites section. This user must have permission to query data in the Logstore. For details, see RAM authorization.
sls.alias
Optional. If the project name is too long in Kibana, you can set an alias.
sls.kibanaSpace
Optional. Specifies the space in which to create the index pattern. If the space does not exist, the system creates it automatically.
sls.logstoreFilters
Optional. Specifies the Logstores for which to automatically create index patterns. Separate multiple patterns with commas and enclose the entire value in double quotation marks. Example:
"access*,error*". -
-
Run the following command to deploy the services by using Helm.
helm install sls-kibana https://sls-kproxy.oss-cn-hangzhou.aliyuncs.com/sls-kibana-1.5.7.tgz -f values.yaml --namespace sls-kibana -
After the deployment is complete, enter
http://${ingress address}/kibana/in your browser to access the Kibana login page. Log in with the usernameelasticand the password you configured in thevalues.yamlfile.http://${ingress address}/kibana/
Docker
Step 1: Deploy Elasticsearch
To deploy services by using Docker, you must first install and start Docker. For details, see Install and use Docker and Docker Compose.
-
Run the following commands on the server to deploy Elasticsearch.
sudo docker pull sls-registry.cn-hangzhou.cr.aliyuncs.com/kproxy/elasticsearch:7.17.26

sudo mkdir /data  # The directory where Elasticsearch data is stored. Modify the path based on your requirements.
sudo chmod 777 /data # Configure permissions.

sudo docker run -d --name es -p 9200:9200 \
           -e "discovery.type=single-node" \
           -e "ES_JAVA_OPTS=-Xms2G -Xmx2G" \
           -e ELASTIC_USERNAME=elastic \
           -e ELASTIC_PASSWORD=passwd \
           -e xpack.security.enabled=true \
           -v /data:/usr/share/elasticsearch/data \
           sls-registry.cn-hangzhou.cr.aliyuncs.com/kproxy/elasticsearch:7.17.26
Parameter
Description
ELASTIC_USERNAMEThe username to log in to Elasticsearch. This is fixed to
elastic.ELASTIC_PASSWORDThe password to log in to Elasticsearch. The password must be a string.
/dataThe data storage path for Elasticsearch on the host machine.
-
After the deployment is complete, run the following command to verify that Elasticsearch is running. If you are using a public IP address, you must add a security group rule to the server to allow inbound traffic on port 9200. For details, see Add a security group rule.
curl http://${IP address of the server where Elasticsearch is deployed}:9200A response containing
security_exceptionindicates that Elasticsearch is deployed successfully.{"error":{"root_cause":[{"type":"security_exception","reason":"missing authentication credentials for REST request [/]","header":{"WWW-Authenticate":"Basic realm=\"security\" charset=\"UTF-8\""}}],"type":"security_exception","reason":"missing authentication credentials for REST request [/]","header":{"WWW-Authenticate":"Basic realm=\"security\" charset=\"UTF-8\""}},"status":401}
Step 2: Deploy the proxy
When you connect Kibana to Simple Log Service, you can connect to one or more projects. Add the project information when you deploy the proxy.
Single project
sudo docker pull sls-registry.cn-hangzhou.cr.aliyuncs.com/kproxy/kproxy:2.1.8

sudo docker run  -d --name proxy \
            -e ES_ENDPOINT=${IP address of the server where Elasticsearch is deployed}:9200 \
            -e SLS_ENDPOINT=https://prjA.cn-guangzhou.log.aliyuncs.com/es/ \
            -e SLS_PROJECT=prjA \
            -e SLS_ACCESS_KEY_ID=${aliyunAccessId} \
            -e SLS_ACCESS_KEY_SECRET=${aliyunAccessKey} \
            -p 9201:9201 \
            -ti sls-registry.cn-hangzhou.cr.aliyuncs.com/kproxy/kproxy:2.1.8
Multiple projects
-
You can add up to 32 projects.
-
The base variable names (
SLS_PROJECT,SLS_ENDPOINT, etc.) apply to the first project. For subsequent projects, append a numeric suffix to the variable names, such asSLS_PROJECT2andSLS_ENDPOINT2. -
If a subsequent project shares the same endpoint or AccessKey pair as the first project, you can omit those variables for that project.
sudo docker pull sls-registry.cn-hangzhou.cr.aliyuncs.com/kproxy/kproxy:2.1.8

sudo docker run  -d --name proxy \
            -e ES_ENDPOINT=${IP address of the server where Elasticsearch is deployed}:9200 \
            -e SLS_ENDPOINT=https://prjA.cn-guangzhou.log.aliyuncs.com/es/ \
            -e SLS_ENDPOINT2=https://prjB.cn-guangzhou.log.aliyuncs.com/es/ \
            -e SLS_PROJECT=prjA \
            -e SLS_PROJECT2=prjB \
            -e SLS_ACCESS_KEY_ID=${aliyunAccessId} \
            -e SLS_ACCESS_KEY_SECRET=${aliyunAccessKey} \
            -e SLS_ACCESS_KEY_ID2=${aliyunAccessId} \ # If the value is the same as SLS_ACCESS_KEY_ID, you do not need to configure this variable.
            -e SLS_ACCESS_KEY_SECRET2=${aliyunAccessKey} \ # If the value is the same as SLS_ACCESS_KEY_SECRET, you do not need to configure this variable.
            -p 9201:9201 \
-ti sls-registry.cn-hangzhou.cr.aliyuncs.com/kproxy/kproxy:2.1.8-
Example 1
Connect to two projects (
prjAandprjB) that use the same AccessKey pair.sudo docker pull sls-registry.cn-hangzhou.cr.aliyuncs.com/kproxy/kproxy:2.1.8 sudo docker run -d --name proxy \ -e ES_ENDPOINT=${IP address of the server where Elasticsearch is deployed}:9200 \ -e SLS_ENDPOINT=https://prjA.cn-guangzhou.log.aliyuncs.com/es/ \ -e SLS_ENDPOINT2=https://prjB.cn-guangzhou.log.aliyuncs.com/es/ \ -e SLS_PROJECT=prjA \ -e SLS_PROJECT2=prjB \ -e SLS_ACCESS_KEY_ID=${aliyunAccessId} \ -e SLS_ACCESS_KEY_SECRET=${aliyunAccessKey} \ -p 9201:9201 \ -ti sls-registry.cn-hangzhou.cr.aliyuncs.com/kproxy/kproxy:2.1.8 -
Example 2
Connect to three projects (
prjA,prjB, andprjC), whereprjAandprjCuse the same AccessKey pair.sudo docker run -d --name proxy \ -e ES_ENDPOINT=${IP address of the server where Elasticsearch is deployed}:9200 \ -e SLS_ENDPOINT=https://prjA.cn-guangzhou.log.aliyuncs.com/es/ \ -e SLS_ENDPOINT2=https://prjB.cn-guangzhou.log.aliyuncs.com/es/ \ -e SLS_ENDPOINT3=https://prjC.cn-guangzhou.log.aliyuncs.com/es/ \ -e SLS_PROJECT=prjA \ -e SLS_PROJECT2=prjB \ -e SLS_PROJECT3=prjC \ -e SLS_ACCESS_KEY_ID=${aliyunAccessId} \ -e SLS_ACCESS_KEY_SECRET=${aliyunAccessKey} \ -e SLS_ACCESS_KEY_ID2=${aliyunAccessId} \ -e SLS_ACCESS_KEY_SECRET2=${aliyunAccessKey} \ -p 9201:9201 \ -ti sls-registry.cn-hangzhou.cr.aliyuncs.com/kproxy/kproxy:2.1.8
The following table describes the parameters.
|
Parameter |
Description |
|
|
The endpoint of Elasticsearch. Format: |
|
|
The data access endpoint. Format: Important
You must use the HTTPS protocol. |
|
|
The name of the Simple Log Service project. For details, see Manage projects. |
|
|
The AccessKey ID for your Alibaba Cloud account or a RAM user. We recommend using an AccessKey pair from a RAM user. The RAM user must have the permissions to query data from the Logstore. You can use the permission assistant to configure permissions. For details, see Configure the permission assistant. For information about obtaining an AccessKey pair, see AccessKey pair. |
|
|
The AccessKey secret for your Alibaba Cloud account or a RAM user. We recommend using an AccessKey pair from a RAM user. The RAM user must have the permissions to query data from the Logstore. You can use the permission assistant to configure permissions. For details, see Configure the permission assistant. For information about obtaining an AccessKey pair, see AccessKey pair. |
After the deployment is complete, run the following command to verify that the proxy is running. If you use a public IP address, you must add a security group rule to the server to allow inbound traffic on port 9201. For details, see Add a security group rule.
curl http://${IP address of the server where the proxy is deployed}:9201A response containing security_exception indicates that the proxy is deployed successfully.
{"error":{"root_cause":[{"type":"security_exception","reason":"missing authentication credentials for REST request [/]","header":{"WWW-Authenticate":"Basic realm=\"security\" charset=\"UTF-8\""}}],"type":"security_exception","reason":"missing authentication credentials for REST request [/]","header":{"WWW-Authenticate":"Basic realm=\"security\" charset=\"UTF-8\""}},"status":401}Step 3: Deploy Kibana
This example deploys Kibana version 7.17.26.
sudo docker pull  sls-registry.cn-hangzhou.cr.aliyuncs.com/kproxy/kibana:7.17.26

sudo docker run -d --name kibana \
            -e ELASTICSEARCH_HOSTS=http://${IP address of the server where the proxy is deployed}:9201 \
            -e ELASTICSEARCH_USERNAME=elastic \
            -e ELASTICSEARCH_PASSWORD=passwd \
            -e XPACK_MONITORING_UI_CONTAINER_ELASTICSEARCH_ENABLED=true \
            -p 5601:5601 \
sls-registry.cn-hangzhou.cr.aliyuncs.com/kproxy/kibana:7.17.26|
Parameter |
Description |
|
|
The endpoint of the proxy. Format: |
|
|
The username to log in to Kibana. This must be the same as the ELASTIC_USERNAME you configured when you deployed Elasticsearch. |
|
|
The password to log in to Kibana. This must be the same as the ELASTIC_PASSWORD you configured when you deployed Elasticsearch. |
After the deployment is complete, enter http://${IP address of the server where Kibana is deployed}:5601 in your browser to access the Kibana login page. Log in with the username and password that you configured for Elasticsearch in Step 1.
You must add port 5601 to the server's security group rules. For more information, see Add a security group rule.
http://${IP address of the server where Kibana is deployed}:5601
Step 2: Access Kibana
Query and analyze data
-
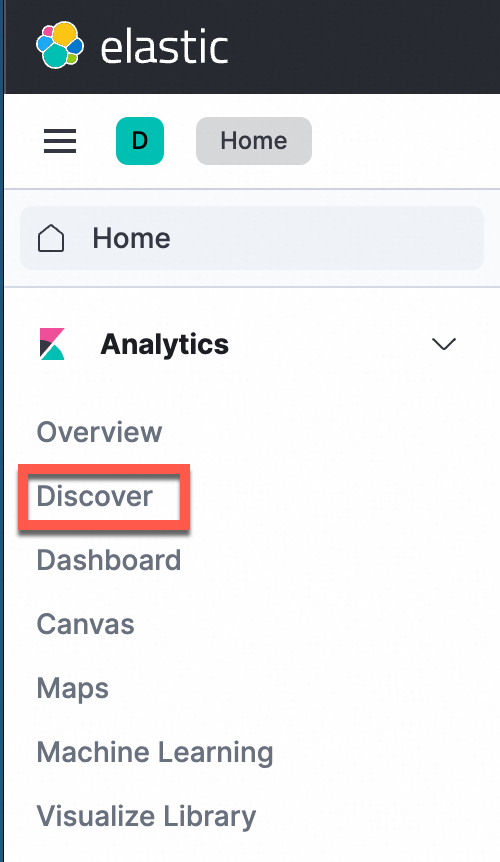
In the left-side navigation pane, choose Analytics > Discover.
ImportantThe Elasticsearch-compatible API for Simple Log Service supports only the Discover and Dashboard modules in Kibana.
-
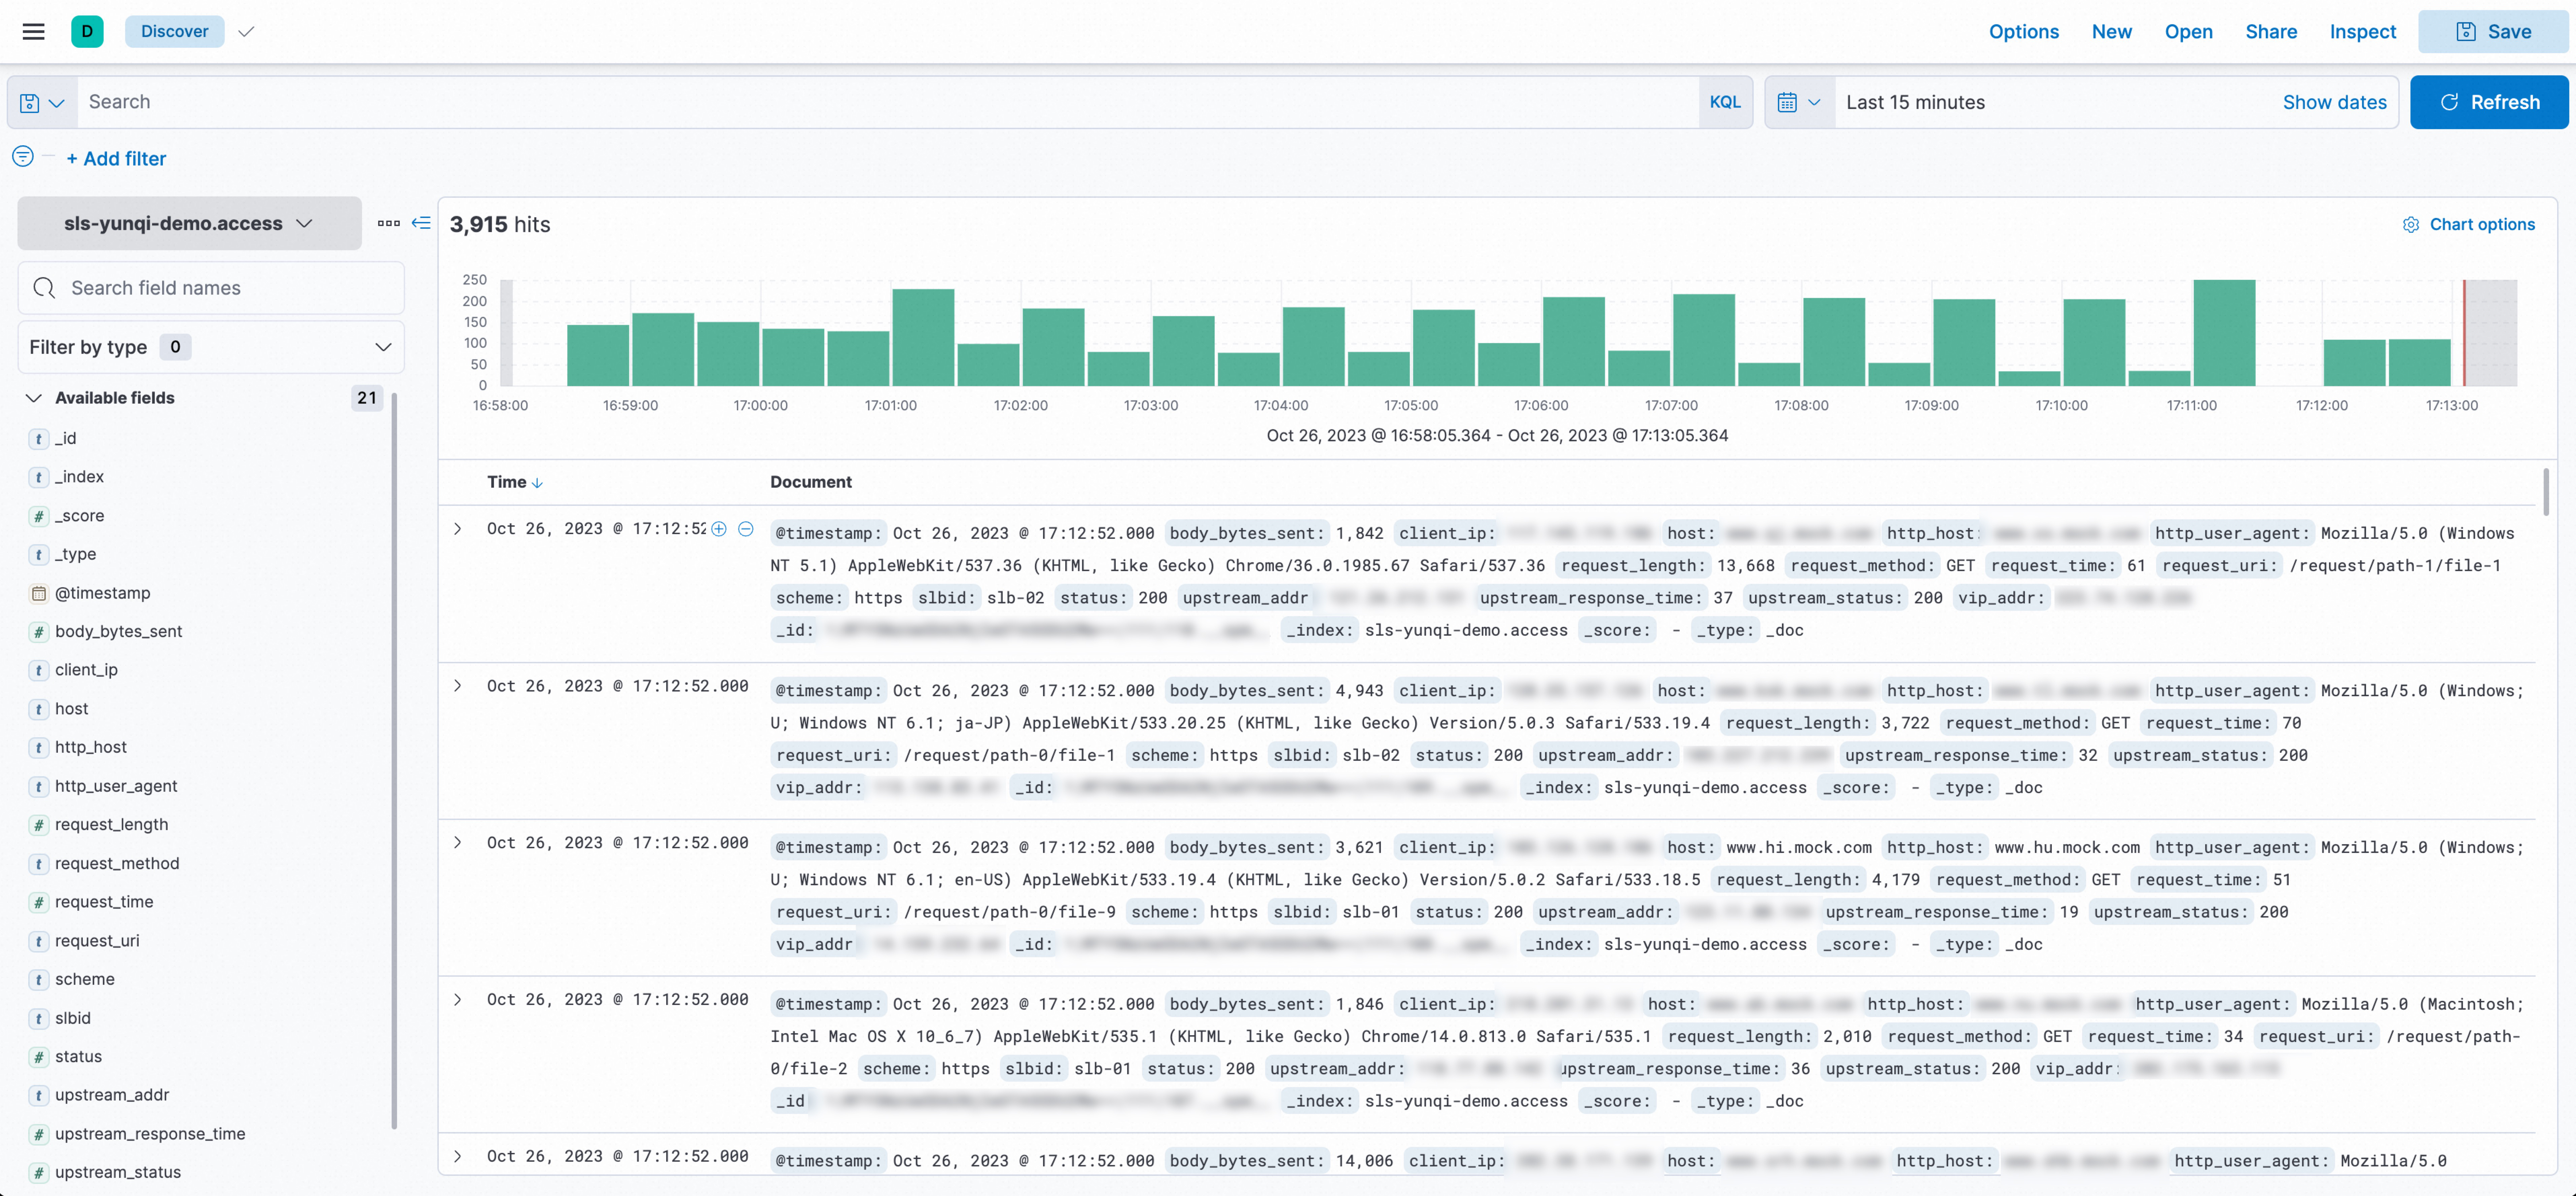
In the upper-left corner of the page, select the target index. In the upper-right corner, select a time range.

Create index pattern (optional)
By default, an index pattern is created automatically for Docker Compose or Helm deployments. If you perform a manual deployment with Docker, you must create an index pattern.
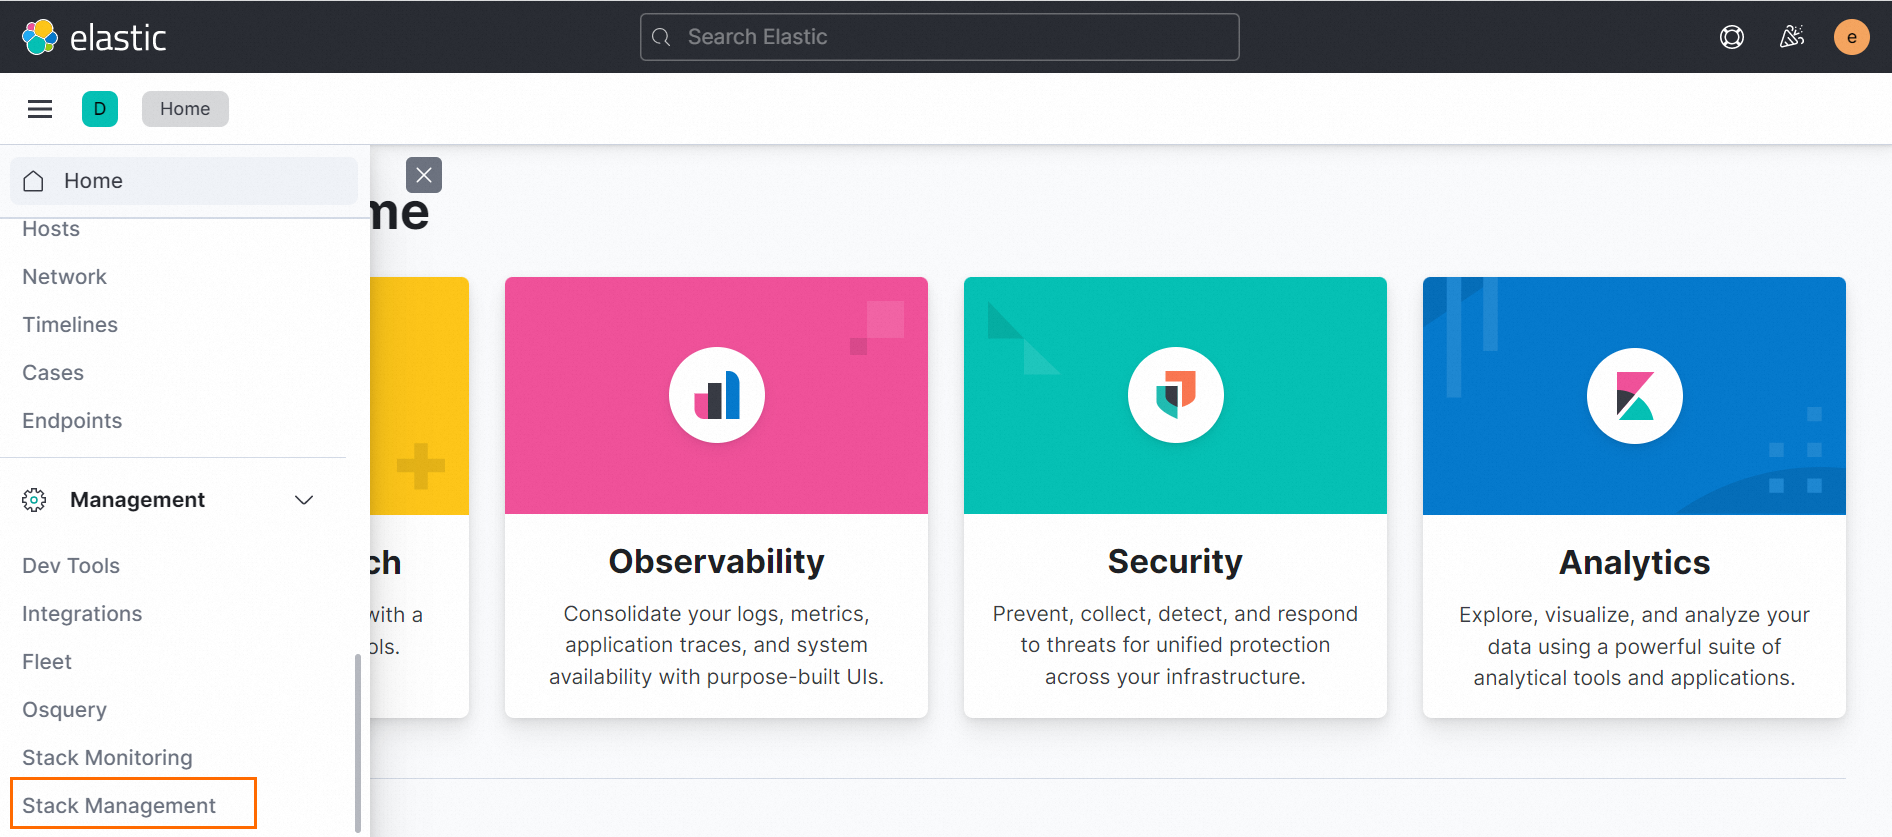
-
In the left-side navigation pane, choose Management > Stack Management.
-
In the left-side navigation pane, choose Kibana > Index Patterns.
-
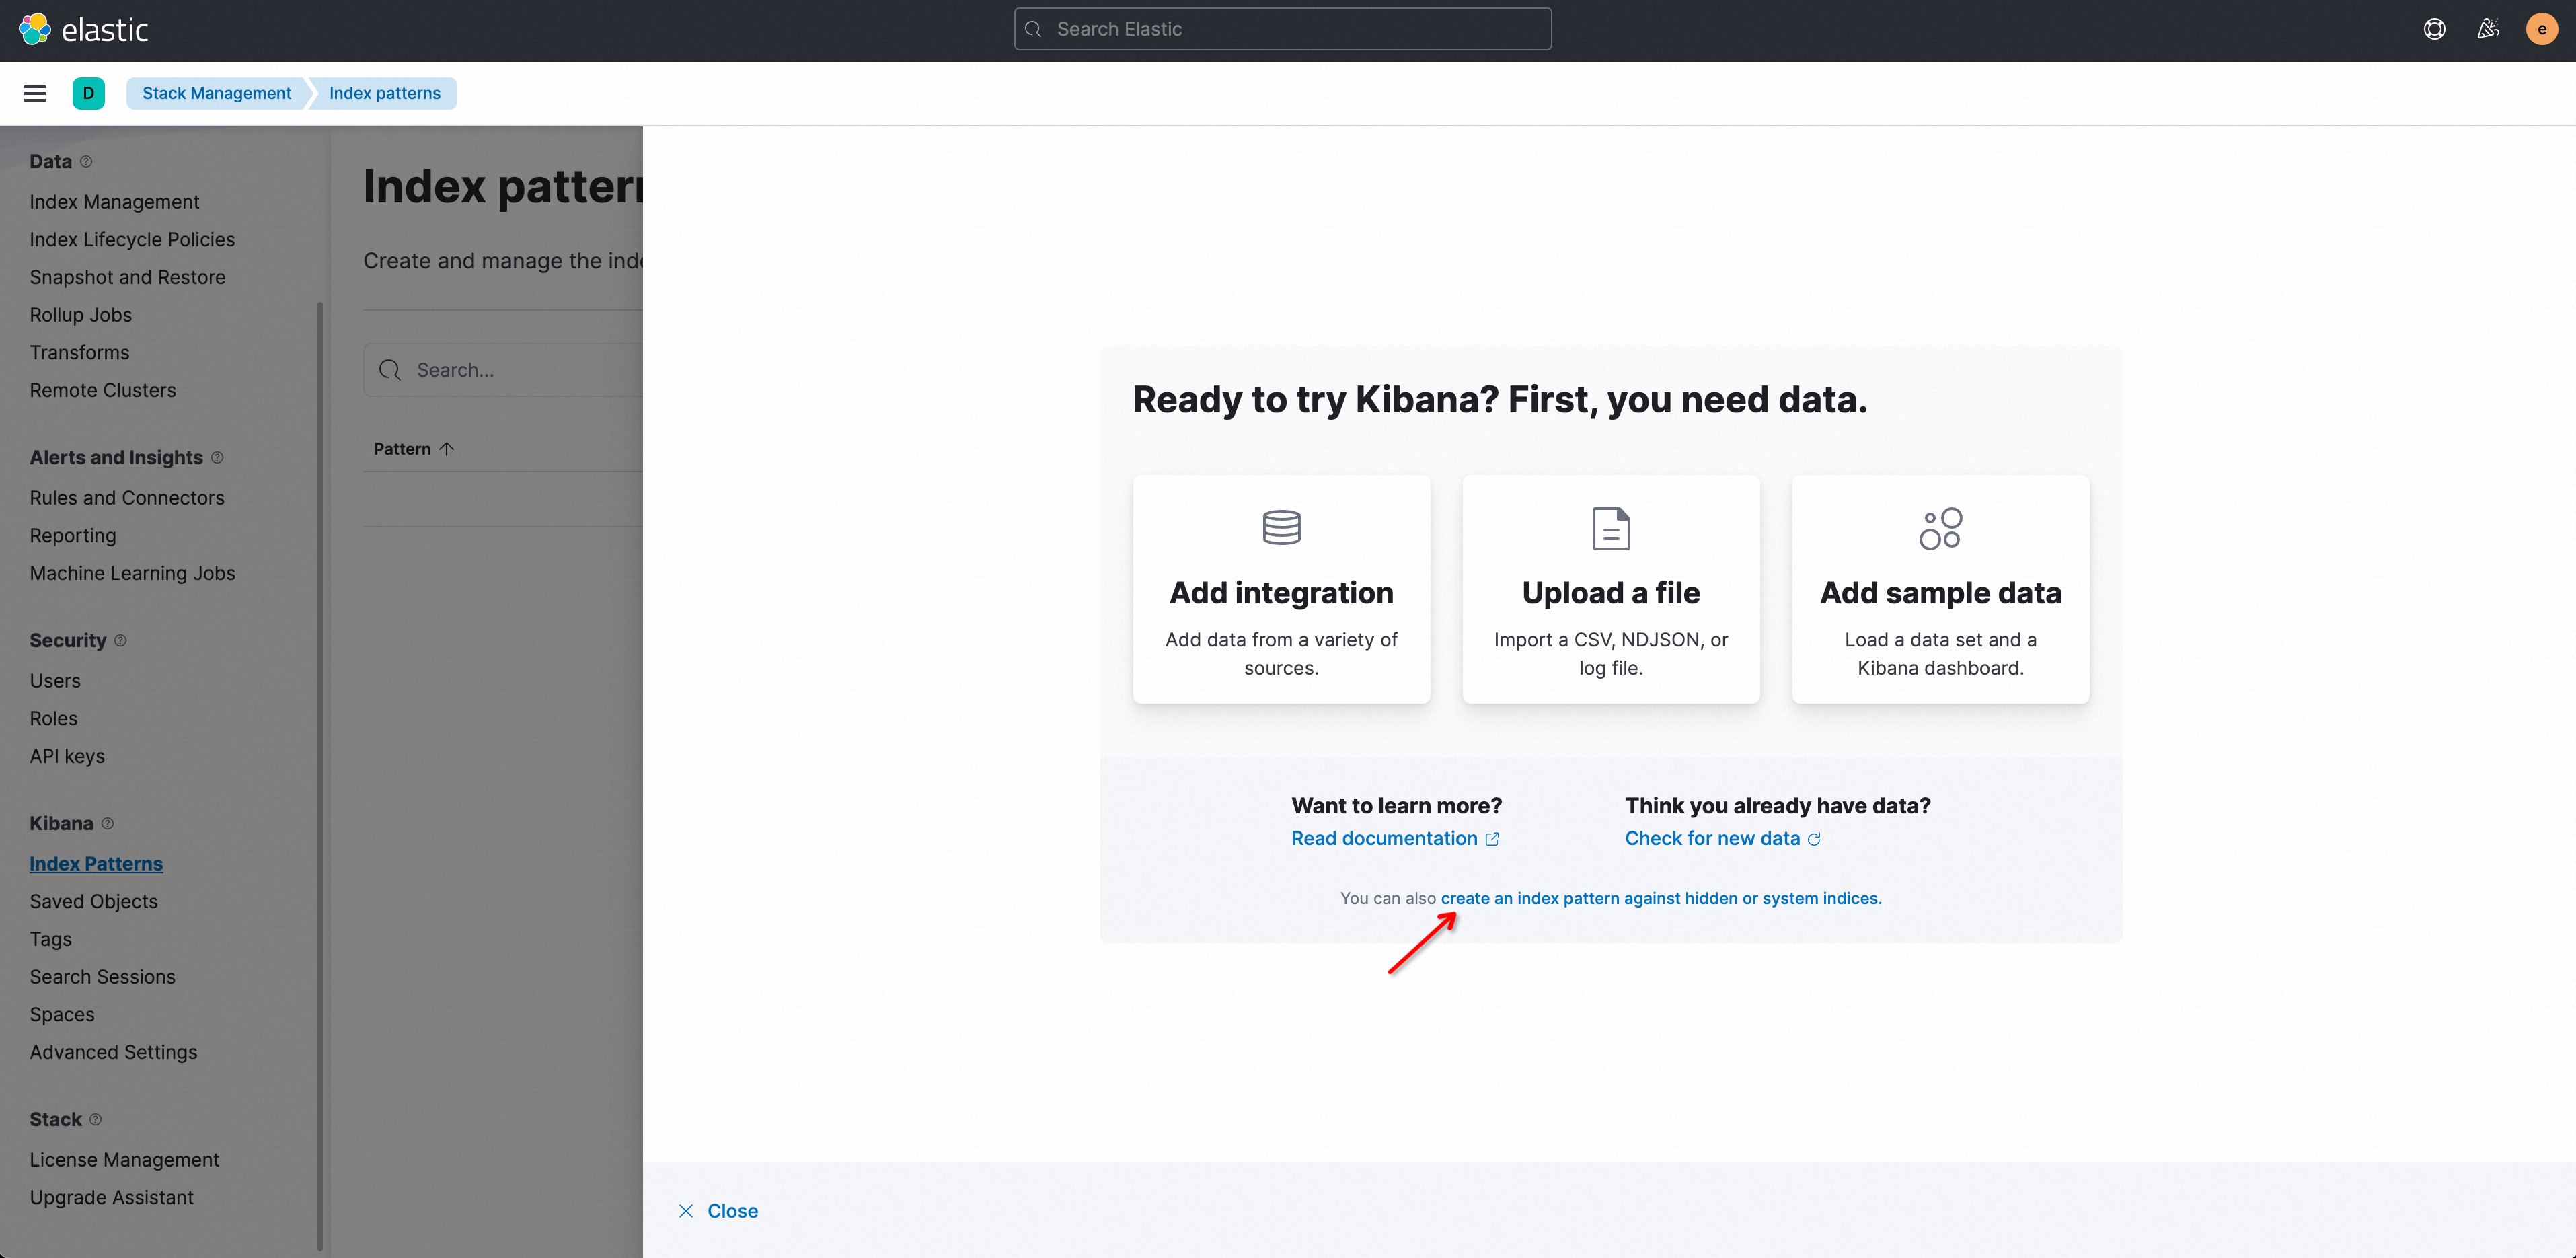
On your first use, click create an index pattern against hidden or system indices in the prompt.
NoteIt is normal if you do not see any data in the index pattern list because you must manually create index patterns in Kibana for the Logstores in Simple Log Service.
-
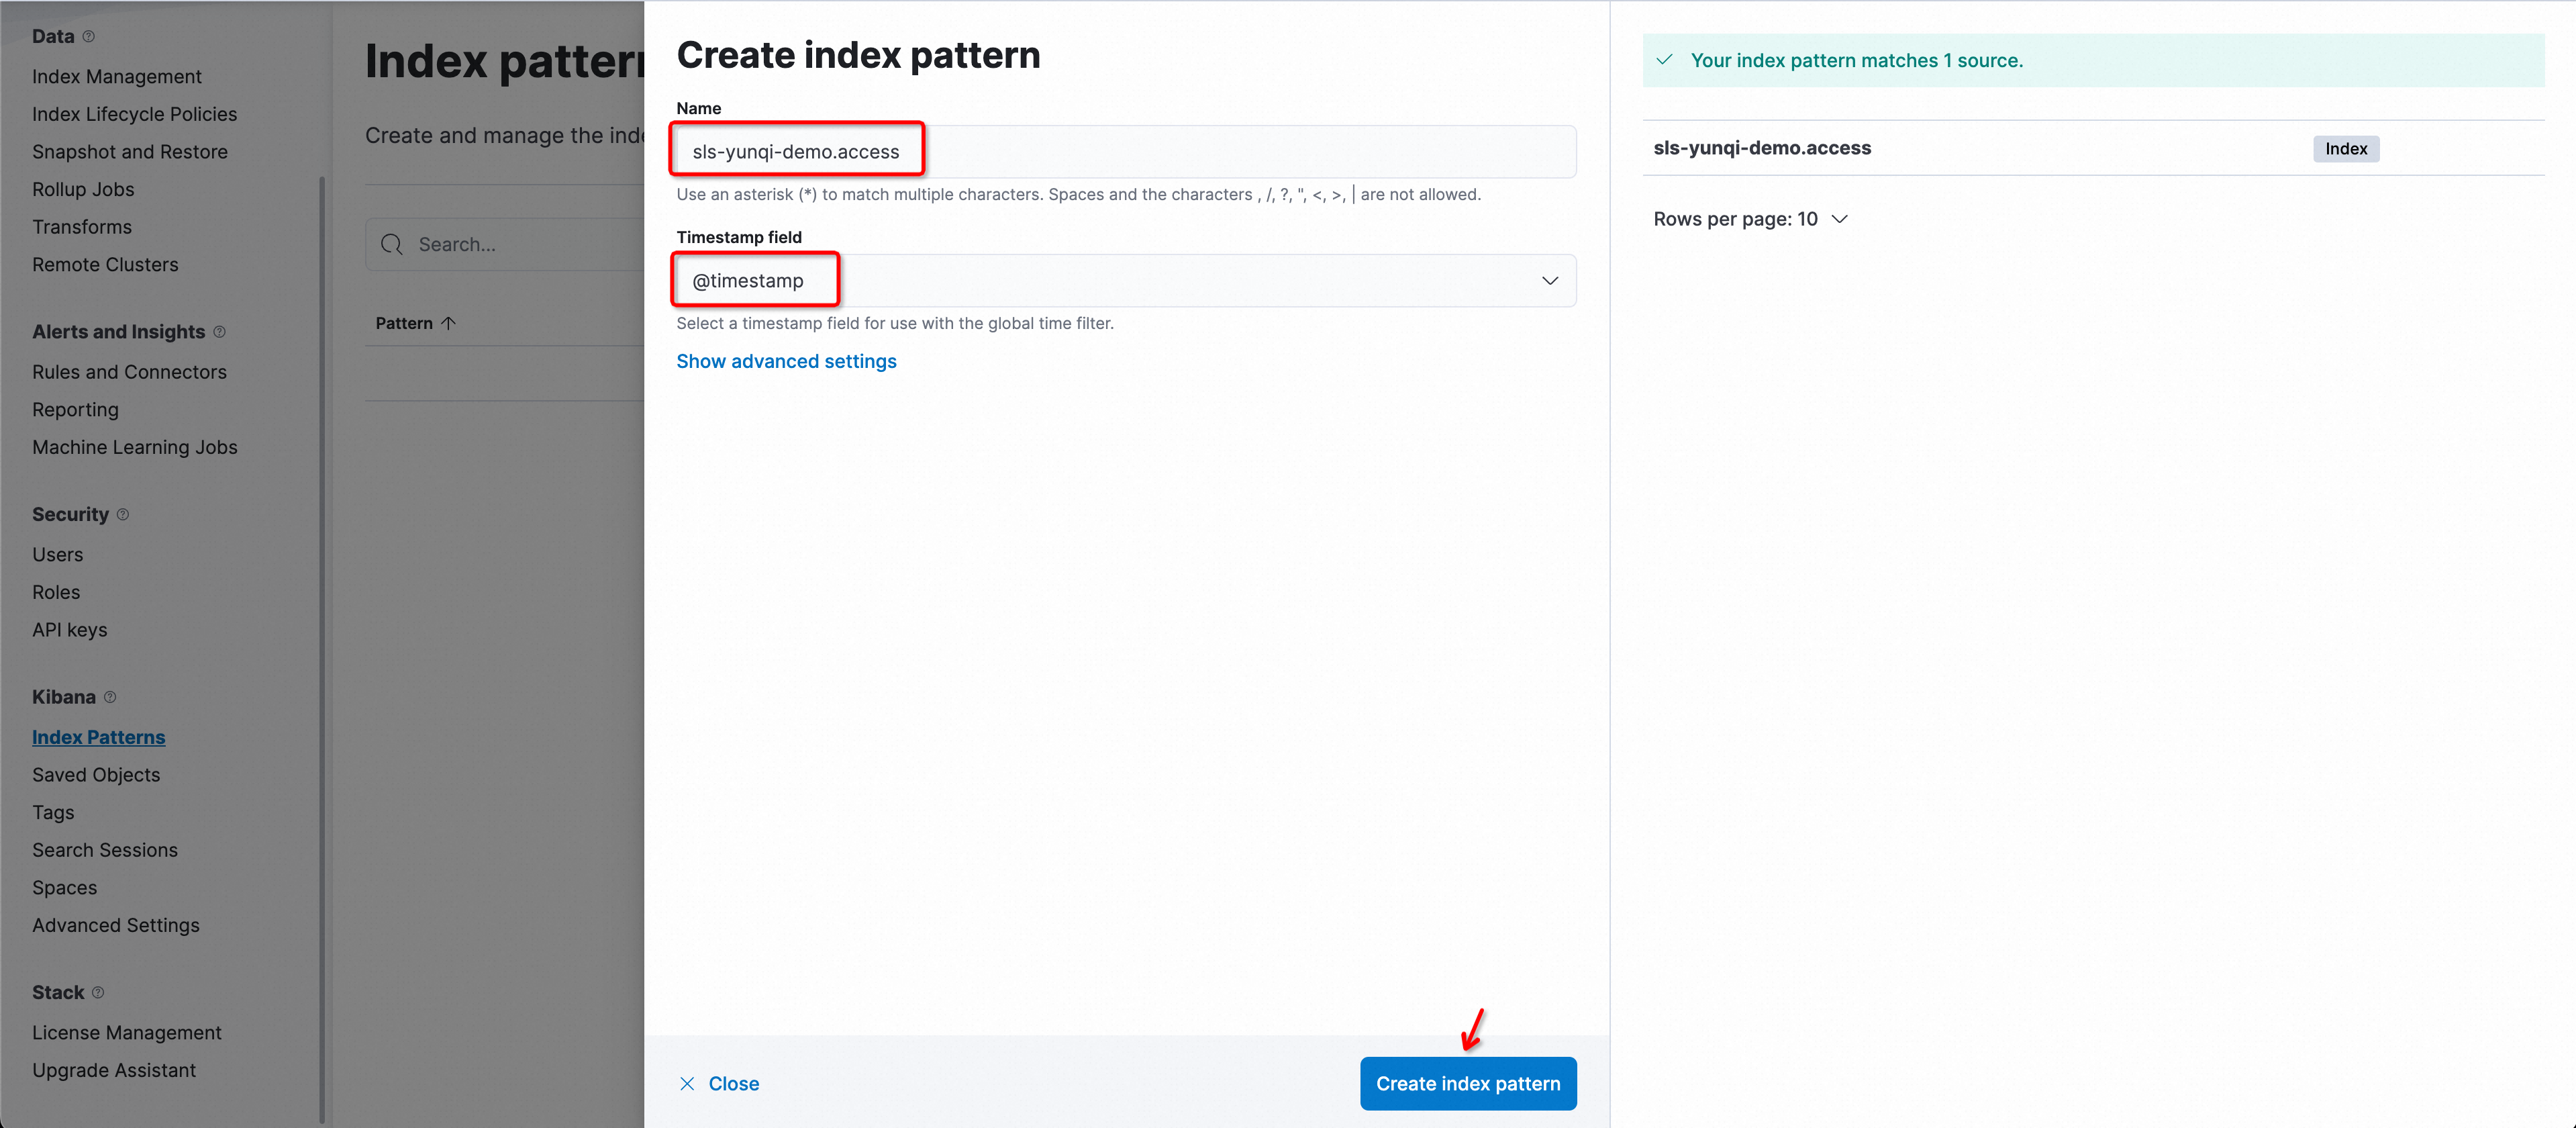
In the Create index pattern window, configure the parameters.
Parameter
Description
NameThe index pattern name. The format is
${Simple Log Service project name}.${Logstore name}.ImportantYou must enter the complete index pattern name because only exact matches are supported.
For example, if the project name is etl-guangzhou and the Logstore name is es_test22, the index pattern name is
etl-guangzhou.es_test22.Timestamp fieldSelect
@timestamp. -
Click Create index pattern.
Query string examples
-
For optimal performance, specify a field in your query.
content: "Hello World"Queries without a specified field are less efficient because the system may need to concatenate multiple SQL fields to find a match.
"Hello World" -
Using an exact match is more efficient than using a
*wildcard query.content: "Hello World"Avoid using the
*wildcard in queries because it triggers a full scan, which increases response time for large data volumes.content: "Hello*"
FAQ
Cannot access Kibana with Docker Compose
-
In the
sls-kibanadirectory, run thedocker compose pscommand. Check theSTATUScolumn to ensure all containers have aSTATUSofUP. -
If all three containers have a
STATUSofUP, check the error logs for each container.docker logs sls-kibana_es_1 # View the startup logs of Elasticsearch. docker logs sls-kibana_kproxy_1 # View the startup logs of KProxy. docker logs sls-kibana_kibana_1 # View the startup logs of Kibana.

Cannot access Kibana with Helm
-
Log on to the ACK console and choose Clusters from the left-side navigation pane.
-
On the Clusters page, click the name of the target cluster, and then in the left-side navigation pane, choose .
-
Select
sls-kibanaas the namespace at the top of the page. Verify that Elasticsearch, Kibana, and KProxy have started correctly. For more information about how to view and edit the status of a stateful workload or redeploy applications in batches, see Create a StatefulSet.
Uninstall Helm
helm uninstall sls-kibana --namespace sls-kibanaDisplay high-precision timestamps in Kibana
-
Ensure that high-precision timestamps are used for data collection or reporting in Simple Log Service. Configure a nanosecond-precision timestamp to enable nanosecond-level precision.
-
After ensuring that high-precision time is collected, add an index for the
__time_ns_part__nanosecond field, which is of typelong. Because some Kibana queries are converted to SQL, you must also include high-precision time values in the SQL results.
Upgrade a Helm chart
To upgrade a Helm chart, replace the install command with upgrade and reuse the values.yaml file from the installation.
helm upgrade sls-kibana https://sls-kproxy.oss-cn-hangzhou.aliyuncs.com/sls-kibana-1.5.5.tgz -f values.yaml --namespace sls-kibanaDelete index patterns in bulk
-
List the index patterns that you want to delete.
Prepare the
kibana_config.jsonfile:{ "url" : "http://xxx:5601", "user" : "elastic", "password" : "", "space" : "default" }Use ptn_list.py to list the existing index patterns and save the output to the
/tmp/ptnlist.txtfile.➜ python ptn_list.py kibana_config.json > /tmp/ptnlist.txtEdit the
/tmp/ptnlist.txtfile to keep only the index patterns you want to delete.54c0d6c0-****-****-****-15adf26175c7 etl-dev.batch_test52 54266b80-****-****-****-15adf26175c7 etl-dev.batch_test51 52f369c0-****-****-****-15adf26175c7 etl-dev.batch_test49 538ceaa0-****-****-****-15adf26175c7 etl-dev.batch_test50 -
Use ptn_delete.py to delete the index patterns.
NoteDeleting an index pattern renders its associated dashboards and other objects unusable. Ensure that the index patterns you are deleting are no longer needed.
# Check the /tmp/ptnlist.txt file to confirm the index patterns to be deleted.
➜  cat /tmp/ptnlist.txt

# Run the delete command.
➜  python ptn_delete.py kibana_config.json /tmp/ptnlist.txt