This topic describes how to use the real-time log feature to analyze user access logs.
Overview
The real-time log delivery feature is a log data processing service that is jointly developed by Alibaba Cloud CDN and SLS. Featuring low-latency (typically within 3 minutes) shipping, you can use this feature to push access logs from points of presence (POPs) all over the world to SLS. You can then use SLS to store and analyze user access data. Requests that flow through Alibaba Cloud CDN are logged, and a trove of data is provided for analysis. You can analyze these logs to gain insights into user composition and access speed, as well as to locate and troubleshoot content delivery issues.
Prerequisites
Alibaba Cloud CDN is activated and a domain name is added for acceleration. For more information, see Activate Alibaba Cloud CDN.
SLS is activated. For more information, see Collect and analyze ECS text logs using LoongCollector.
Real-time log delivery is configured for the accelerated domain name for which you want to analyze user access data. For more information, see Real-time log delivery.
Differences between real-time log shipping and the offline log feature
Log latency
The real-time log delivery feature collects log data in real time, and logs are generated within 3 minutes after an event occurs. Offline log data is generated within 24 hours.
Log analysis
The real-time log delivery feature integrates the log storage and log analysis capabilities of SLS. The feature provides four preset analysis report templates: basic data, error analysis, frequently requested resources, and user analysis. The feature also supports custom log analysis policies. In comparison, the offline log feature only lets you ship logs to Object Storage Service (OSS), and does not integrate log analysis capabilities.
Benefits
Low latency
Log data is generated within 3 minutes after an event occurs. This lets you analyze access logs, identify issues, and resolve them right away.
End-to-end
With most traditional offline log analysis solutions, before analyzing data, you first need to download logs, upload them to a data warehouse, then clean the data, and define the data model. This increases labor costs and the time needed for analysis. The real-time log delivery feature integrates log storage and log analysis capabilities of SLS to streamline offline log analysis.
Limits and notes
Other data cannot be written to the exclusive logstore.
The exclusive logstore is used to store SMS logs. Other data cannot be written to this logstore. The query, statistics, alerting, and streaming consumption features of this Logstore are not limited.
Pay-as-you-go If the SMS log collection function is not enabled, there is no charge.
The SMS log feature is billed according to the charge item of SLS. If the log collection feature is not enabled, no charge appears. SLS supports pay-as-you-go billing method, and provides free quota.
Scenarios
Real-time logs can help you analyze issues with your accelerated domain names and understand user access patterns. The real-time log feature of Alibaba Cloud CDN provides preset log analysis reports and supports custom log analysis policies to meet the needs of different scenarios.
Preset log analysis reports
Log analysis scenario | Report description |
CDN basic data | This data helps you quickly understand the overall service quality of CDN and the access efficiency of end users, such as hit rate, access latency, and download speed. It also lets you promptly handle service quality issues when they occur. |
CDN access errors | This data helps you quickly locate the source of CDN service issues when application access is abnormal, such as partial URI issues, origin server failures, unavailable nodes, network issues in some provinces, or network issues with some carriers. |
CDN hot spot resources | This data helps you better understand hot spot resources and analyze popular domain names, popular URIs, popular provinces, and popular carriers. You can also use the hot spot data to determine whether your operational activities are effective and whether the traffic increase during hot spot periods meets expectations. This helps you adjust your operational strategies in a timely manner. |
CDN user composition | This data helps you better understand the user composition of your website, including the client types, provinces, and carriers of users. It can also compile statistics on top users by access volume and top users by download volume. |
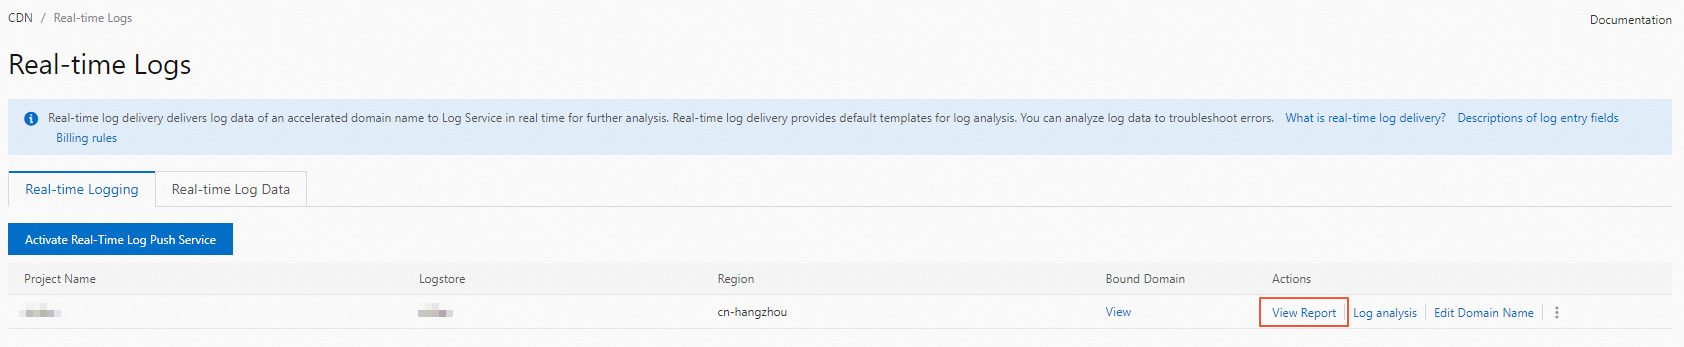
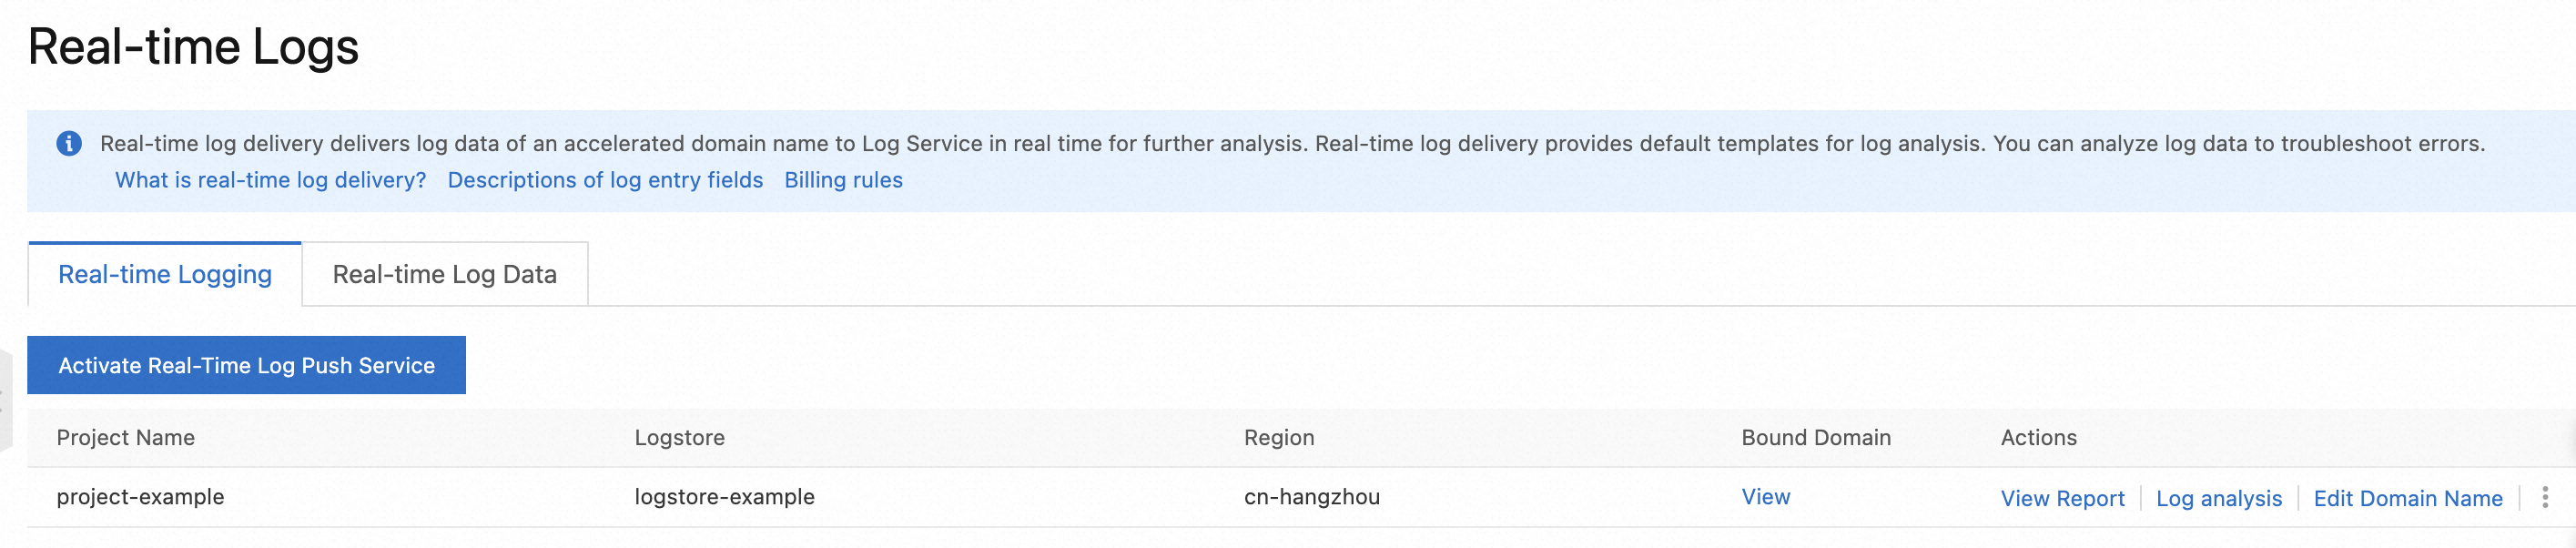
On the real-time log feature page, find the project for which you want to analyze logs, and then click View Reports to go to the log analysis report template page.
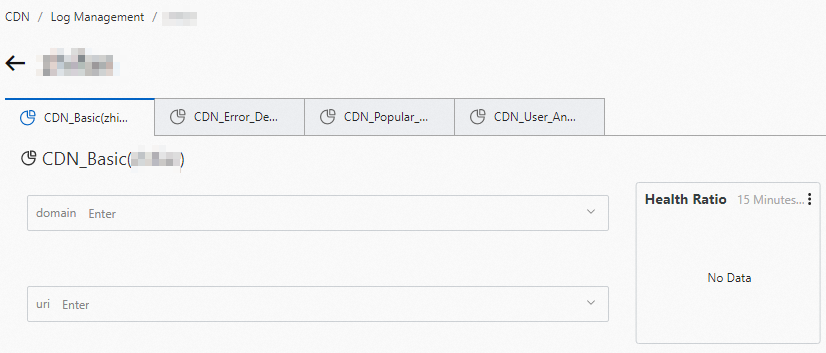
On the data query template page, data for all domain names is queried by default. You can also query data for a specified domain name or URI.
For more information, see the following topics:
Custom log analysis
If the preset log analysis reports do not meet your needs, you can use the powerful log analysis capabilities of SLS to perform custom log analysis.
For example, you can view the ranking of domain names for which the response status code is 499 or 502.
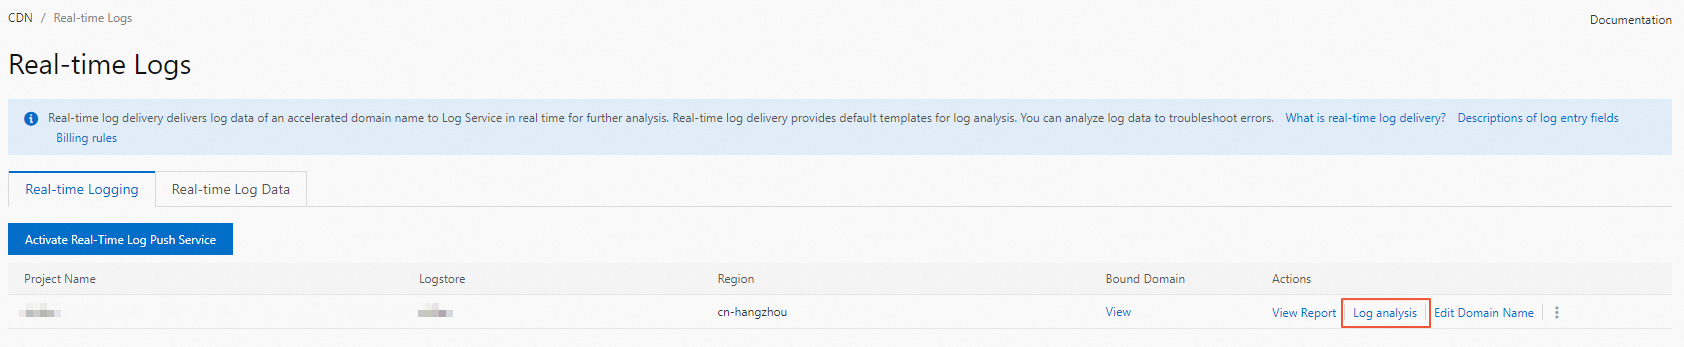
On the real-time log feature page, find the project for which you want to analyze logs, and then click Log Analysis to go to the custom log analysis page.
On the custom analysis interface, you can enter a search statement in the search box to query log data for complex filter conditions, or click a log field in the Raw Logs column on the left to filter logs for simple filter conditions.
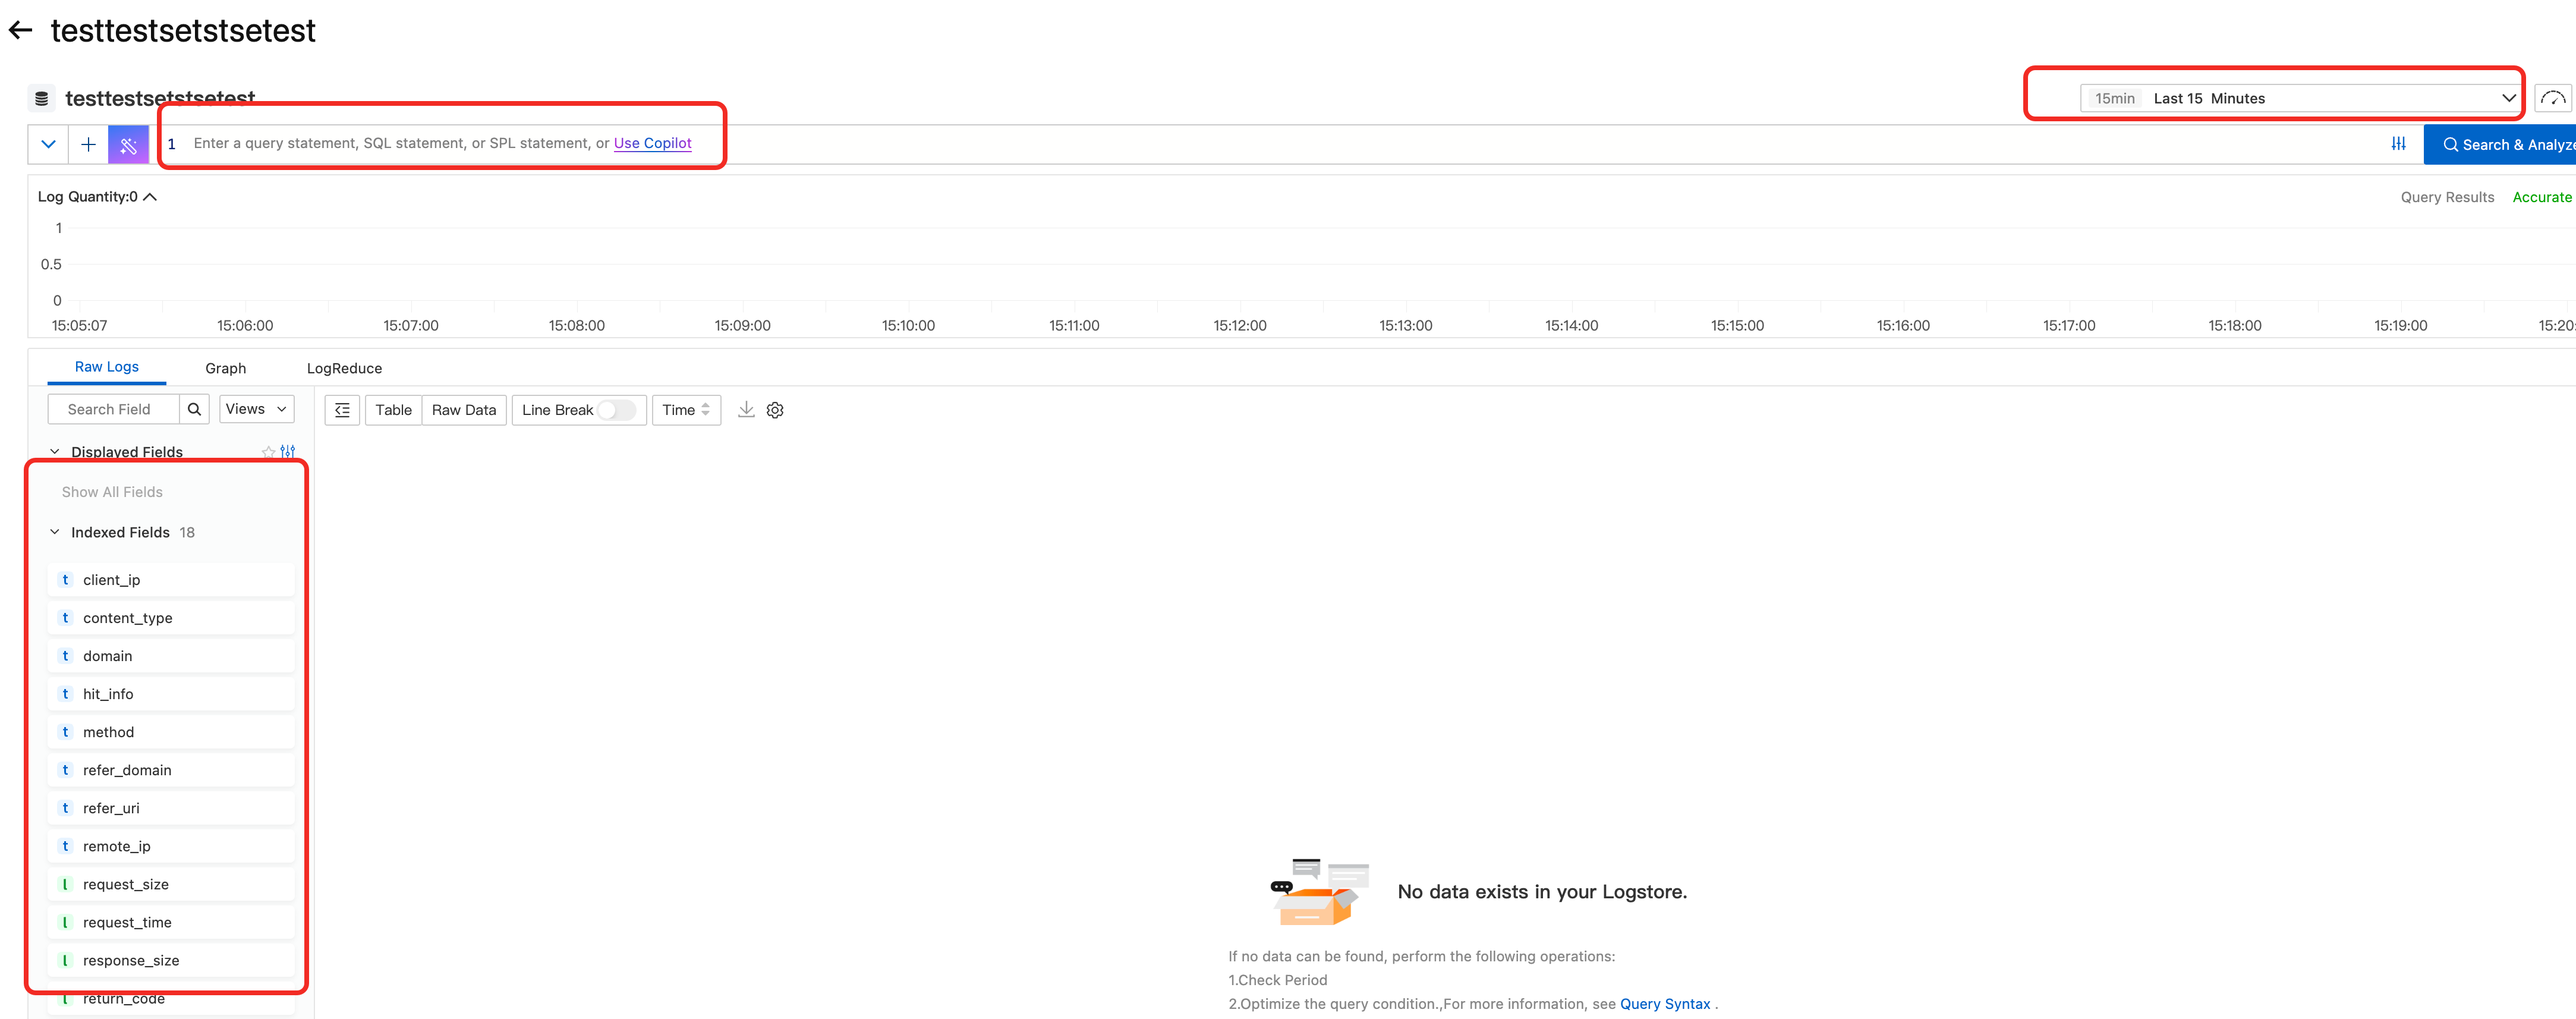
For more information, see Custom reports.
Create a real-time log delivery project
You can create a Log Service project to store real-time logs of an accelerated domain name, such as aliyun.example.com. For more information, see Real-time log delivery.
The following figure shows a created project, where the project name is project-example, the Logstore name is project-example, and the log storage region is China (Hangzhou) whose ID is cn-hangzhou.
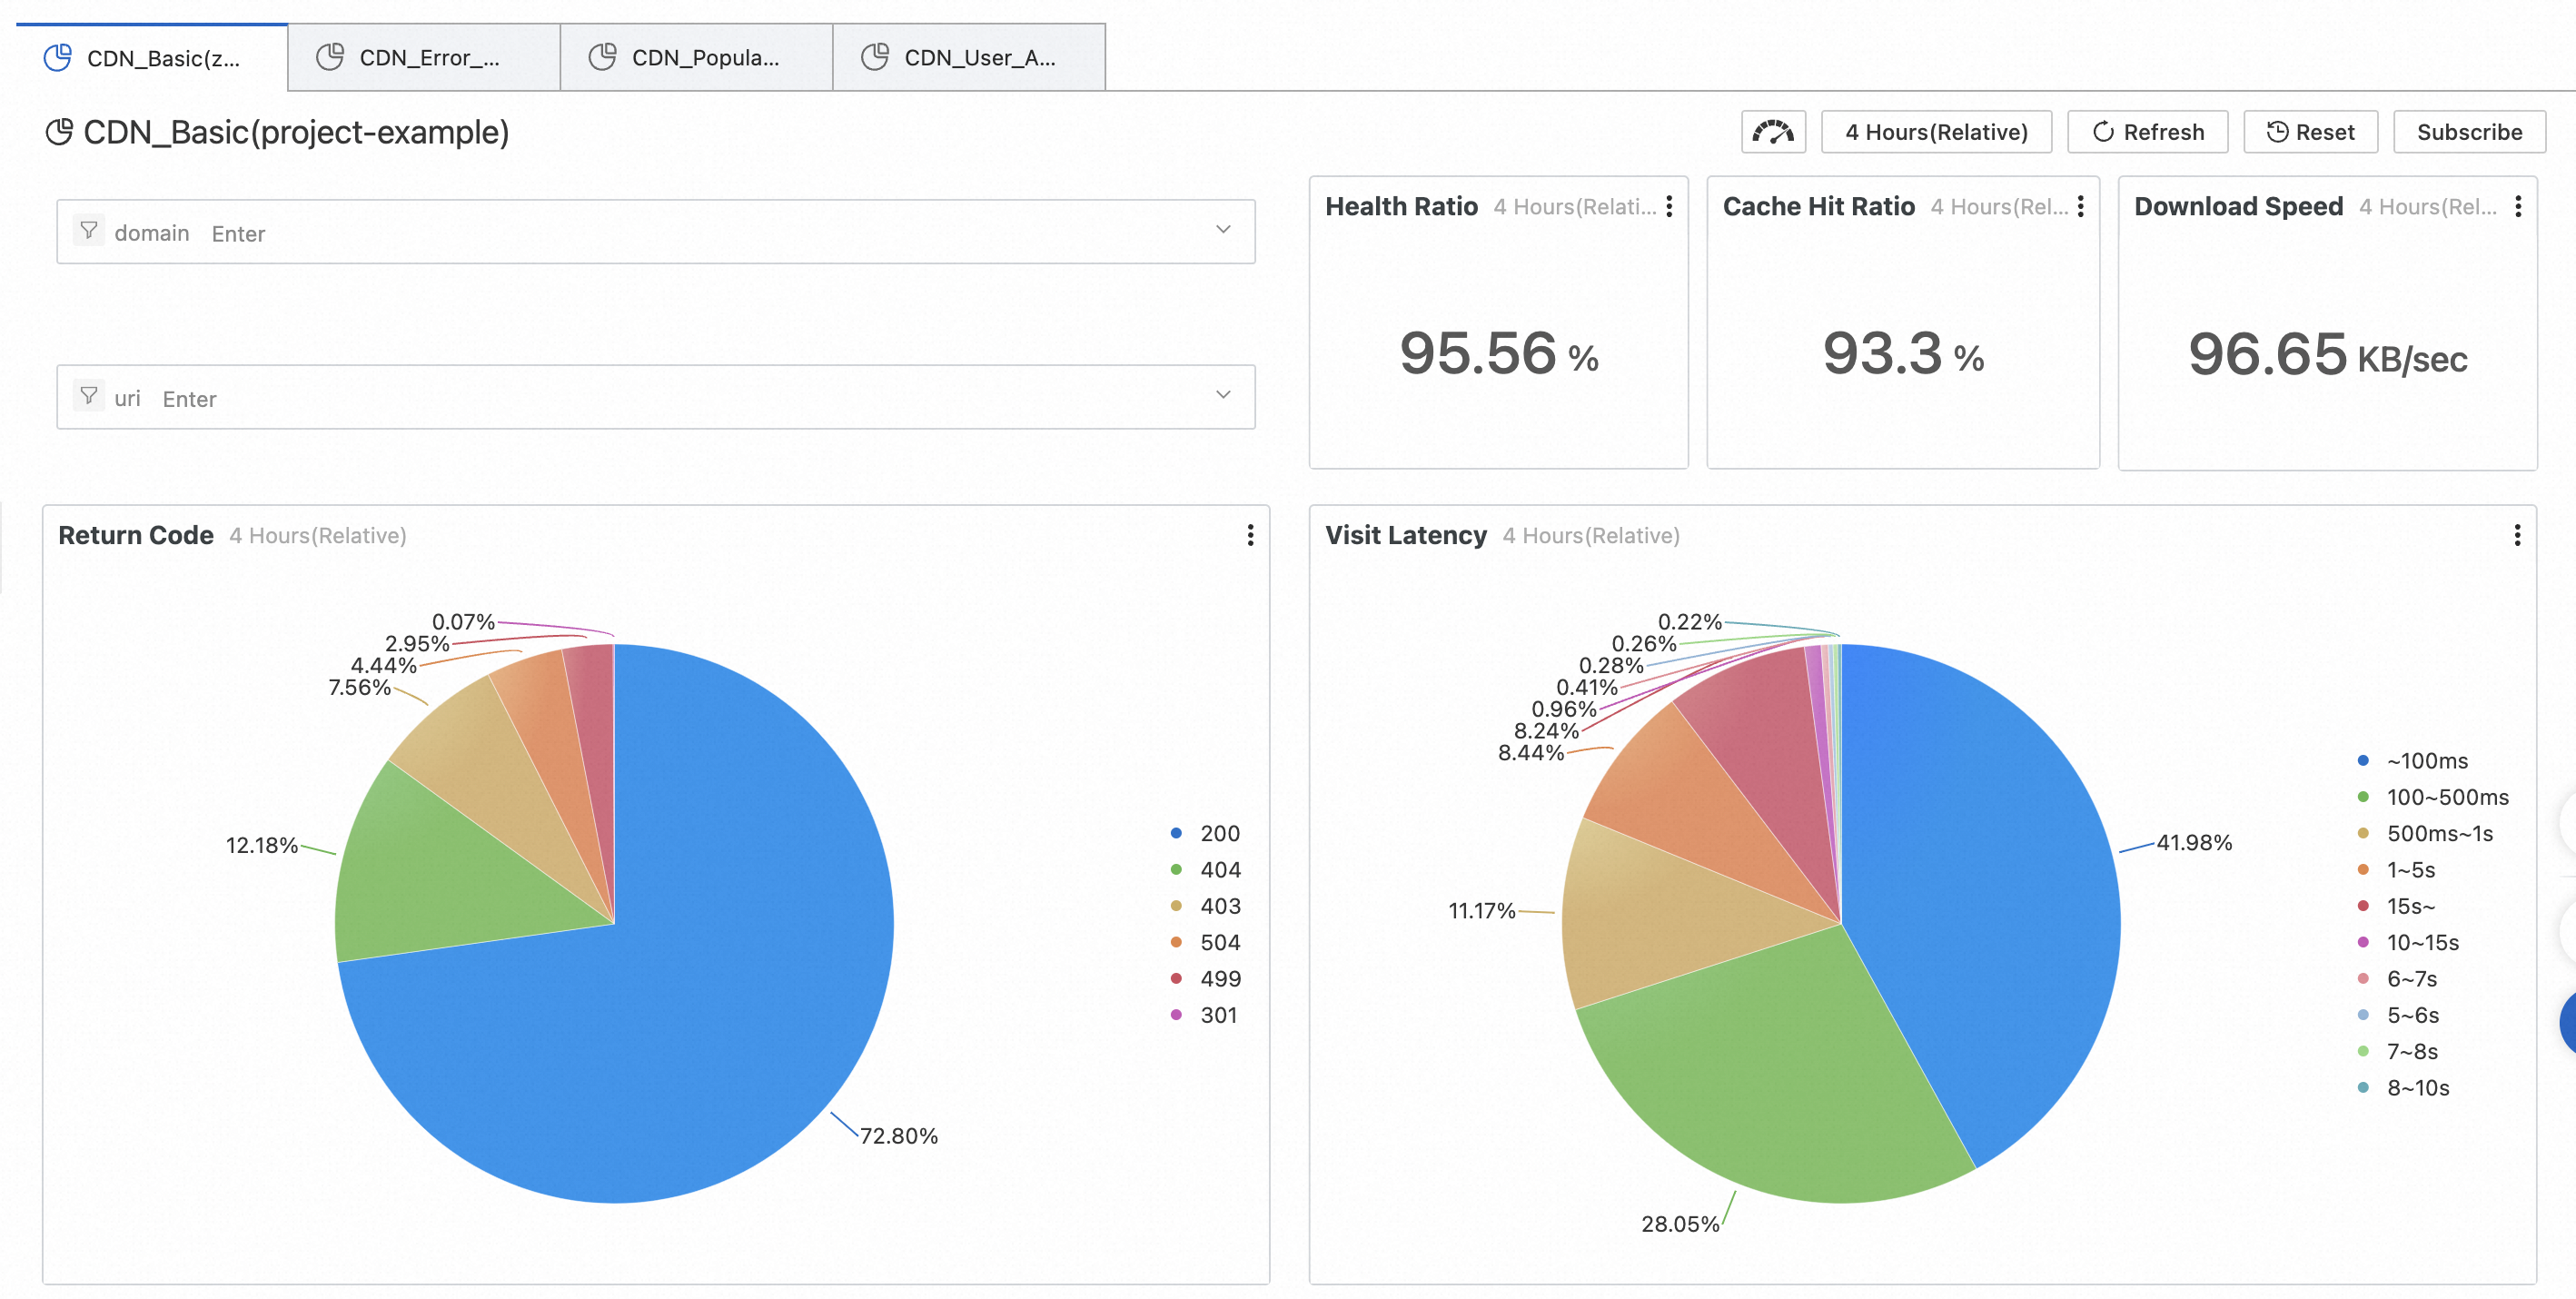
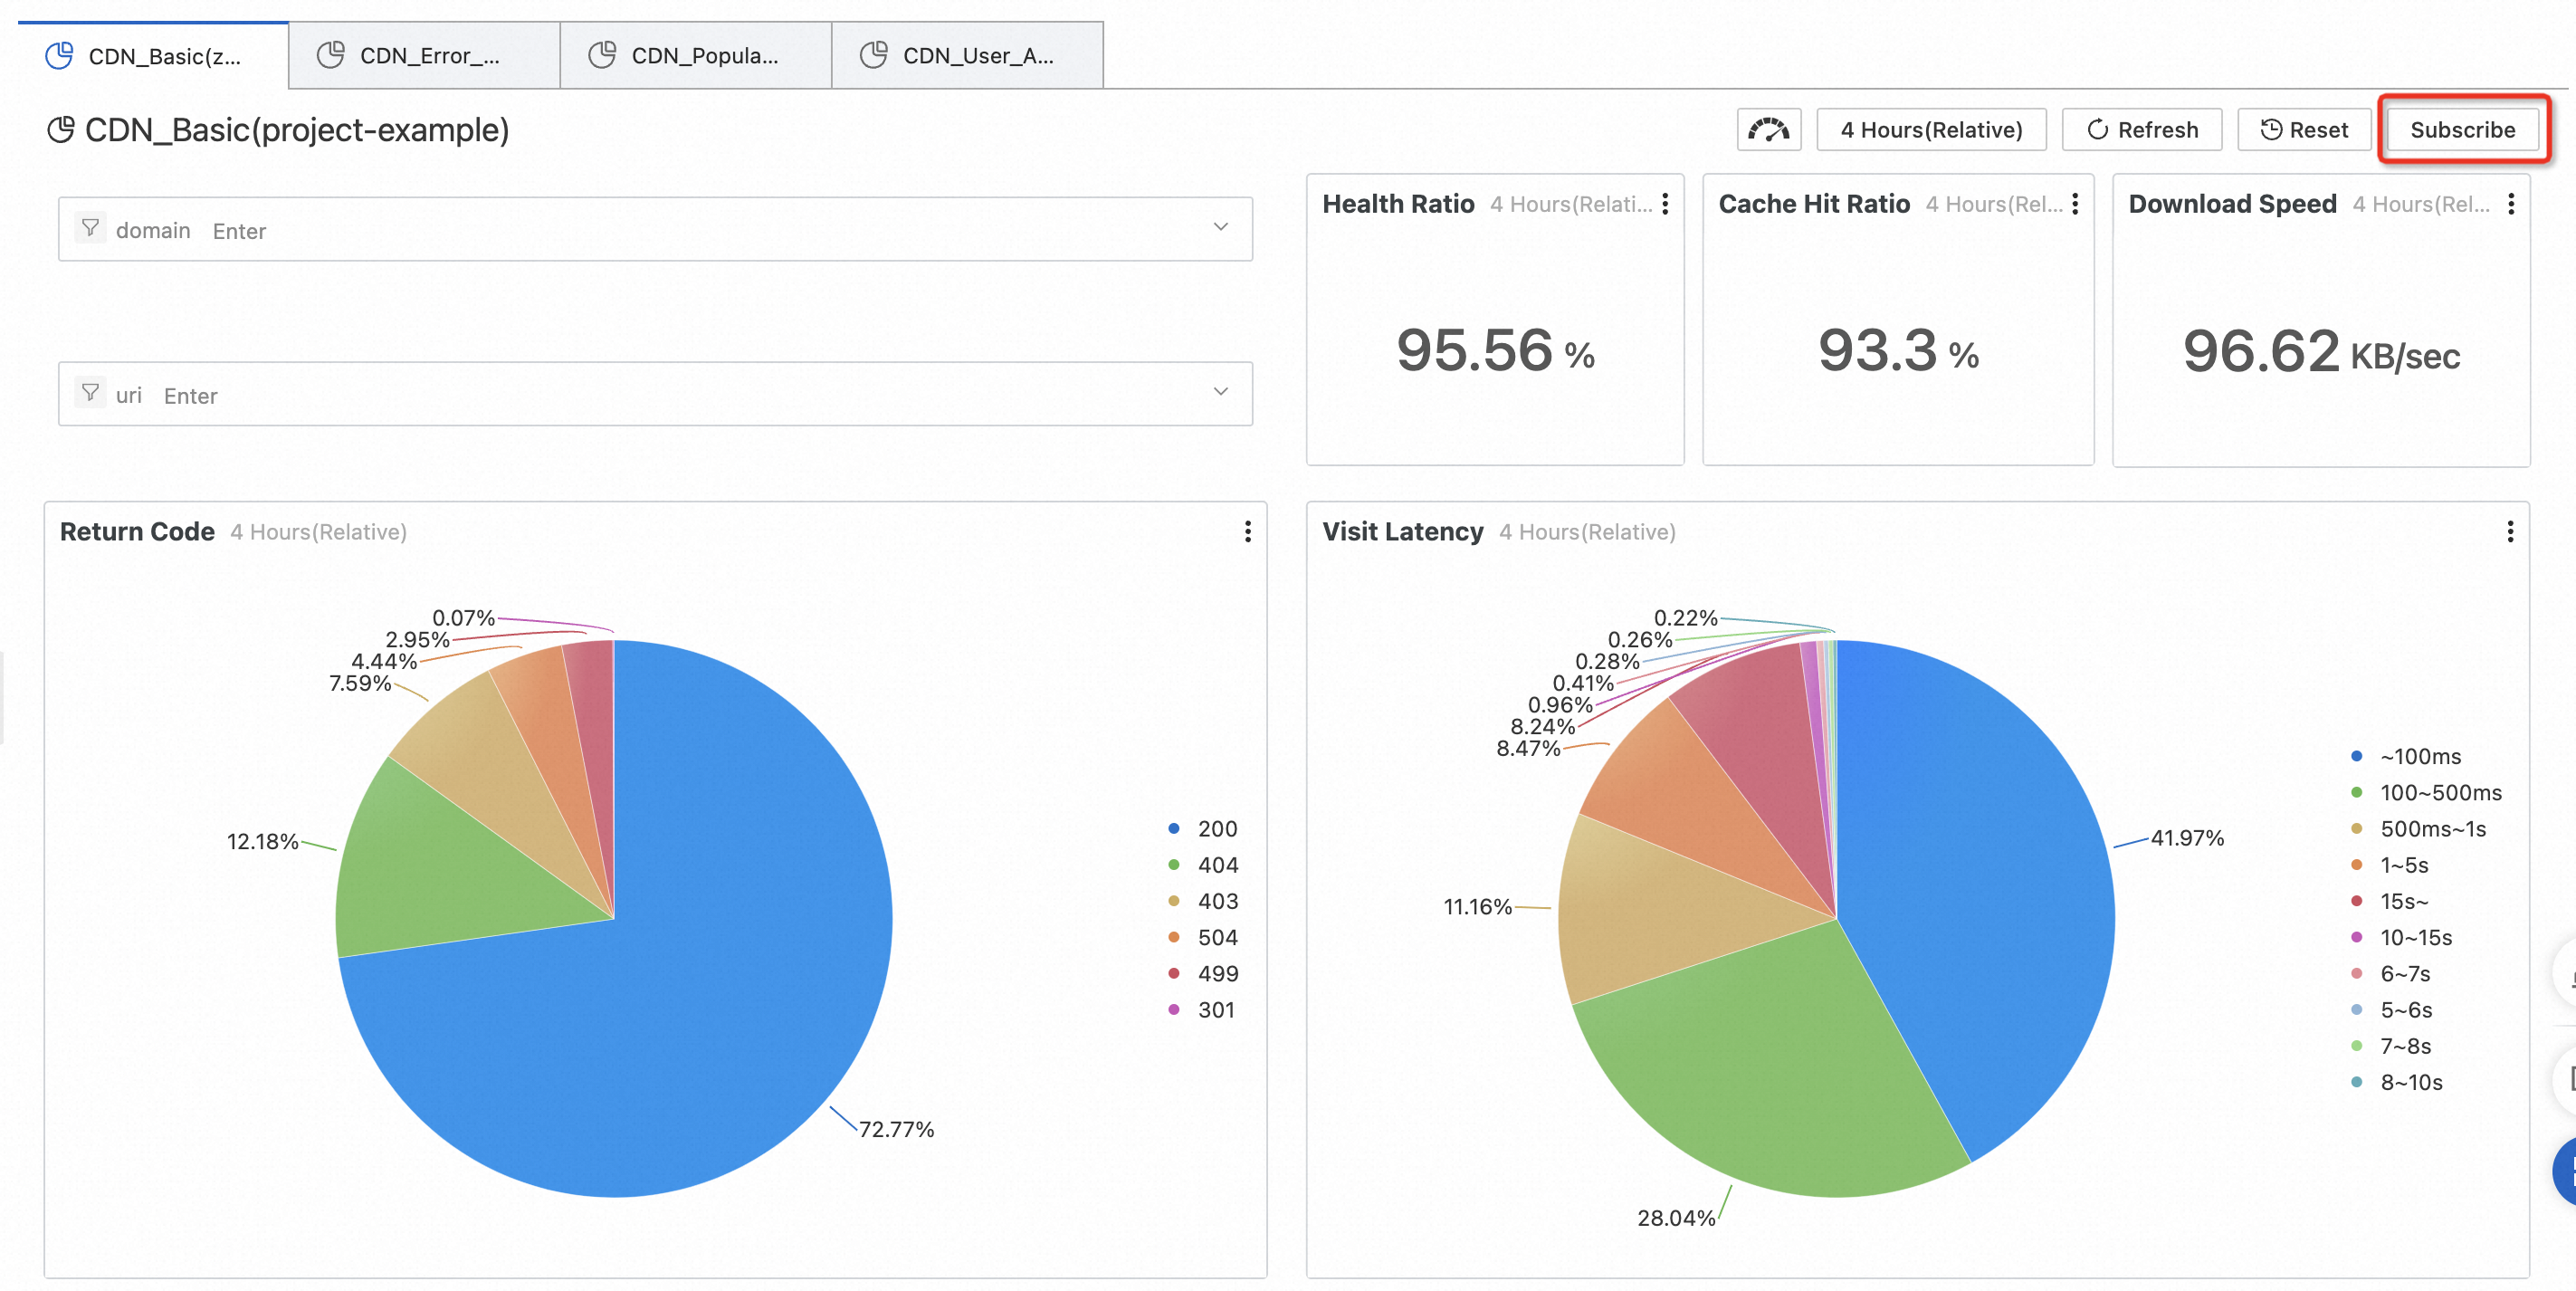
Preset report: CDN basic data
This data helps you quickly understand the overall service quality of CDN and the access efficiency of end users, such as hit rate, access latency, and download speed. It also lets you promptly handle service quality issues when they occur.
This report includes the following data. You can view all data, or filter data by domain name or URI.
Health: The percentage of responses with normal status codes.
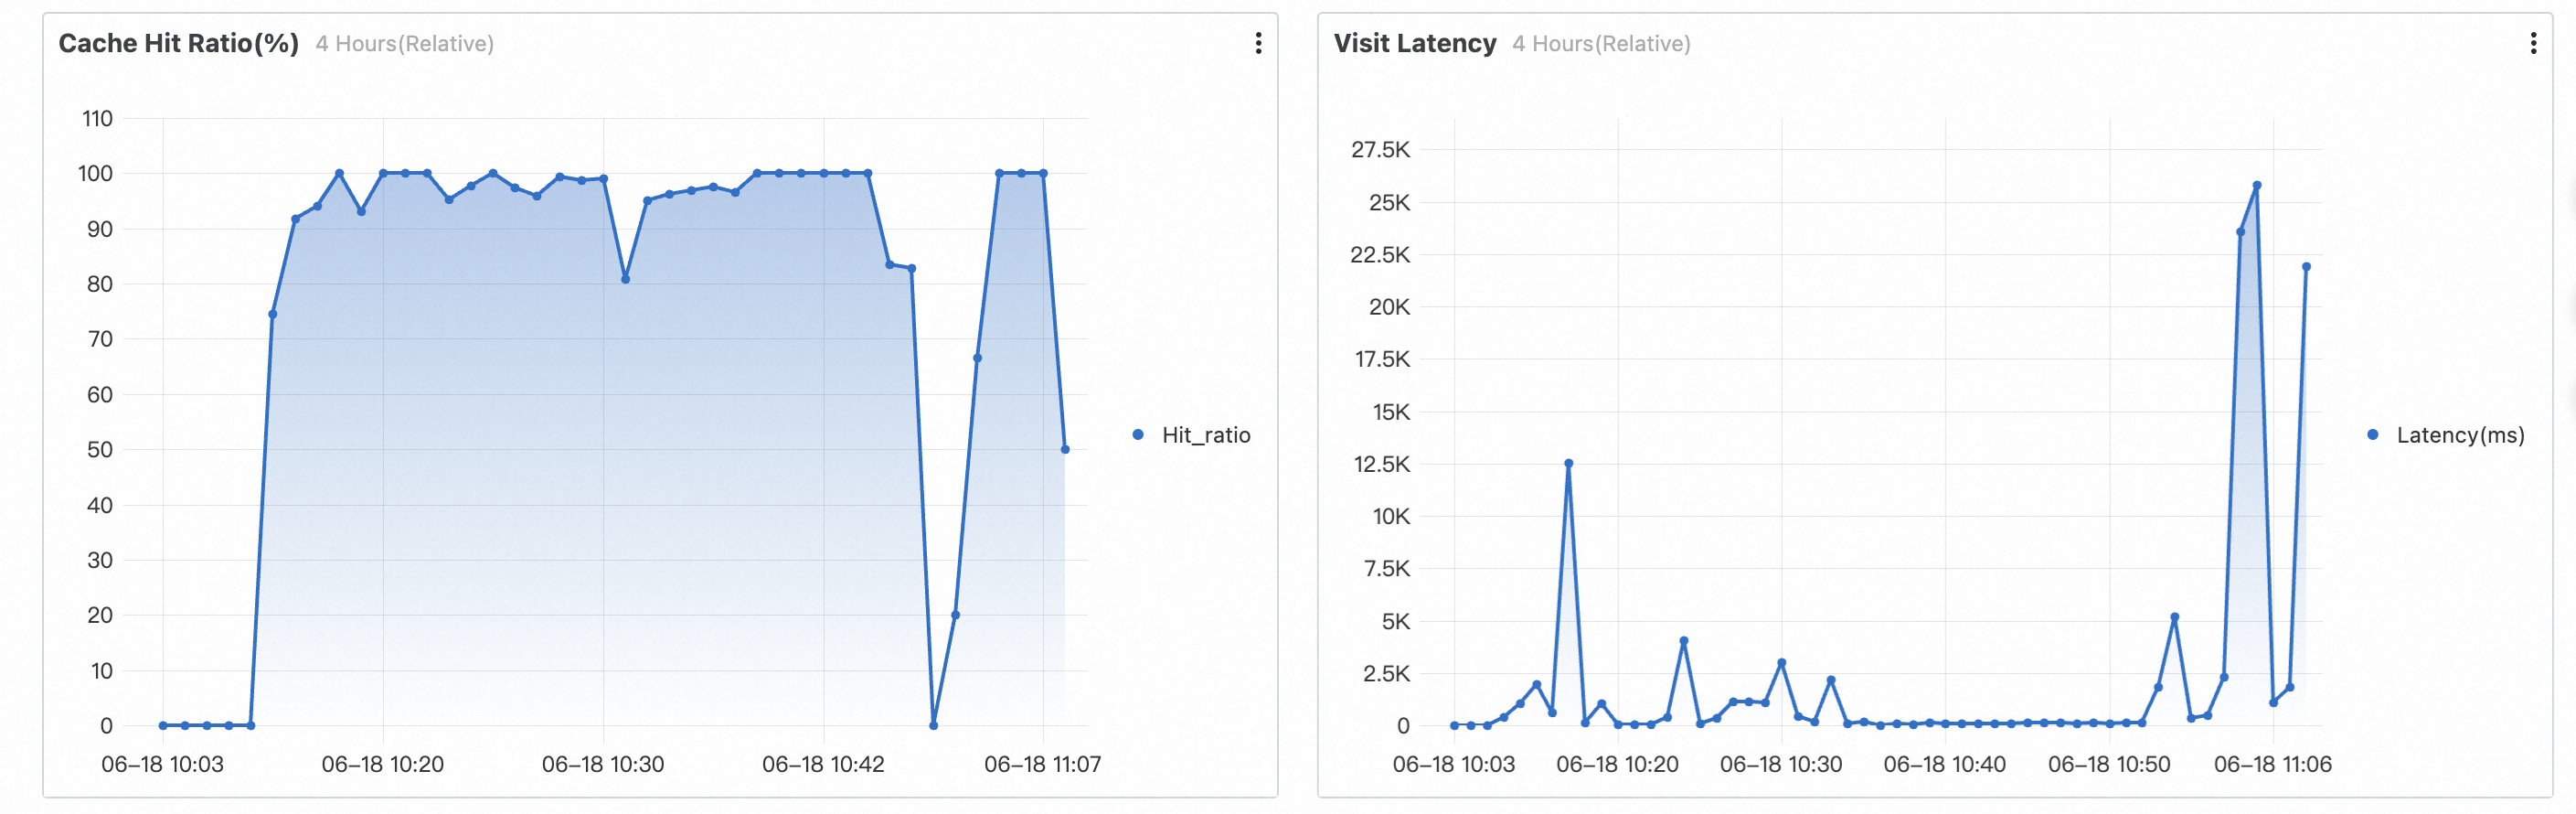
Cache hit ratio: The average cache hit ratio of resources, calculated by bytes.
Download speed: The average download speed of resources.
Access status: The percentage of each response status code. You can use this to quickly view the percentage of abnormal status codes.
Access latency distribution: The percentage of each latency segment.
Request bandwidth: The bandwidth value at a 1-minute granularity.
Number of visits/visitors: The page views (PV) and unique visitors (UV).
Request hit ratio: The hit ratio calculated by the number of requests.
Access latency: The average access latency for downloading resources.
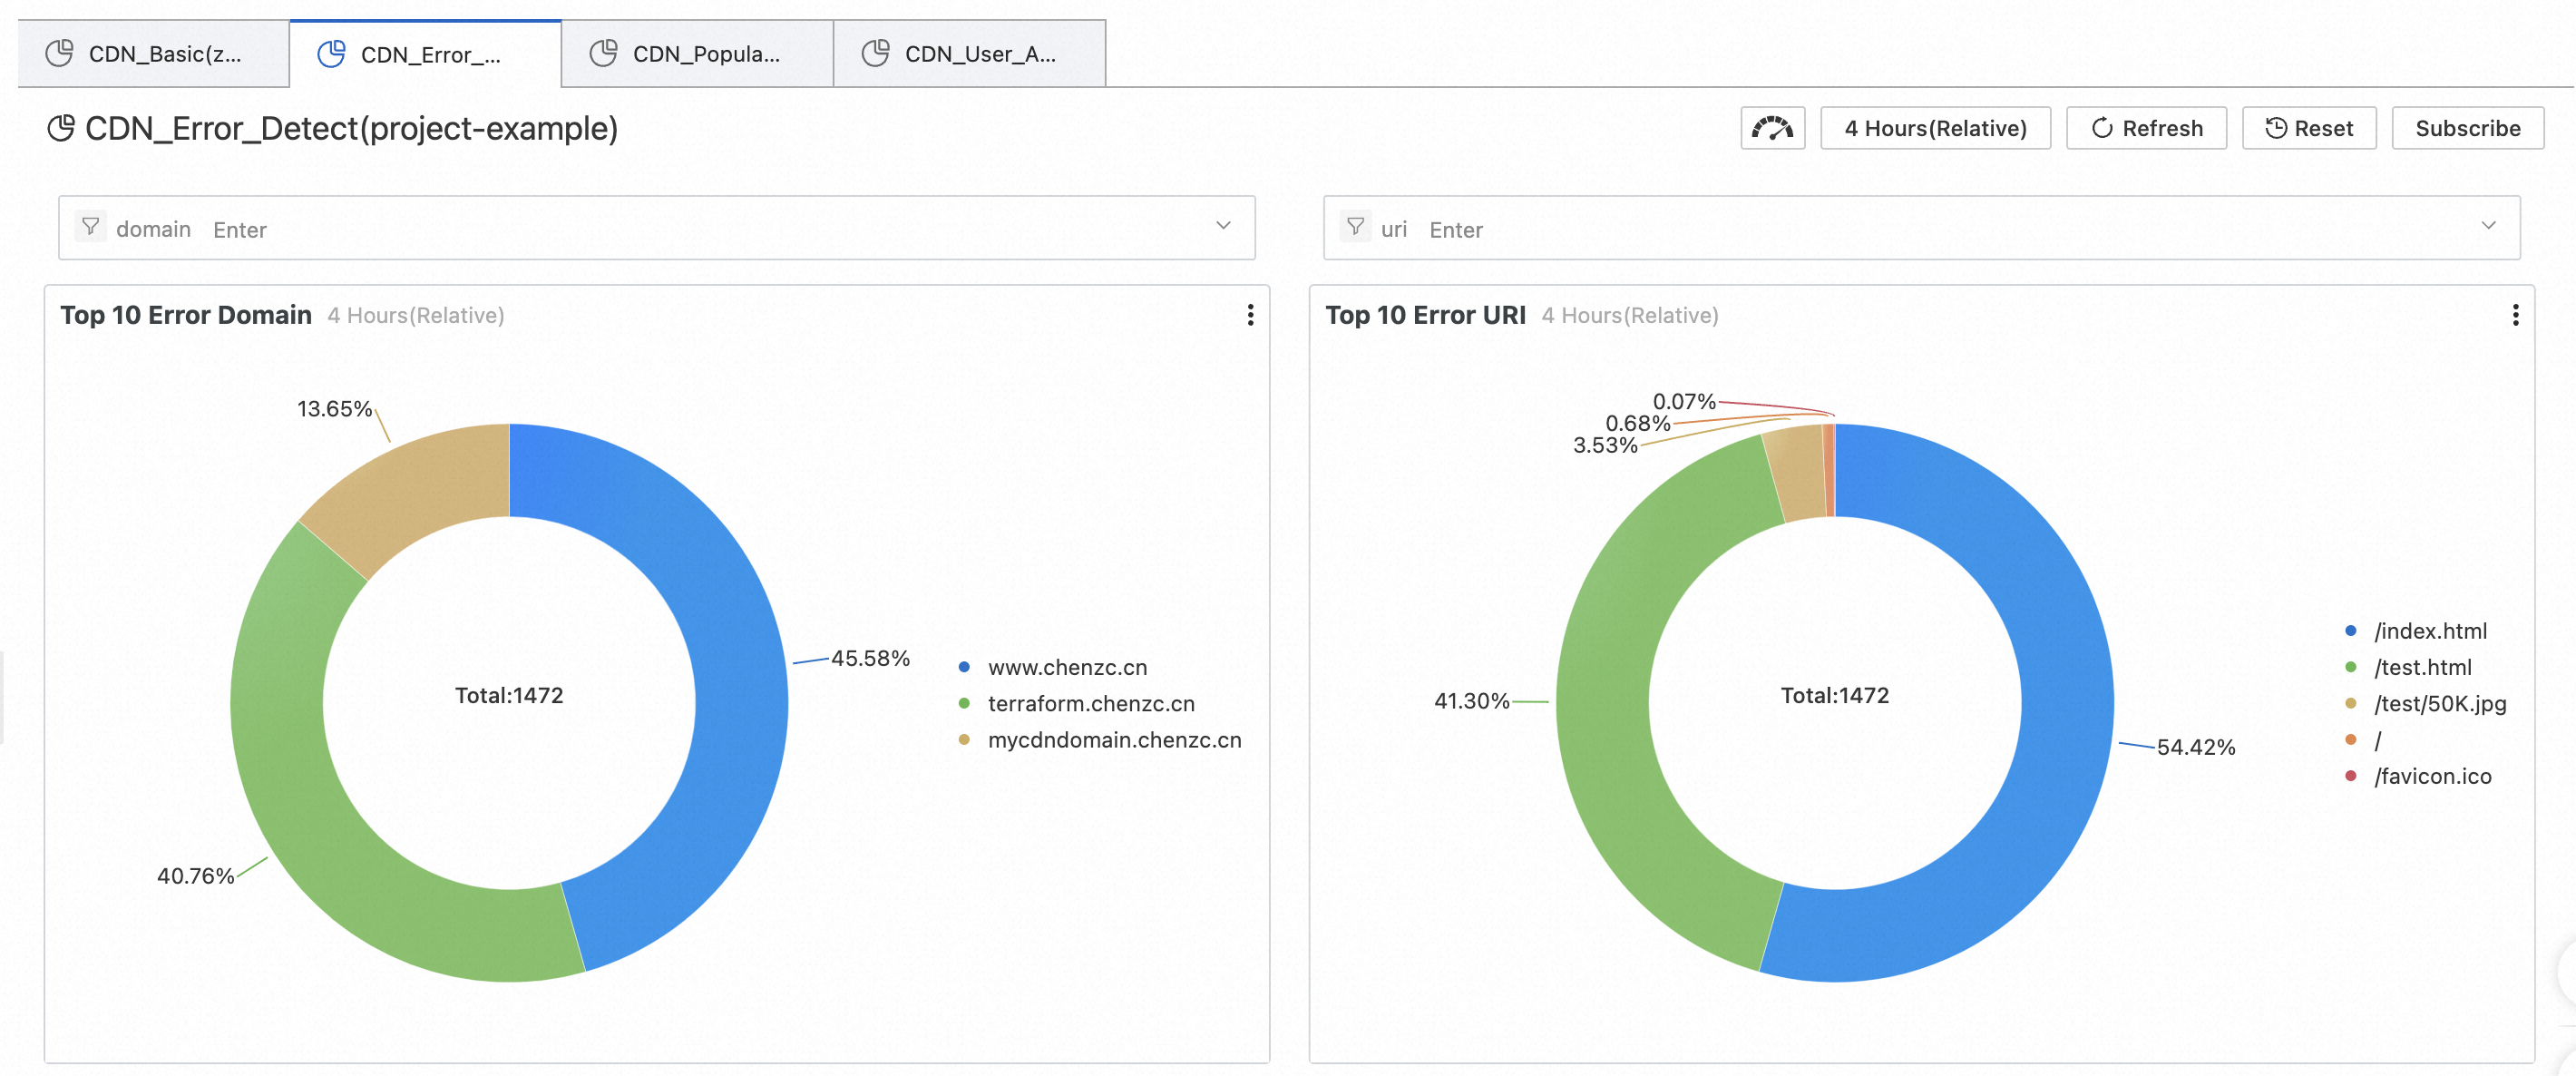
Preset report: CDN access errors
This data helps you quickly locate the source of CDN service issues when application access is abnormal. Examples of issues include partial URI issues, origin server failures, unavailable nodes, network issues in specific provinces, or network issues with specific carriers.
This report includes the following data. You can view all data, or filter data by domain name or URI.
Top 10 error domain names: The domain names with the highest percentage of access errors.
Top 10 error URIs: The URIs with the highest percentage of access errors.
Request error percentage: The percentage of 4xx and 5xx status codes over time.
Error request status distribution: The number and percentage of each status code.
Error statistics by carrier: The number of 4xx and 5xx status codes for different carriers.
Error statistics by province: The number of 4xx and 5xx status codes for different provinces.
Error details (4xx): The number and percentage of 4xx status codes for different provinces and carriers.
Error details (5xx): The number and percentage of 5xx status codes for different provinces and carriers.
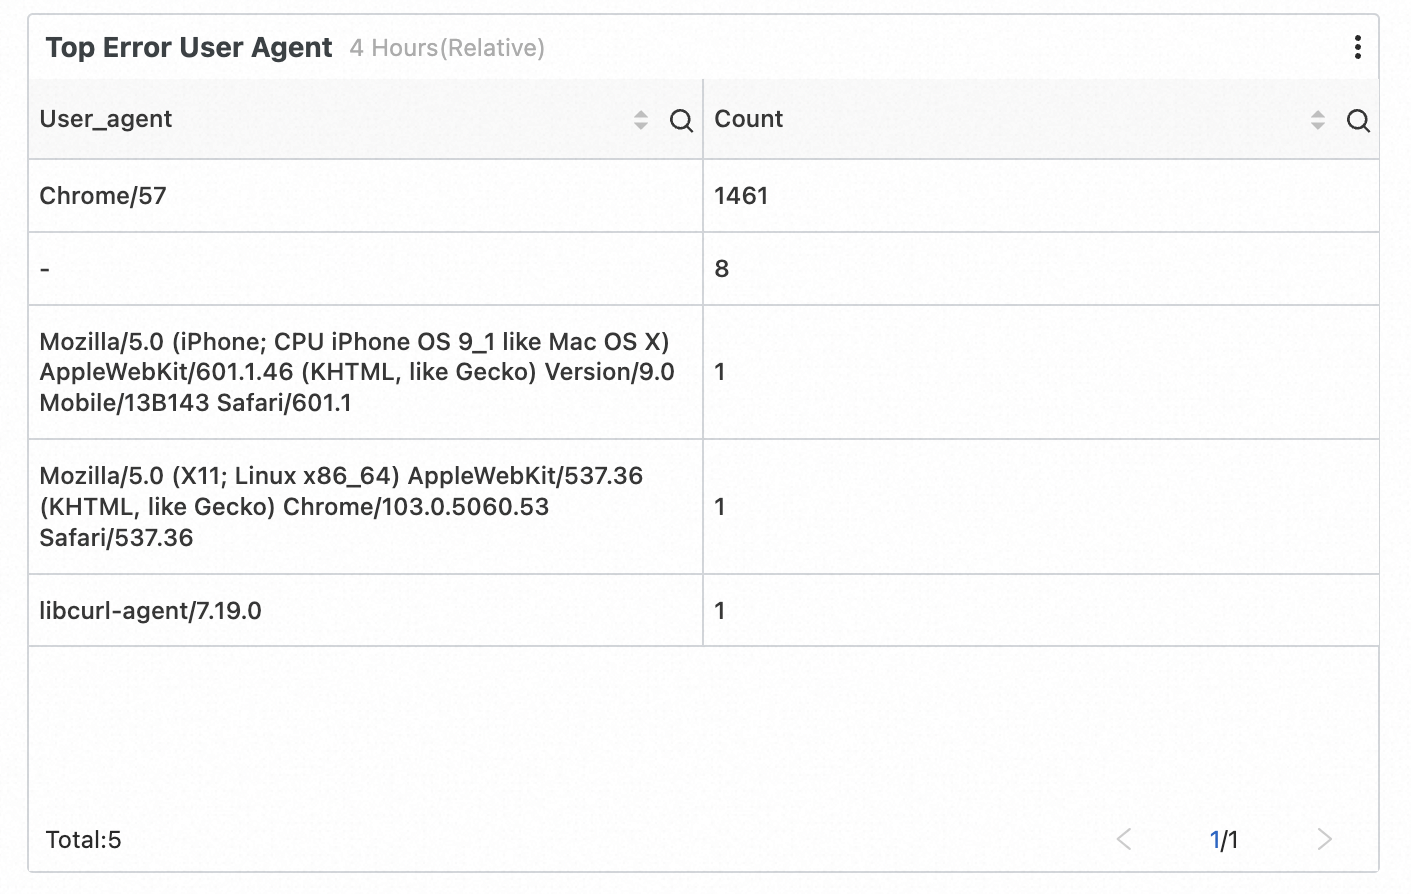
Error distribution by client: The number and percentage of 4xx and 5xx status codes corresponding to the User-Agent (UA) of different clients.
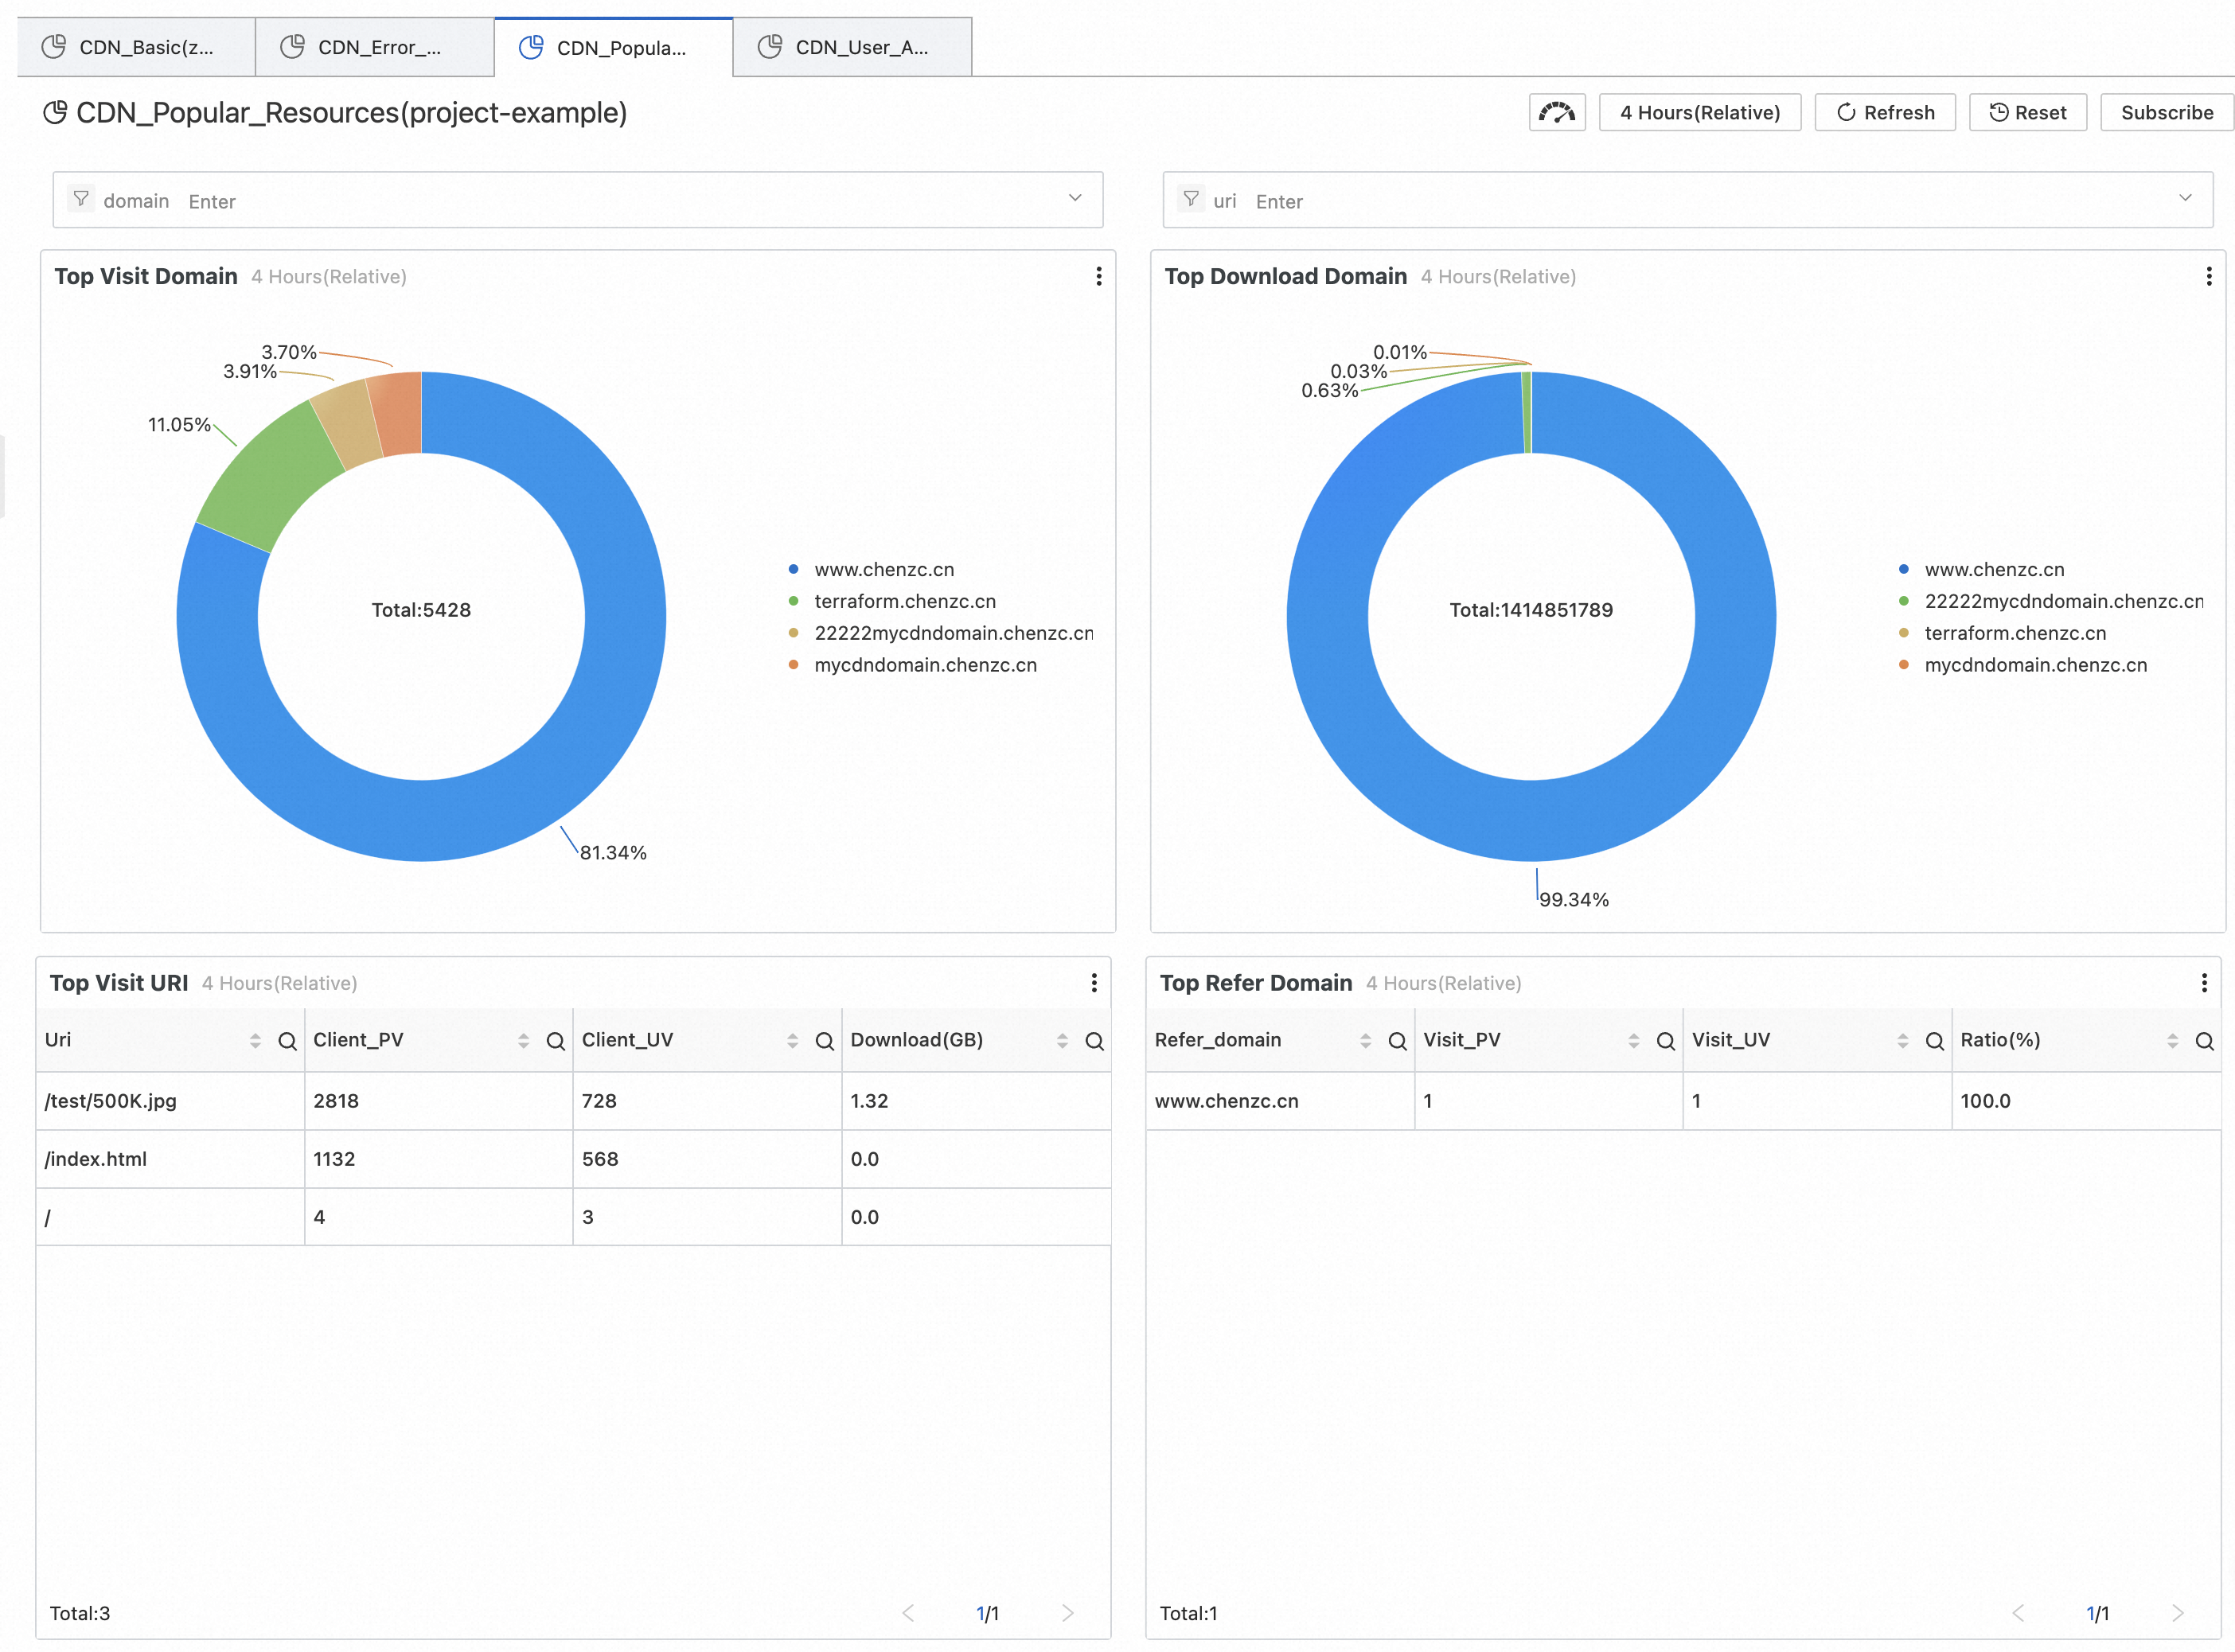
Preset report: CDN hot spot resources
This data helps you better understand hot spot resources and analyze popular domain names, URIs, provinces, and carriers. You can also use the hot spot data to determine whether your operational activities are effective and whether the traffic increase during hot spot periods meets expectations. This helps you adjust your operational strategies in a timely manner.
This report includes the following data. You can view all data, or filter data by domain name or URI.
Top domain names by number of visits: The domain names with the highest percentage of total visits.
Top domain names by download traffic: The domain names with the highest percentage of total download traffic.
Popular access URIs: The number of visits, number of visitors, and total download volume for each URI.
Popular access sources: The popular Referer source domain names, with records of the number of visits, unique visitors (UVs), and percentages.
Nationwide visit statistics: The number of visits for each province.
Nationwide download speed: The average download speed for each province.
Statistics by province: The total number of visits, total download traffic, and average download speed for each province.
Carrier traffic and speed: The total download volume and average download speed for each carrier.
Statistics by carrier: The total number of visits, total download traffic, and average download speed for each carrier.
Preset report: CDN user composition
This data helps you better understand the composition of your website's users, including their client types, provinces, and carriers. It can also compile statistics on top users by access volume and top users by download volume.
This report includes the following data. You can view all data, or filter data by domain name or URI.
Number of visits: The total number of visits (PV).
Number of visitors: The total number of visitors (UV).
Access region distribution: The number and percentage of visits for each province.
Access client statistics: The number and percentage of visits for each client type.
Visit statistics by carrier: The total number of visits and percentage for each carrier.
Top users by download volume: The total number of visits, number of error visits, and total download volume for users, grouped by IP address.
Top users by valid visits: The total number of visits, number of error visits, and total download volume for users, grouped by IP address (excluding invalid visits with 4xx and 5xx status codes).
Subscribe to report template data
If you need Simple Log Service to periodically send you data from a report template, you can use the subscription feature.
Procedure
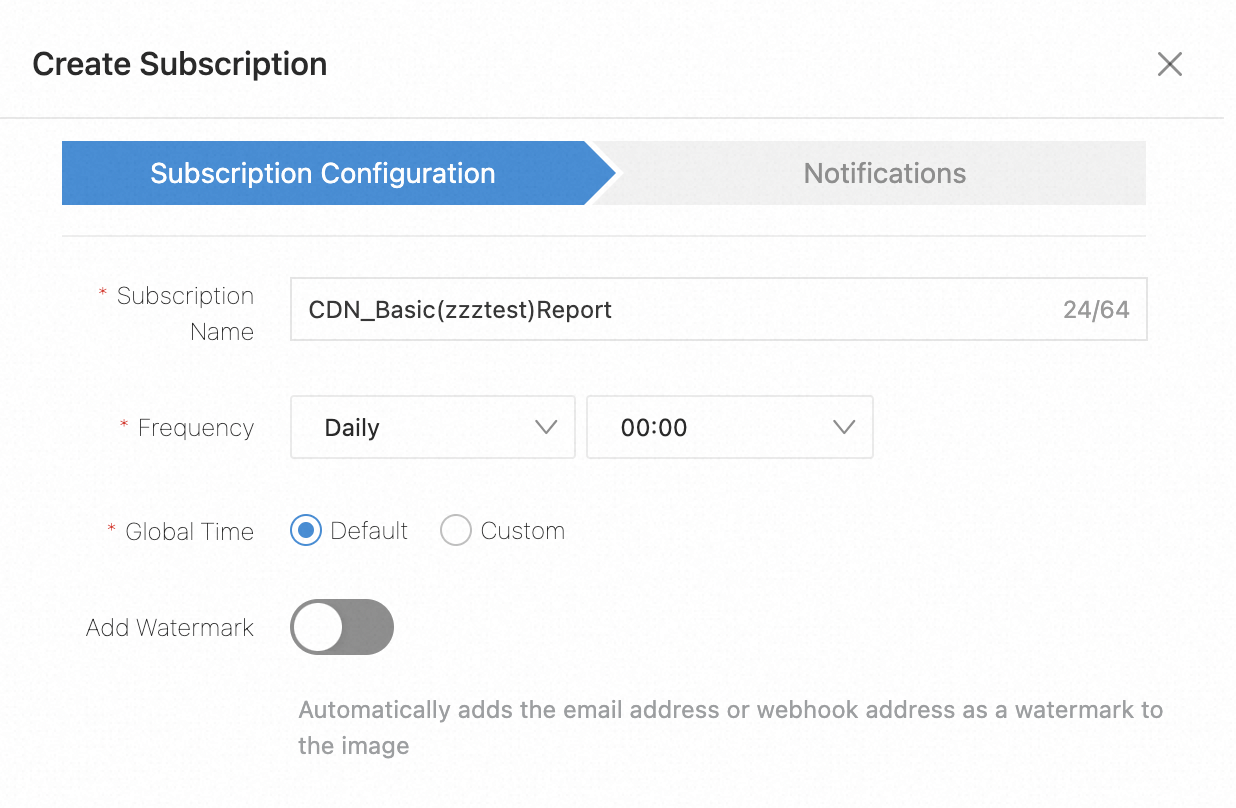
For example, on the CDN basic data page, click Subscribe in the upper-right corner, and then click Create.
In the configuration window that appears, enter a Subscription Name, Frequency, and Global Time, and then click Next.
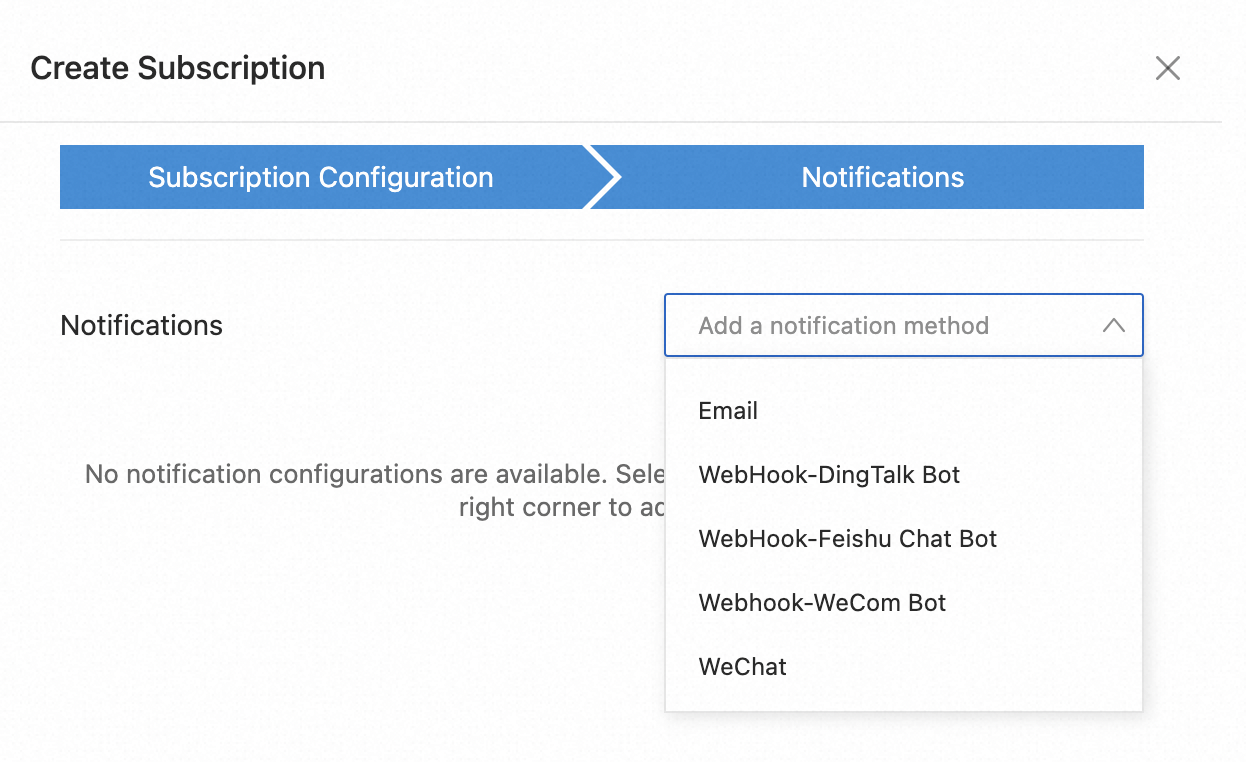
From the Notification List drop-down menu, select a notification method, fill in the relevant information, and then click Submit to create the subscription.
Supported notification methods include Email, WebHook-DingTalk Robot, WebHook-Lark Robot, WebHook-WeCom Robot, and WeChat.
Custom reports
Example 1: View the ranking of domain names with the response status code 499 in the last 30 days.
Search statement:
return_code = 499| select domain , count(*) as c group by domain order by c desc limit 10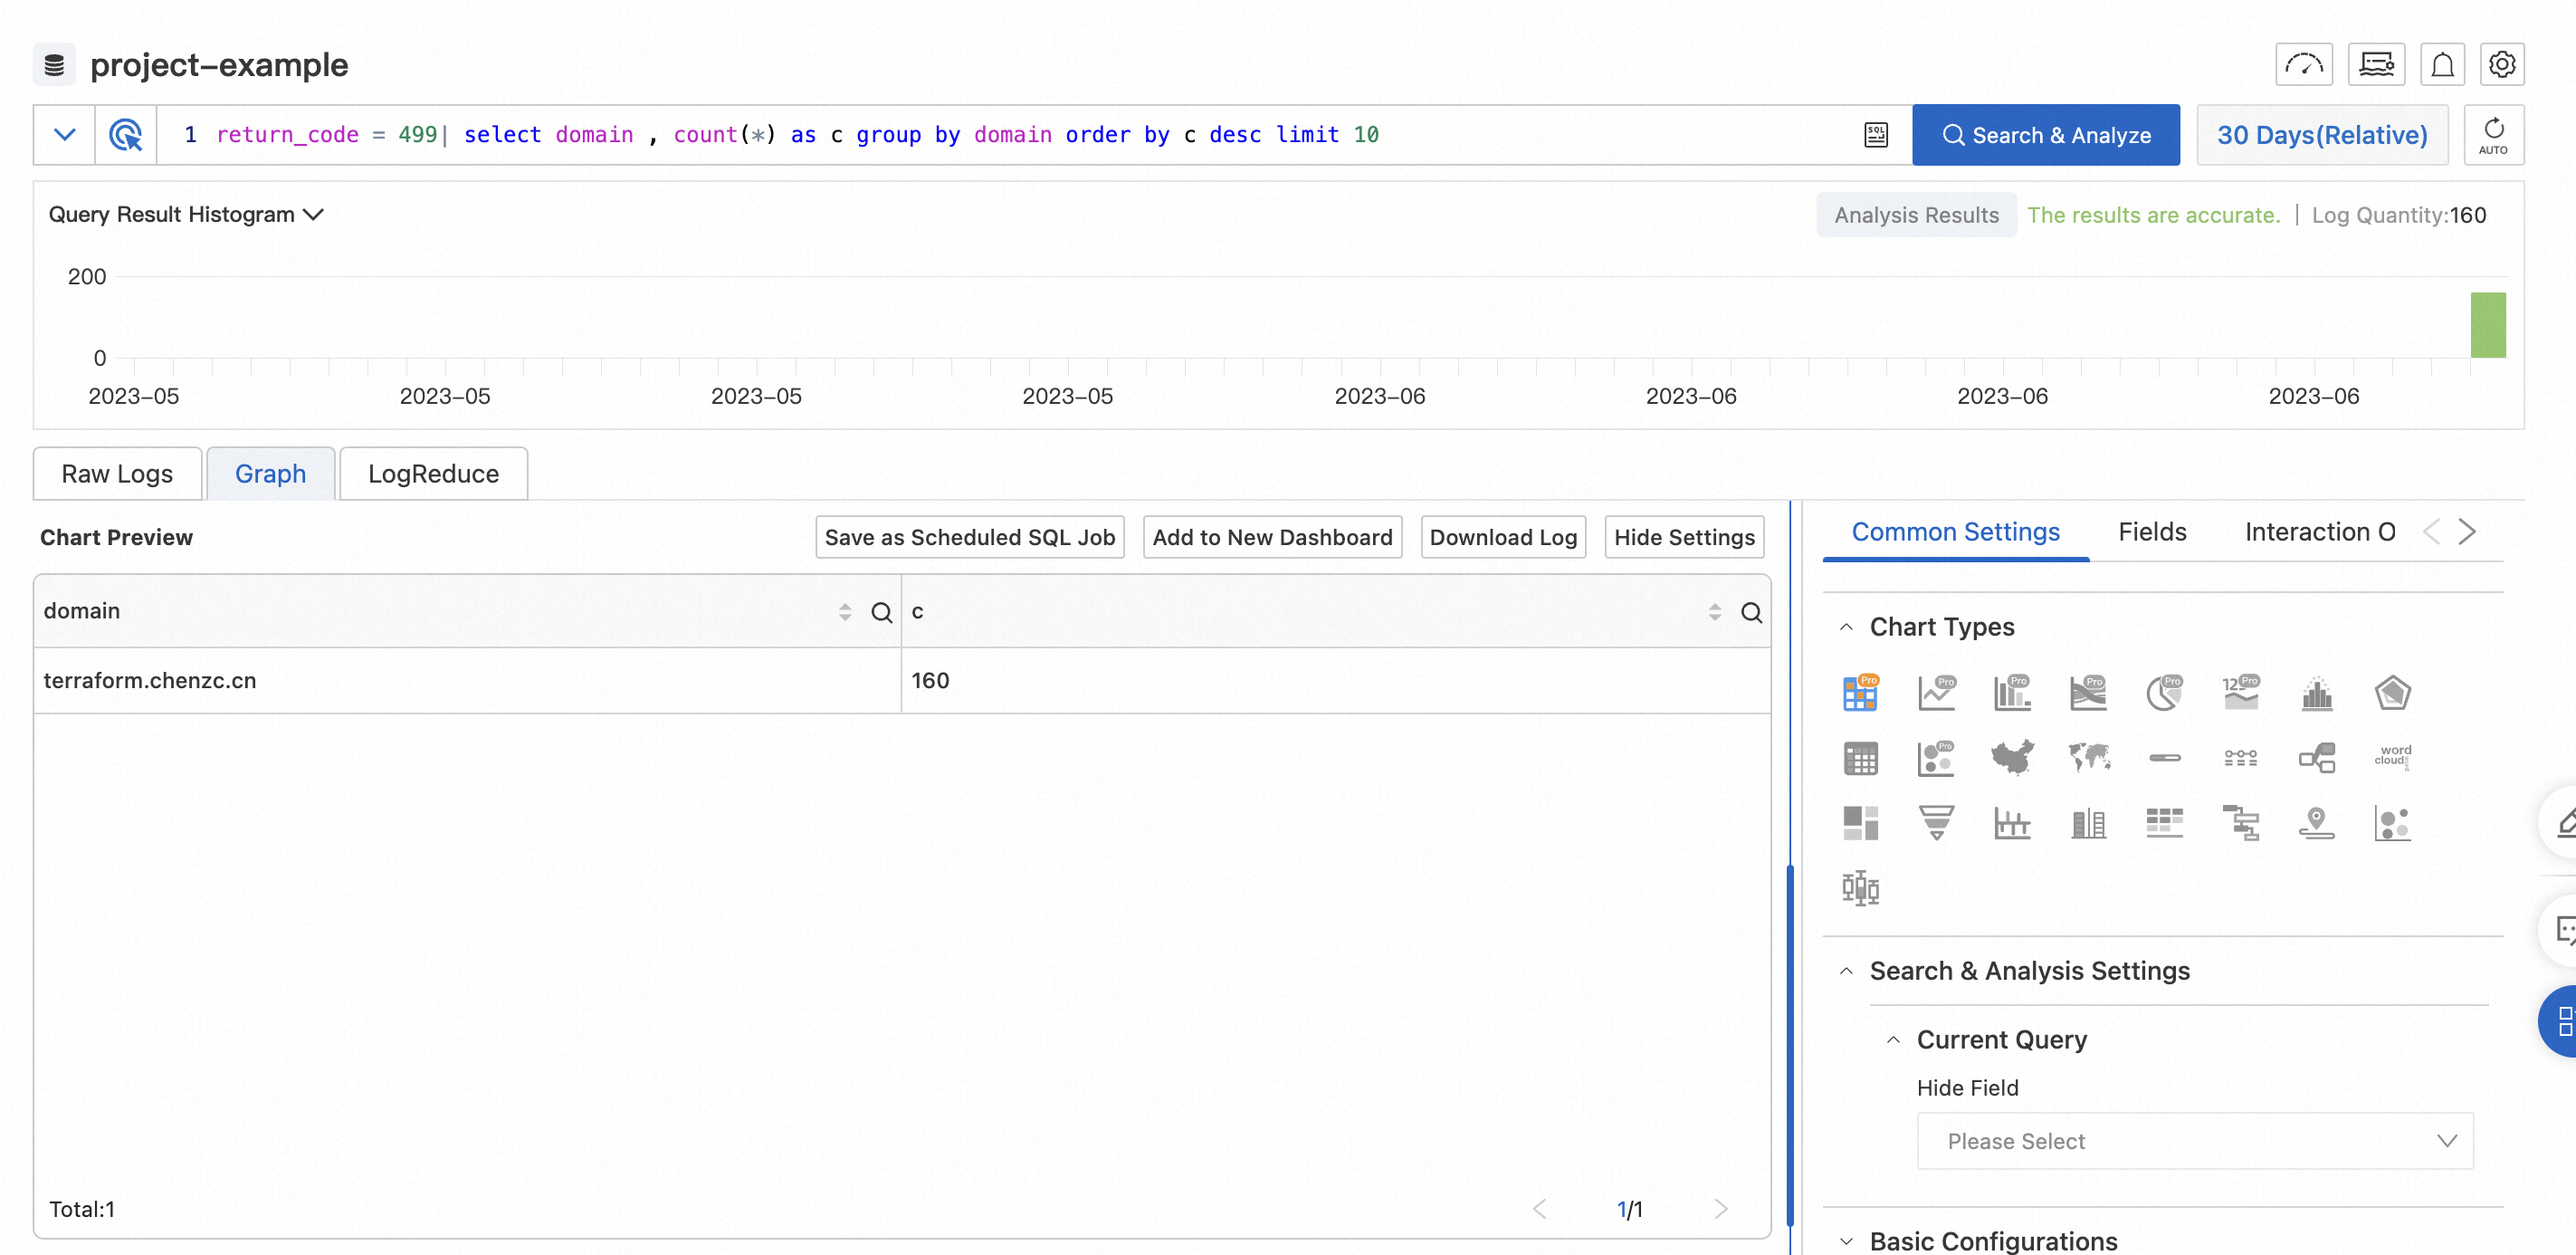
Example 2: View the ranking of domain names with the response status code 502 in the last 30 days.
Search statement:
return_code = 502| select domain , count(*) as c group by domain order by c desc limit 10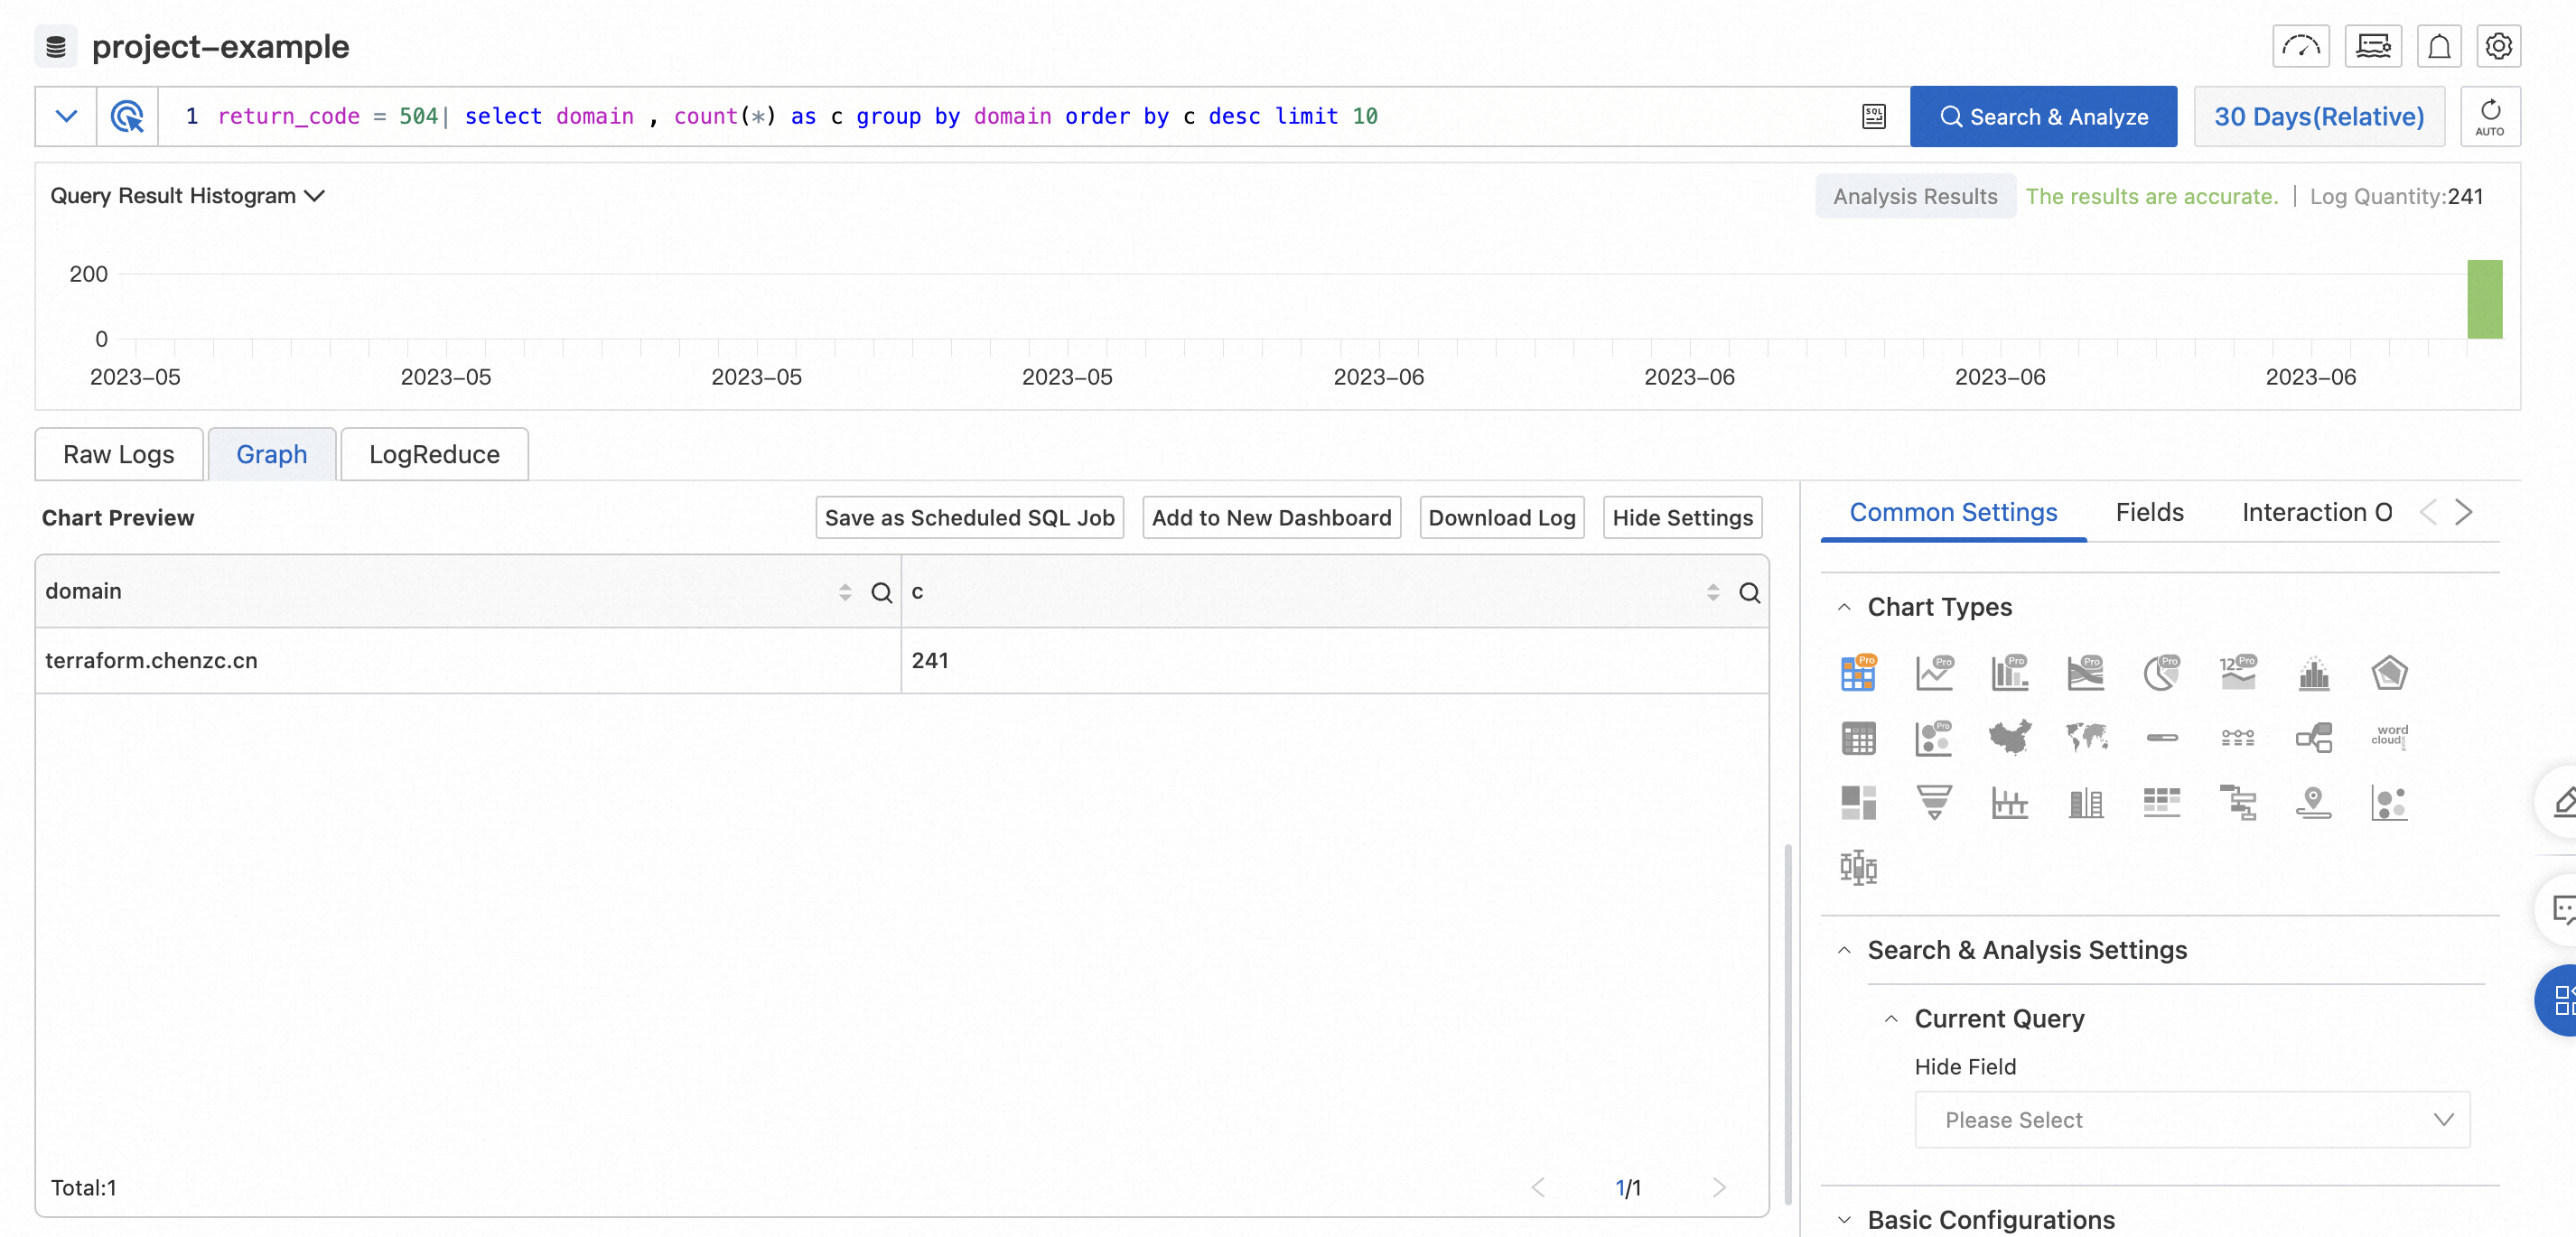
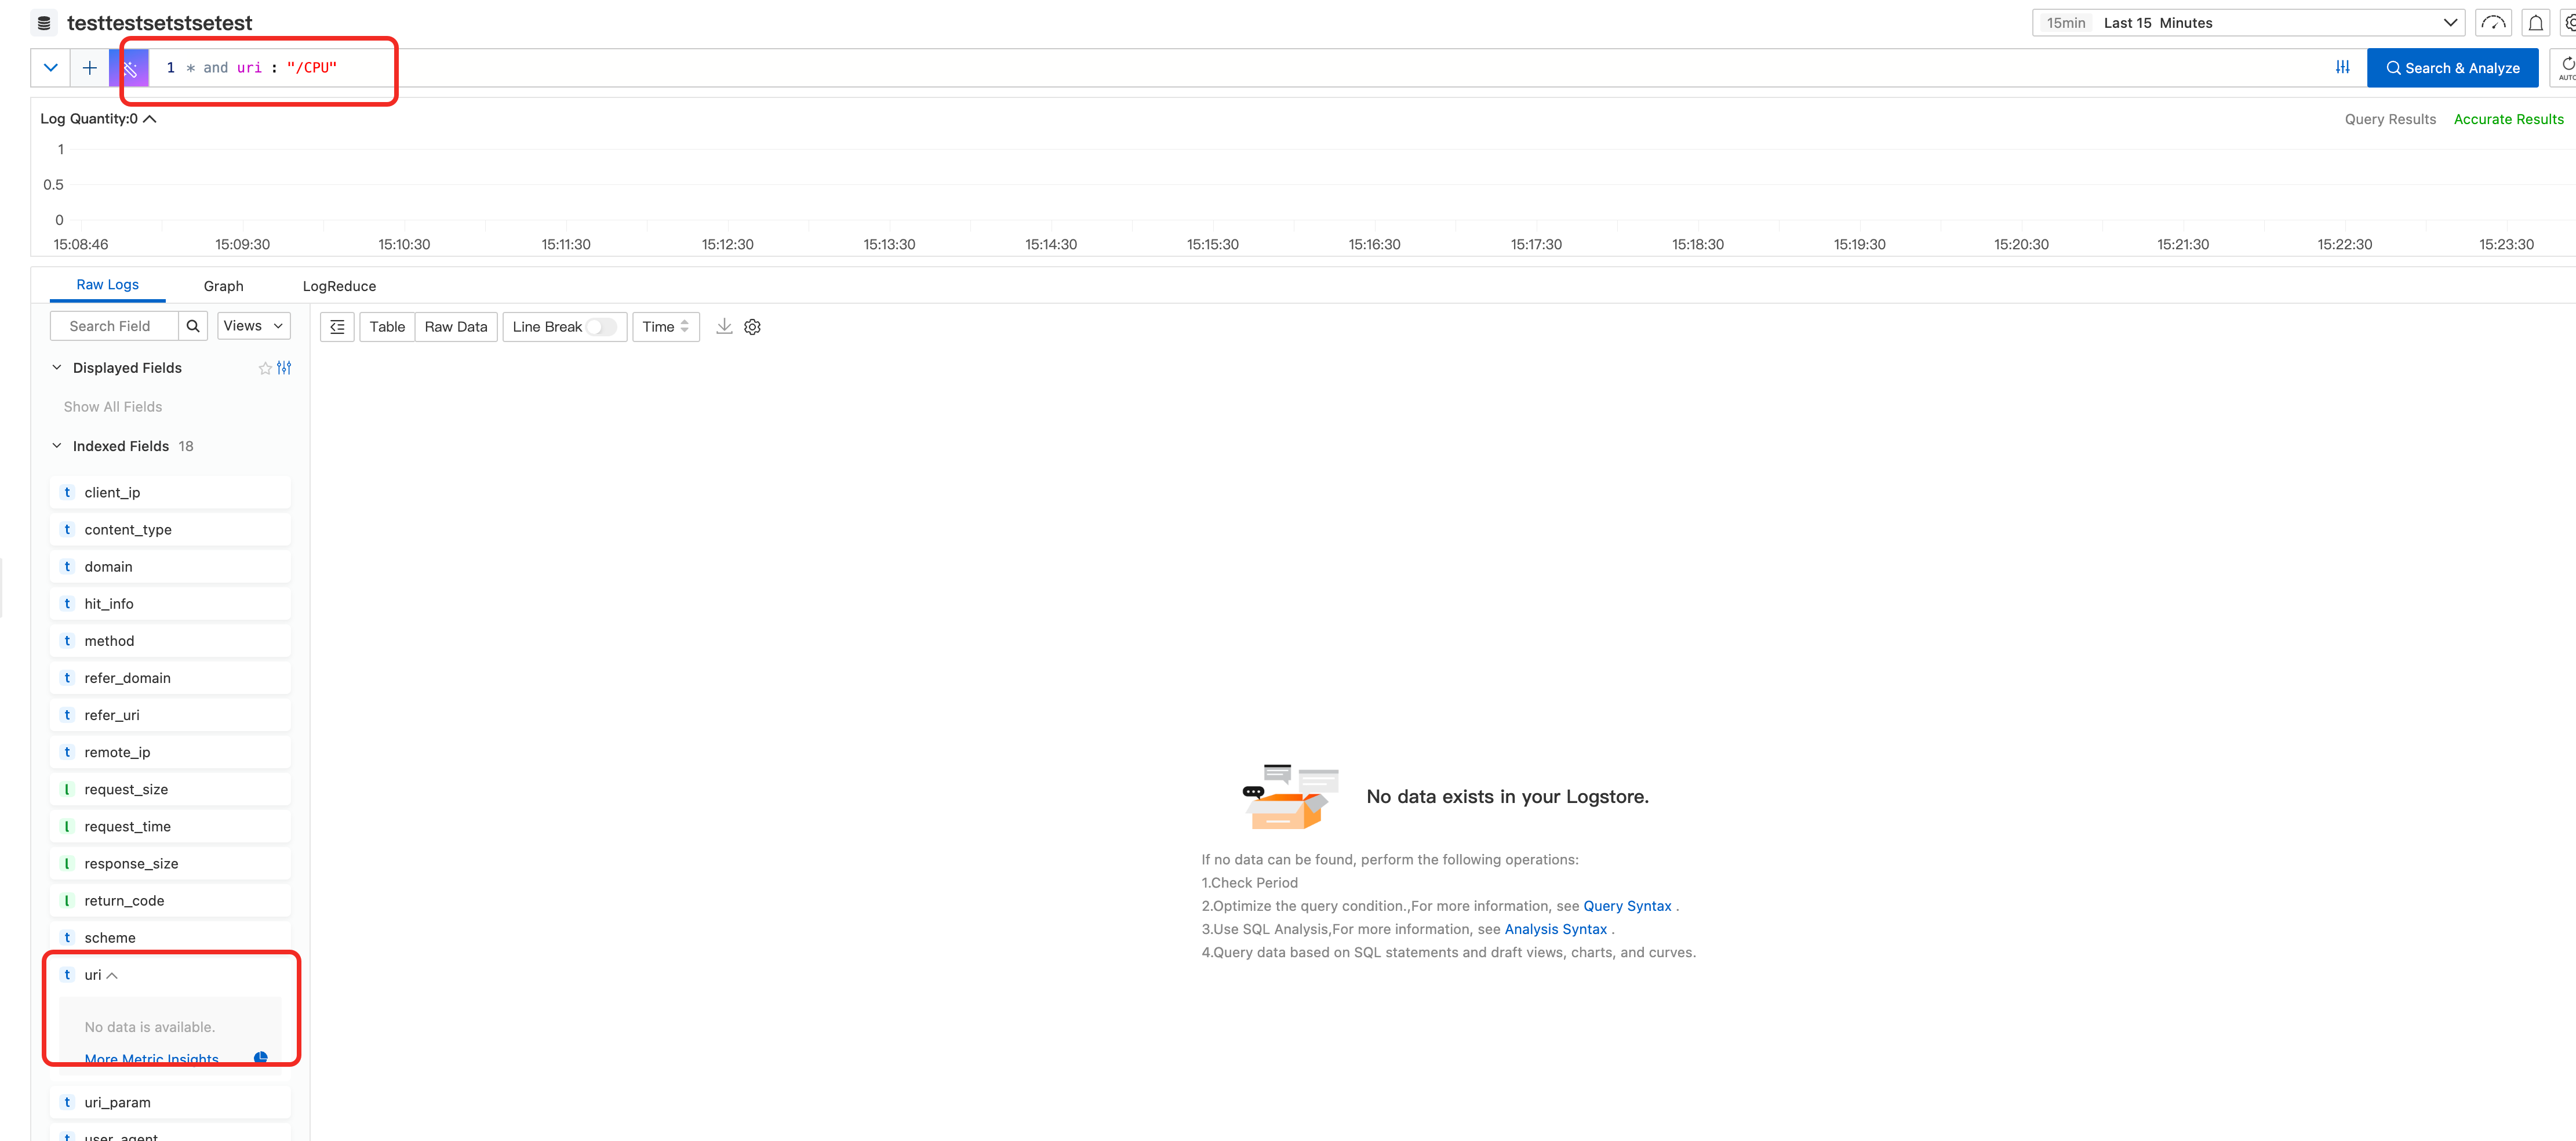
Example 3: View the log data for the access URI /cpu in the last 30 days.
You can click the URI field in the Raw Logs column on the left, and then click /cpu to filter for the required logs.