The new Cost Manager stores data in Tablestore to ensure accuracy and real-time availability. The data is automatically updated daily. This topic describes how to use the new Cost Manager.
Benefits
Cost optimization: Analyze your pay-as-you-go bills and compare their costs with the subscription billing method.
Automated bill transfer: Configure once to automatically and continuously transfer your bill data.
Interactive analysis: Use standard SQL to query your bills and get results in seconds.
AI-powered insights: Use machine learning to forecast spending, track trends, and detect anomalies.
Automated reports and alerts: Schedule and send analysis reports to channels such as DingTalk and email. Use machine learning to forecast cost trends, identify unusual bills, and automatically trigger alerts.
Open integration: Integrate with more than 30 data analysis products, including Hadoop, Spark, and Flink.
Procedure
Log on to the Simple Log Service console.
In the Log Application section, on the Business Analysis tab, click Cost Manager.
Click Custom Analysis.
Syntax
Basic syntax
The new Cost Manager connects to your Logstore as an external table. To query your billing data, you must query this table.
The search statement, which is the part before the vertical bar (|), must be an asterisk (*).
The name of the external table in the analytic statement is always
instance_bill. You must add all query conditions to theWHEREclause.
* | select xxx from instance_bill where xxx group by xxx limit xxxFor example, to query the daily cost of Simple Log Service, use the following query:
* |
select
  date_trunc('day', __time__) as day,
  sum(PretaxAmount) as cost
FROM  instance_bill
where
  productcode = 'sls'
group by
  day
Example 1: Aggregate query
This example retrieves the total bill for Simple Log Service.
Query and analysis statement
* |
select
  sum(PretaxAmount) as cost
FROM  instance_bill
where
  productcode = 'sls'
Query and analysis result: The query returns a cost column with a value of
63.46990000000038.
Example 2: Grouped query
This example queries bill costs for different products.
Query and analysis statement
* |
select
  productcode,
  sum(PretaxAmount) as cost
FROM  instance_bill
group by
  productcode
Query and analysis result: The query returns the costs for four products: 2.4672 for
nat_gw, 10.1584 forpolardb, 1.1208 forhologram, and 3.3288 fordcdn.
Example 3: Comparative analysis
This example compares costs between the current and previous months.
Query and analysis statement
* |
SELECT
  diff [1] AS "Current Month Amount",
  diff [2] AS "Last Month Amount",
  diff [3] * 100 -100 as "increase%"
FROM (
    SELECT
      compare(amount, 2592000) as diff
    FROM (
        SELECT
          sum(PretaxAmount) AS amount
        FROM instance_bill
      )
  )
The query result is a single row of data: Current Month's Cost is 20.969, Previous Month's Cost is 107.275, and Month-over-Month Increase % is -80.453. This indicates that the cost for the current month decreased by about 80% compared to the previous month.
Example 4: Analyze billable items
This example queries the cost and usage for each billable item in Simple Log Service.
Query and analysis statement
* |
SELECT
  BillingItem,
  sum(PretaxAmount) AS "consume",
  sum(Usage) as "credit"
FROM  instance_bill
where
  productcode = 'sls'
GROUP by
  BillingItem
Query and analysis results: The query returns three billable item records: Index traffic–Time series index (cost: approximately 26.86, usage: approximately 487.80), Read/write traffic (cost: approximately 2.10, usage: approximately 42.24), and Partition lease (cost: approximately 0.47, usage: approximately 45.48).
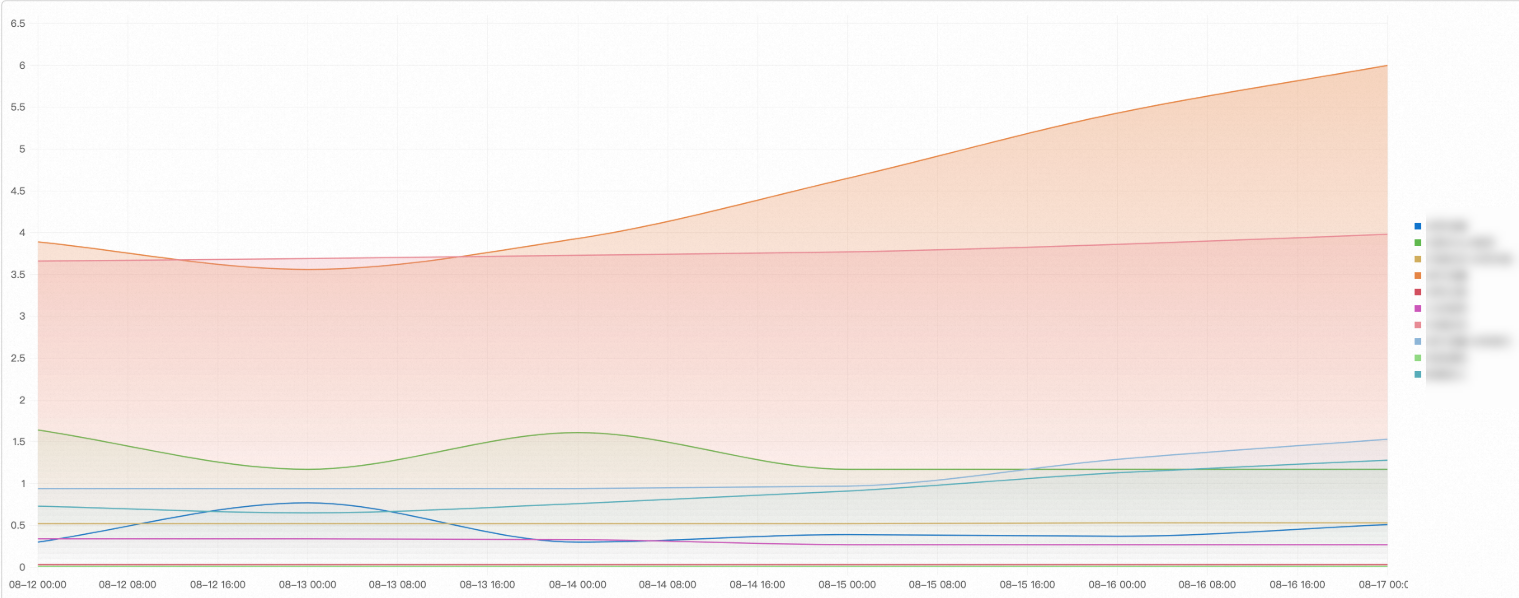
Example 5: Daily usage trend
This example analyzes the daily usage trend of billable items.
Query and analysis statement
* |
SELECT
	date_trunc('day', __time__) as t,
  BillingItem,
  sum(PretaxAmount) AS " consume",
  sum(Usage) as " credit"
FROM  instance_bill
where
  productcode = 'sls'
GROUP by
  BillingItem,
  t
ORDER by
  t
Query and analysis result
Example 6: Analyze instance information
This example queries the cost of each Simple Log Service instance.
Query and analysis statement
* |
SELECT
  InstanceID,
  sum(PretaxAmount) AS " consume"
FROM  instance_bill
where
  productcode = 'sls'
GROUP by
  InstanceID
The query and analysis results show the consumption amount for each SLS instance in a table, sorted in descending order by the Consumption column. In the example, three metrics-type instances are returned with consumption amounts of 3.47, 1.27, and 0.91, respectively.
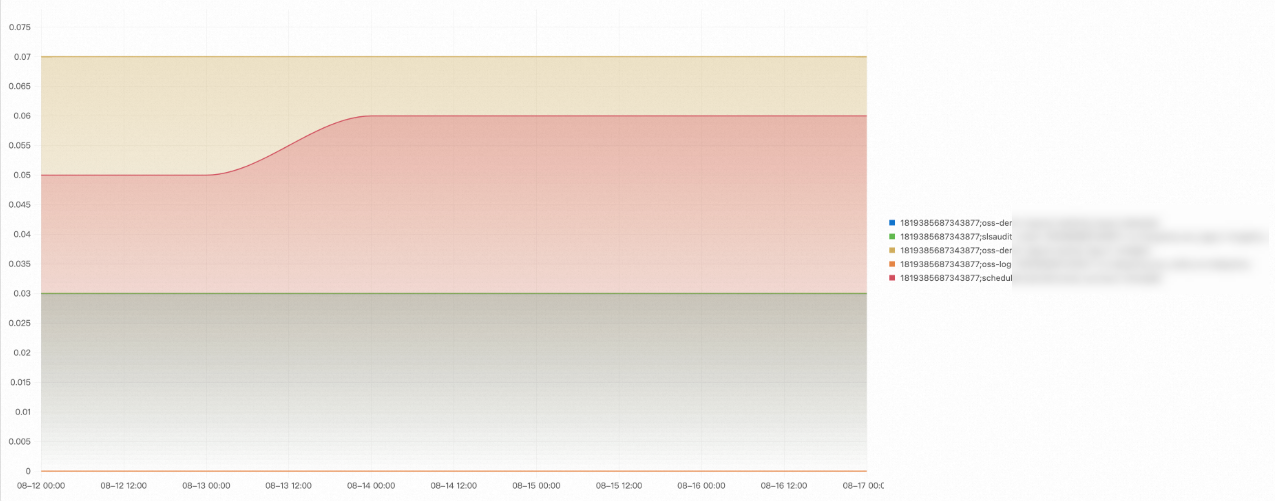
Example 7: Daily cost trend of instances
This example analyzes the daily cost trend of product instances.
Query and analysis statement
* |
SELECT
  date_trunc('day', __time__) as t,
  InstanceID,
  sum(PretaxAmount) AS " consume"
FROM  instance_bill
where
  productcode = 'sls'
GROUP by
  InstanceID,
  t
ORDER by
  t
Query and analysis result
Example 8: External table join
For example, join the billing data with a custom external table.
In this example, the external table is named instance_name_table, which is a custom mapping table for the InstanceID and InstanceName fields.
Query and analysis statement
* | with t1 as (
  select
    InstanceID,
    sum(PretaxAmount) as PretaxAmount
  FROM    instance_bill
),
t2 as (
  select
    InstanceID,
    InstanceName
  FROM    instance_name_table
)
select
  t1.InstanceID,
  t1.PretaxAmount,
  t2.InstanceName
FROM  t1
  left join t2 on t1.InstanceID = t2.InstanceID
Billing data
Field | Description | Example |
BillingDate | The billing date. | 2022-11-06 |
BillingItem | The billable item. | Number of PUT and other types of requests |
BillingType | The billing method. | Other |
CostUnit | The cost unit. | Unallocated |
Currency | The currency. | USD |
DeductedByCashCoupons | The amount deducted by cash coupons. | 0.0 |
DeductedByCoupons | The amount deducted by vouchers. | 0.0 |
DeductedByPrepaidCard | The amount deducted by prepaid cards. | 0.0 |
DeductedByResourcePackage | The amount deducted by a resource package. | 0 |
InstanceConfig | The instance configuration. | None |
InstanceID | The instance ID. | me-east-1%3Bstandard |
InstanceSpec | The instance specifications. | None |
InternetIP | The public IP address. | None |
IntranetIP | The internal IP address. | None |
InvoiceDiscount | The discount amount. | 0.001 |
Item | The bill type. Valid values:
| PayAsYouGoBill |
ListPrice | The unit price. | 1.020000 |
ListPriceUnit | The unit for the list price. | CNY per 10,000 requests |
NickName | The instance alias. | test |
OutstandingAmount | The unsettled amount. | 0.0 |
OwnerID | The account ID. | 12***3212 |
PaymentAmount | The cash payment. | 0.0 |
PretaxAmount | The payable amount. | 0.0 |
PretaxGrossAmount | The original price. | 0.005 |
ProductCode | The product code. | oss |
ProductDetail | The product detail. | Object Storage Service |
ProductName | The product name. | Object Storage Service |
ProductType | The product type. | None |
Region | The region. | China (Shanghai) |
ResourceGroup | The resource group. | None |
ServicePeriod | The service period. | 10800 |
SubscriptionType | The subscription type. Valid values:
| PayAsYouGo |
Tag | The tag. | None |
Usage | The usage. | 0.005000 |
UsageUnit | The usage unit. | 10,000 requests |
Zone | The zone. | cn-shanghai-b |
Next steps
After a query succeeds, you can visualize the results by creating charts and adding them to a dashboard. For more information, see Create a dashboard.