Convert log fields to metrics
Use the e_to_metric data transformation function to convert log fields from a Logstore into metrics in a MetricStore, and then track changes over time. This topic uses NGINX access logs as an example.
Background
Application runtime data falls into three categories: logs, traces, and metrics. Logs record discrete events, traces track requests across a system, and metrics capture numerical measurements over time. Log Service provides two storage types:
-
Logstore
A Logstore collects, stores, and queries logs in Log Service. Logstore.
-
MetricStore
A MetricStore collects, stores, and queries metrics in Log Service. MetricStores support PromQL queries and are compatible with the Prometheus protocol. MetricStore.
Log data is typically more comprehensive than metric data — a metric is essentially a structured log entry. Log Service supports two methods to convert logs into metrics:
-
Scheduled SQL: aggregate logs to generate metrics. Create a scheduled SQL job to import data from a Logstore to a MetricStore.
-
The e_to_metric data transformation function: convert log fields from a Logstore into time-series metrics.
Scenario
A Logstore named nginx-demo exists in the China (Hangzhou) region and stores NGINX access logs.
The goal is to monitor request_time (request duration) and upstream_response_time (upstream response time) trends per backend server. Convert request_time and upstream_response_time from the Logstore into metrics with a label based on the host field.
body_bytes_sent:1750
host:www.example.com
http_referer:www.guide.example.com
http_user_agent:Mozilla/5.0 (Macintosh; U; Intel Mac OS X 10_6_6; it-it) AppleWebKit/533.20.25 (KHTML, like Gecko) Version/5.0.4 Safari/533.20.27
http_x_forwarded_for:203.0.113.10
remote_addr:203.0.113.10
remote_user:p288
request_length:13741
request_method:GET
request_time:71
request_uri:/request/path-1/file-1
status:200
time_local:11/Aug/2021:06:52:27
upstream_response_time:0.66
Prerequisites
Log data is collected. Data collection.
Step 1: Create a MetricStore
Create a MetricStore named service-metric to store the transformed metrics.
Log on to the Simple Log Service console.
In the Projects section, click the one you want.

-
On the tab, click the + icon.
-
In the Create Metricstore panel, configure the following parameters and click OK.
Parameter
Description
Metricstore Name
The metricstore name. Must be unique within the project. Cannot be changed after creation.
Data Retention Period
How long metrics are retained in the metricstore.
-
Specified Days: Retains metrics for 1 to 3000 days.
Warning-
Expired metrics are automatically deleted.
-
If you shorten the retention period, SLS deletes expired metrics within 1 hour. The Usage Details on the SLS console homepage updates the next day. For example, changing the retention period from 5 to 1 day deletes the previous four days of metrics within 1 hour.
-
-
Permanent Storage: Retains metrics indefinitely.
NoteA retention period of 3650 returned by the SDK indicates permanent storage.
Shards
The number of shards. Each shard supports 5 MB/s and 500 writes/s for writing, and 10 MB/s and 100 reads/s for reading. Maximum: 10 shards per metricstore, 200 per project. For more information, see Shard.
Automatic Sharding
If you turn on Automatic Sharding, SLS increases shards when write capacity is insufficient. For more information, see Manage shards.
Maximum Shards
Required when Automatic Sharding is enabled. Maximum number of read/write shards. Maximum value: 256.
-
Step 2: Create a data transformation job
Use the e_to_metric function to create a data transformation job that outputs the results to the MetricStore you created in Step 1.
-
In the upper-right corner, select a time range so that the target logs appear on the Raw Logs tab.
-
Enter the following data transformation statement. This converts
request_timeandupstream_response_timeinto metrics, and renameshosttohostnameas a label.e_to_metric( names=[("request_time", "RequestTime"), ("upstream_response_time", "ResponseTime")], labels=[("host", "hostname")], ) -
Click Preview Data and check the Transformation Results tab.
The tab displays two metric data points:
__name__=RequestTimewith__value__=71.0, and__name__=ResponseTimewith__value__=0.66. Both have__labels__=hostname#$#www.example.comand__time_nano__=1716172083000000000. -
Create the data transformation job.
-
Click Save as Transformation Job.
-
In the Create Data Transformation Job panel, configure the following parameters and click OK. For parameter details, see Create a data transformation job.
Parameter
Description
Job name, Display name
The job name must be unique. The display name is user-defined, such as log2metric.
Authorization method
Select Default Role to grant read permissions on the source Logstore.
Destination
Destination name
The destination name, such as log2metric.
Destination region
The region of the destination Project, such as China (Hangzhou).
Destination Project
The destination Project that stores the transformation results.
Destination store
The destination MetricStore, such as service-metric.
Authorization method
Select Default Role to grant write permissions on the destination MetricStore service-metric.
Processing scope
Time range
Select All.
-
-
Check the data transformation job status.
In the left-side navigation pane, click the Logstore icon, expand the target Logstore, choose Data Processing > Data Transformation, and click the target job to view its progress.
Step 3: Query time-series data
-
In the left-side navigation pane, choose , and select the target MetricStore.
-
In the upper-right corner, click Last 15 Minutes (Relative) to set the query time range.
NoteQuery and analysis results may have up to one minute of latency.
-
Click Preview Raw Data. In the panel that appears, select a time range to verify that metrics have been written.
The preview shows two metrics from
service-metric:__name__:RequestTime __value__:71.0and__name__:ResponseTime __value__:0.66. -
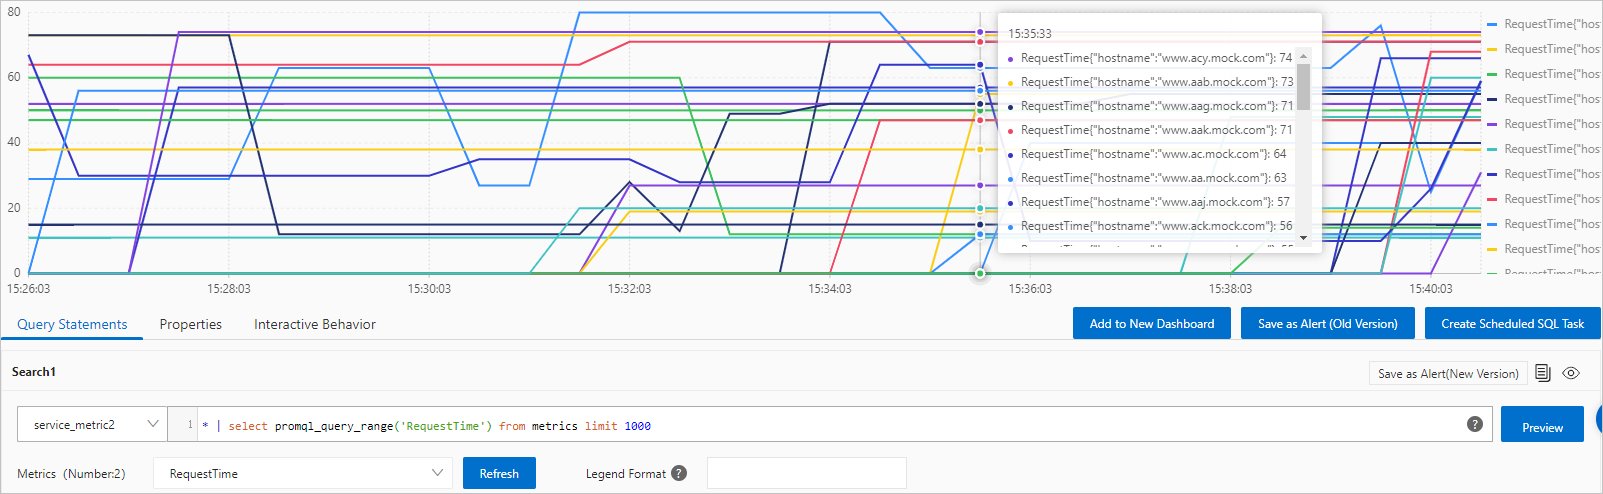
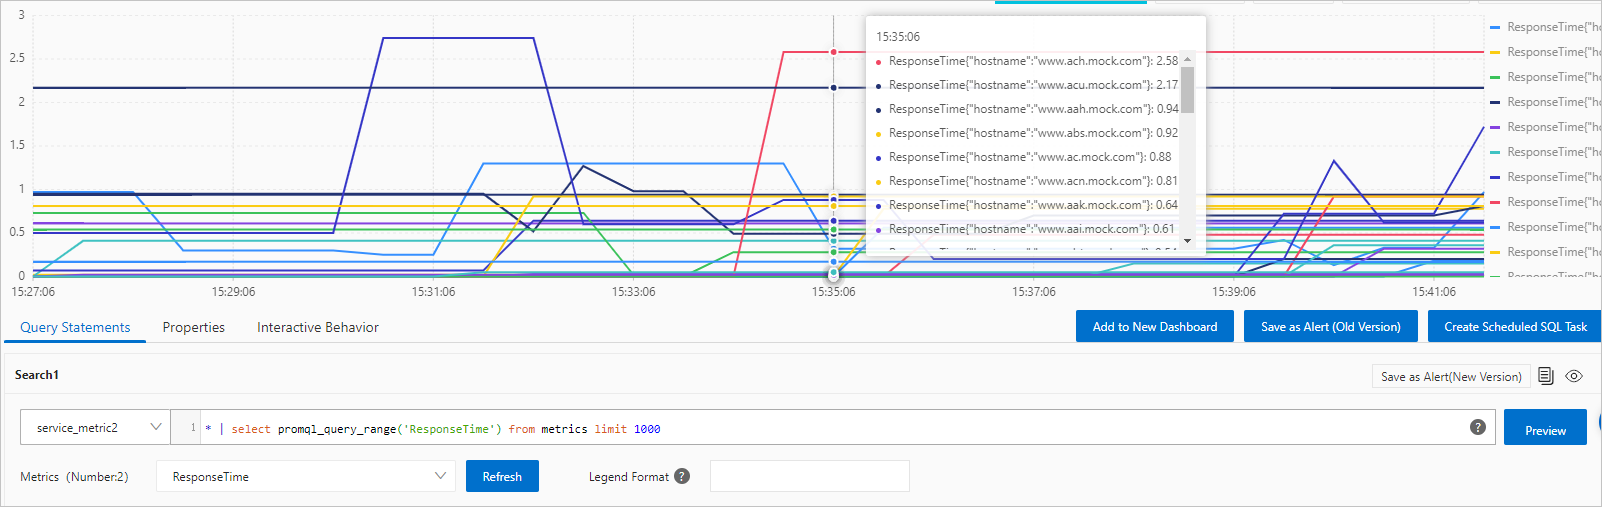
Enter a query statement using one of the following methods. For detailed steps, see Query and analyze time-series data.
-
Enter a PromQL statement and click Execute Now.
You can add multiple queries. Results are overlaid in the same time series chart.
-
In the Metrics Explore pane, click the
 icon next to a metric to auto-generate a query statement.
You can also click Continue to Explore for a metric in the Metrics Explore pane to set label values and auto-generate a query. Metric exploration.
-
The trend of RequestTime for each host
-
The trend of ResponseTime for each host
-