One of the key benefits of the cloud is the pay-as-you-go model, which eliminates the need to reserve resources. This makes accurate metering and billing a critical requirement for any cloud service. This document describes a solution built on Simple Log Service that processes hundreds of billions of metering logs daily for numerous cloud products.
Pay-as-you-go billing logs
Use cases
-
Electric power companies: An electric power company receives a log every 10 seconds that records the power consumption, peak usage, and average usage for each customer ID. The company aggregates these logs to generate hourly, daily, and monthly bills.
-
Telecom carriers: A telecommunications carrier collects logs from base stations every 10 seconds. Each log records a subscriber's actions (such as web browsing, calls, SMS, and VoIP), data usage, and duration. A backend billing service then calculates the charges for each interval.
-
API services: A weather forecast API service charges users based on the API type, city, query type, and response size of their requests.
Requirements and challenges
Building an accurate and reliable billing system is a demanding task. The system must meet the following requirements:
-
Accuracy and reliability: The system must not overcharge or undercharge customers.
-
Flexibility: The system must support scenarios like data backfill. For example, if some data fails to arrive on time, the system must be able to recalculate charges after the data arrives.
-
Real-time performance: The system must support second-level billing to quickly suspend services for accounts with overdue payments.
Additional requirements may include:
-
Bill correction: If real-time billing fails, the system must support reconciliation against the original metering data.
-
Detail queries: Users must be able to view their detailed consumption history.
Two major challenges complicate these requirements:
-
Growing data volumes: As user numbers and API calls increase, the data volume grows. The architecture must support auto scaling to handle this growth.
-
Fault tolerance: The billing program may have bugs. The metering data must be independent of the billing program, allowing the data to be reprocessed if needed.
This document describes a pay-as-you-go billing solution based on Simple Log Service. This solution has been in stable production for years without incorrect calculations or delays.
How it works
The following example uses the LogHub feature of Simple Log Service:
-
Use LogHub to ingest metering logs in real time and connect them to the metering program. LogHub supports over 50 data ingestion methods.
-
The metering program consumes incremental data from LogHub at fixed intervals and calculates billing results in memory.
-
(Optional) To support detail queries, create indexes for the metering logs.
-
Ship metering logs to Object Storage Service (OSS) for offline storage to perform T+1 reconciliation and analysis.
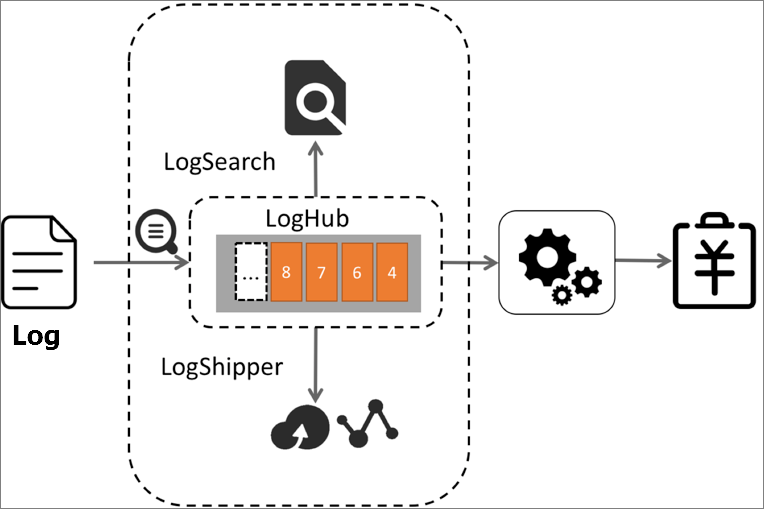
The real-time metering program works as follows:
-
Use the GetCursor operation in LogHub to get a cursor for logs within a specific time range, such as 10:00 to 11:00.
-
Use the PullLogs operation to consume the data within that time range.
-
Perform data aggregation and calculations in memory to generate billing data.
You can adjust the time window for calculations to 1 minute, 10 seconds, or another interval to meet your needs.
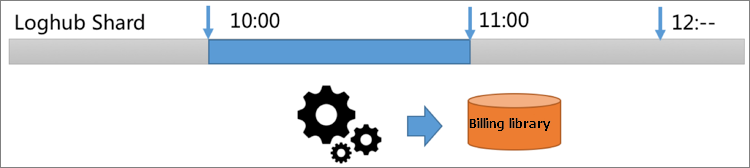
Performance analysis:
-
Assume there are 1 billion metering logs per day, with each log being 200 bytes. This amounts to 200 GB of data.
-
The default SDKs and agents for LogHub include compression. With a typical compression ratio of at least 5:1, the actual storage is 40 GB, and the data volume per hour is 1.6 GB.
-
A single LogHub read request can retrieve up to 1,000 packets, with each packet up to 5 MB. On a 1 Gbit/s network, the data can be read in under 2 seconds.
-
Including in-memory data aggregation and calculation time, summarizing one hour of metering logs takes no more than 5 seconds.
Billing from metering logs
Metering logs record the billable items you use. The backend billing module processes these items according to billing rules and generates the final bill. For example, the following raw access log records the usage of a project:
microtime:1457517269818107 Method:PostLogStoreLogs Status:200 Source:203.0.113.10 ClientIP:198.51.100.10 Latency:1968 InFlow:1409 NetFlow:474 OutFlow:0 UserId:44 AliUid:1264425845****** ProjectName:app-myapplication ProjectId:573 LogStore:perf UserAgent:ali-sls-logtail APIVersion:0.5.0 RequestId:56DFF2D58B3D939D691323C7
The metering and billing program reads the raw logs and generates usage data across various dimensions based on billing rules. The backend billing module aggregates the raw logs by project and generates a statistical metering table that includes fields such as uid, project, region, inflowsize, writecount, readcount, outflowsize, network_out, shard_size, and index_size, where region is a key billing dimension. The table records traffic and storage metrics for multiple projects, such as aquilapreproductionenviron, ali-tbosstest-log, and ali-icbu-janus-log, in regions such as China (Hangzhou), China (Shanghai), and China (Beijing).
How to handle large data volumes
In some billing scenarios, such as for telecom carriers or IoT services, the volume of metering logs can be massive (for example, ten trillion logs, or 2 PB of data per day). After compression, this amounts to 16 TB per hour. Reading this volume over a 10-gigabit network would take 1,600 seconds, which is insufficient for rapid billing.
-
Control the volume of generated billing data
Modify the program that generates metering logs (for example, Nginx) to pre-aggregate data in memory. It can then flush the aggregated summary logs for a given time period, such as every minute. This makes the data volume dependent on the total number of users. For example, if Nginx serves 1,000 users in that period, one hour of data would be 12 MB (1,000 * 200 * 60), or 2.4 MB after compression.
-
Parallelize the processing of metering logs
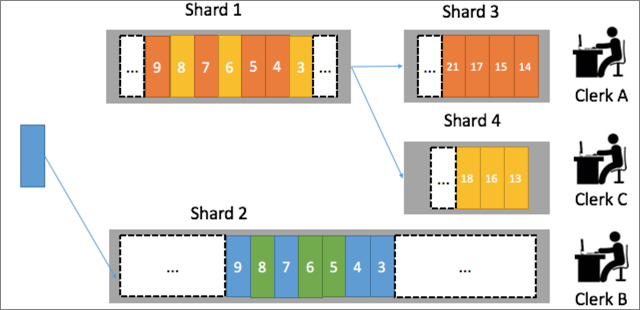
Each Logstore in LogHub can be assigned different shards. You can allocate three shards and three consumer programs for metering. To ensure that a user's metering data is always processed by the same program, you can hash the user ID to a fixed shard. For example, users in the Xihu district of Hangzhou can write to Shard 1, while users in the Shangcheng district write to Shard 2. This allows the backend metering programs to scale horizontally.
FAQ
-
How do I backfill data?
Each Logstore in LogHub can be configured with a retention period from 1 to 365 days. If the billing program needs to reprocess data, it can re-consume logs from any time range within the retention period.
-
What if metering logs are scattered across many servers?
-
Use the Logtail agent for real-time collection.
-
Use custom machine identifiers to define a dynamic machine group for auto scaling.
-
-
How do I query consumption details?
Create indexes on the data in LogHub for real-time search and statistical analysis.
Inflow>300000 and Method=Post* and Status in [200 300]You can also add a statistical analysis clause to your query:
Inflow>300000 and Method=Post* and Status in [200 300] | select max(Inflow) as s, ProjectName group by ProjectName order by s desc -
How do I store logs and perform T+1 reconciliation?
Simple Log Service provides a data shipping feature for LogHub that supports configurations like custom partitions and custom storage formats. Store logs in Object Storage Service (OSS), and then use services like E-MapReduce, Hadoop, Hive, Presto, or Spark for computation.