Zabbix is a popular open-source monitoring system that offers a wide range of alert rules. Simple Log Service (SLS) supports collecting monitoring data from Zabbix. This topic describes how to collect Zabbix data and send it to SLS.
Prerequisites
You have downloaded and installed Zabbix. For more information, see Download and Install Zabbix.
This topic uses an example where Zabbix is installed on an Alibaba Cloud ECS instance.
You have created a project and logstore. For more information, see Manage Projects and Create a basic logstore.
Step 1: Configure the data storage path
Zabbix saves monitoring data on its host machine. Follow these steps to set the storage path for this data.
Log on to the server where Zabbix is installed.
Open the zabbix_server.conf file.
vim /etc/zabbix/zabbix_server.confIn the zabbix_server.conf file, set the data storage path.
Use the Real-time Export feature of Zabbix to export monitoring data, such as events, history, and trends, in JSON format. This feature requires Zabbix 4.0 or later. For more information, see Real-time export.
Do not use
ExportDir=/tmp/. The/tmpdirectory is usually a temporary file storage system (tmpfs). It provides fast write speeds but consumes memory resources. If you export a large amount of data, such as from high-frequency metrics, the system may run out of memory or experience an out-of-memory (OOM) error.ExportDir=/data/zabbix_exportRestart the Zabbix service to apply the configuration.
systemctl restart zabbix-serverAfter the configuration is applied, Zabbix generates .ndjson files in the /data/zabbix_export directory to store monitoring data.
Step 2: Create a LoongCollector collection configuration
Log on to the Simple Log Service console.
In the Import Data section, select JSON - Text Log.
Select the project and logstore. Then, click Next.
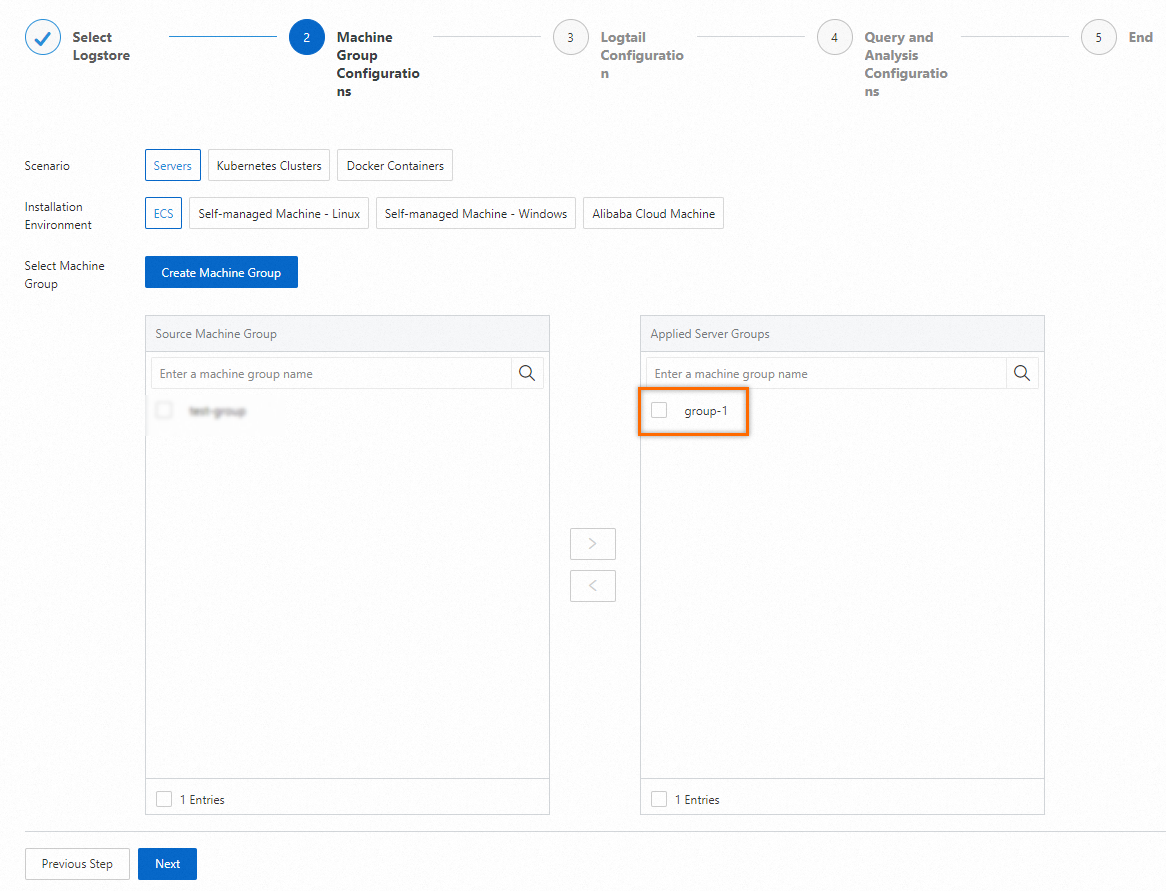
Create a machine group.
Set Scenario to Servers and Installation Environment to ECS. Then click Create Machine Group. In the Create Machine Group panel, select the ECS instances that are in the same region as the project, and then click Install and Create Machine Group.
If your ECS instances are in a different region from SLS, or if Zabbix is installed on a self-managed cluster or a server from another cloud provider, you must manually install LoongCollector. For more information, see Install LoongCollector on Linux.
Wait for the installation to complete, enter a name, and then click OK.
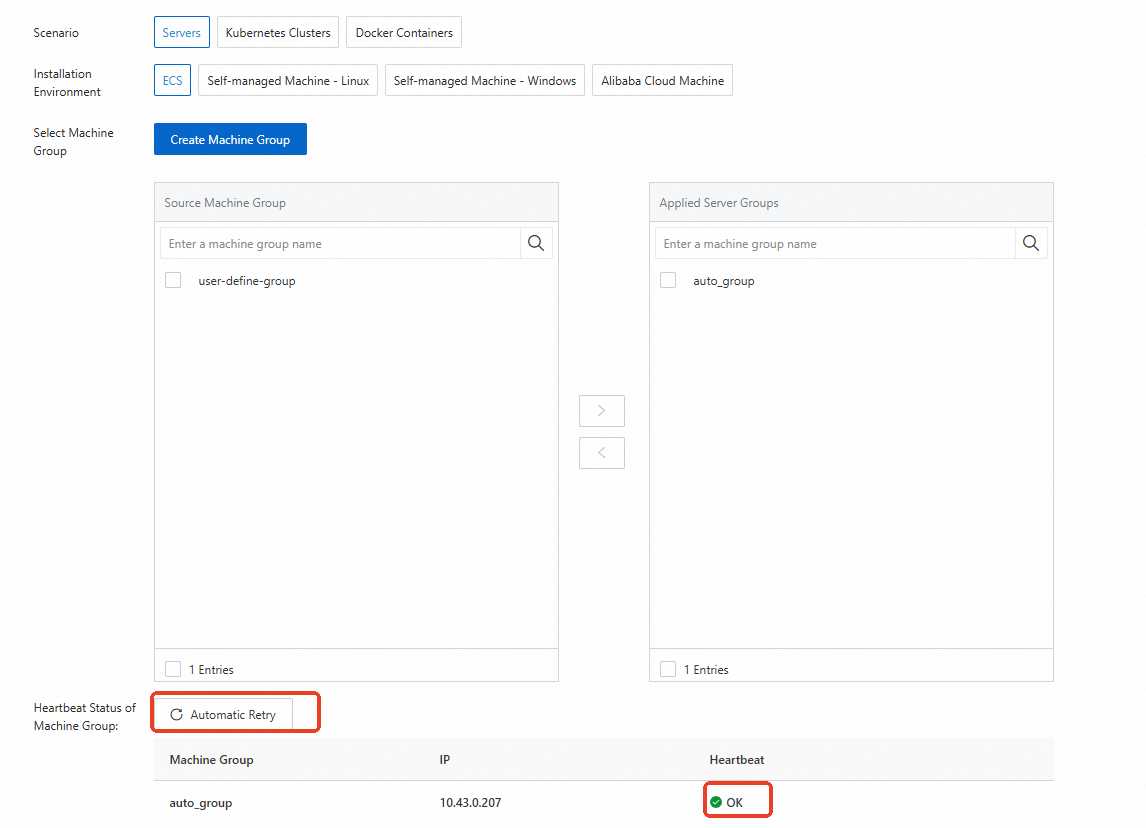
Click Next. If the heartbeat status is FAIL, click Automatic Retry and wait about two minutes until the status changes to OK. Then click Next. The automatic installation of LoongCollector also configures an IP-based machine group. If you want to use a machine group with custom identifiers, see Associate machine groups with LoongCollector collection configurations.
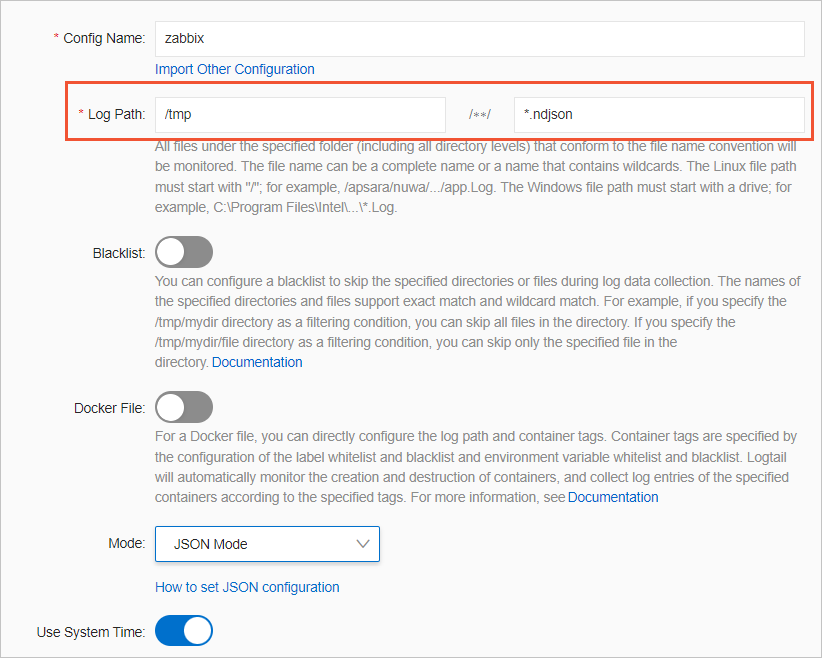
Create a collection configuration and click Next.
Zabbix monitoring data is in JSON format. Use the JSON mode to collect the data. Set Log Path to the data storage path that you configured in Step 1: Configure the data storage path. For more information about other parameters, see Collect logs in JSON mode.
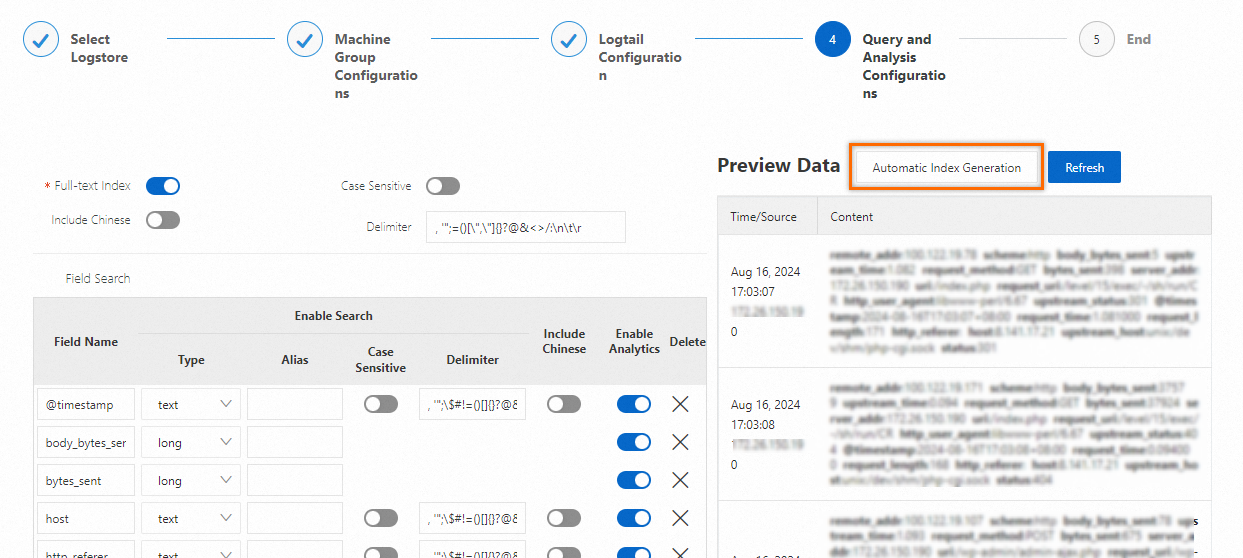
SLS enables full-text indexing by default. You can also manually create field indexes for the collected logs. Alternatively, click Automatic Index Generation to have SLS automatically generate field indexes. For more information, see Create indexes.
Query and analyze logs.
Click Query Log. The system redirects you to the query and analysis page of the logstore.
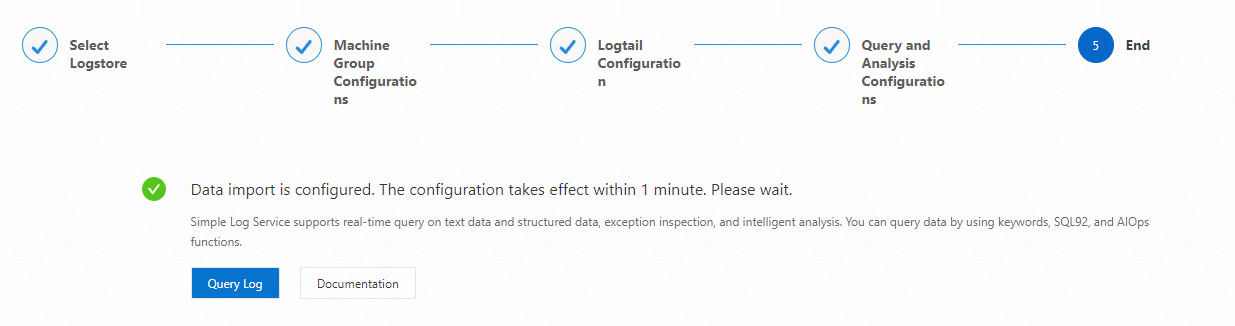
Wait about one minute for the indexes to take effect. Then view the collected logs on the Raw Logs tab. For more information about how to query and analyze logs, see Quick start for log query and analysis.
NoteTo query all fields in a log, use full-text indexing. To query only specific fields, use field indexes to reduce index traffic. To analyze fields using SELECT statements, you must create field indexes.