Logtail can collect host metric data, including CPU, memory, load, disk, and network metrics.
Prerequisites
A project and a Metricstore are created. For more information, see Manage projects and Create a metricstore.
Limits
-
Windows servers are not supported.
-
Metric data about GPUs and hardware status cannot be collected.
-
Only Linux Logtail V0.16.40 and later can collect host metric data. If you have installed an earlier version of Logtail on your server, you must update Logtail to a supported version. For more information, see Install Logtail on a Linux server.
Configure data collection
-
Sign in to the Simple Log Service console.
-
On the right side of the console, click the Quick Data Import card.
-
On the Import Data page, click Host Monitoring.
-
Select the target Project and MetricStore, and click Next. In the Select Log Space step, select an existing Project and MetricStore, or click Create Now on the right to create new ones, and then click Next.
-
On the Create Machine Group tab:
-
If you have an available machine group, click Use Existing Machine Groups. Select Host scenario and ECS. From the source machine group list, select the target machine group and click > to move it to the applied machine group list. Then, click Next.
-
If no machine groups are available, perform the following steps to create a machine group. In this example, an Elastic Compute Service (ECS) instance is used.
-
On the ECS Instance tab, in the Manually select instances section, select the target ECS instance and click Create.
For more information, see Install Logtail on ECS instances.
ImportantIf you want to collect logs from an ECS instance that belongs to a different Alibaba Cloud account than Simple Log Service, a server in a data center, or a server of a third-party cloud service provider, you must manually install Logtail. For more information, see Install Logtail on a Linux server. After you manually install Logtail, you must configure a user identifier for the server. For more information, see Configure a user identifier.
-
After the installation is complete, click Complete Installation.
-
On the Create Machine Group page, enter a Name and click Next.
In Simple Log Service, you can create IP address-based machine groups and custom identifier-based machine groups. For more information, see Create a machine group.
-
-
-
On the Configure Data Source tab, set the Configuration Name and Plug-in Configuration. Then, click Next.
ImportantThe
inputsparameter is required and specifies the data source. You can configure only one data source type ininputs.{ "inputs": [ { "detail": { "IntervalMs": 30000 }, "type": "metric_system_v2" } ] }Parameter
Type
Required
Description
type
string
Yes
The data source type. Set the value to metric_system_v2.
IntervalMs
int
Yes
The collection interval, in milliseconds. The value must be 5000 or greater. Recommended value: 30000.
-
Click Query logs to view the collected data in the MetricStore.
Data monitoring
-
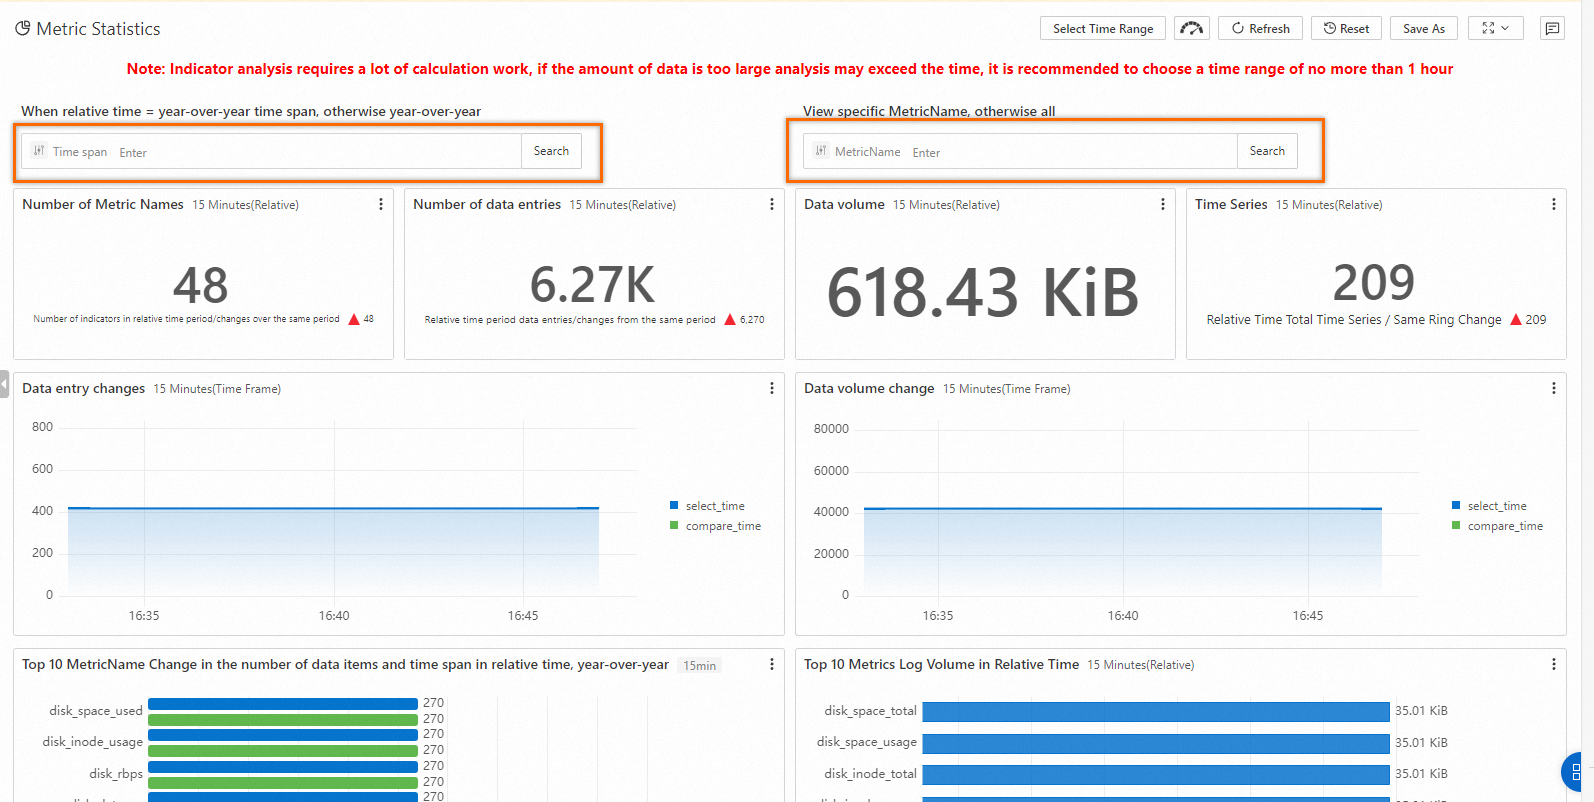
On the target time series database homepage, click Metric Statistics to open the Metric Statistics dashboard.
-
On the Metric Statistics dashboard, view all collected metrics. You can also filter the data by time range or labels.
-
On the time series database homepage, click Metrics Explorer (Metrics: 48) to explore, view, and filter all available metric names and their metadata. To view CPU and memory data, you can use queries such as
cpu_count{}andmem_cache{}. For more information about queries and analysis, see Query and analyze time series data.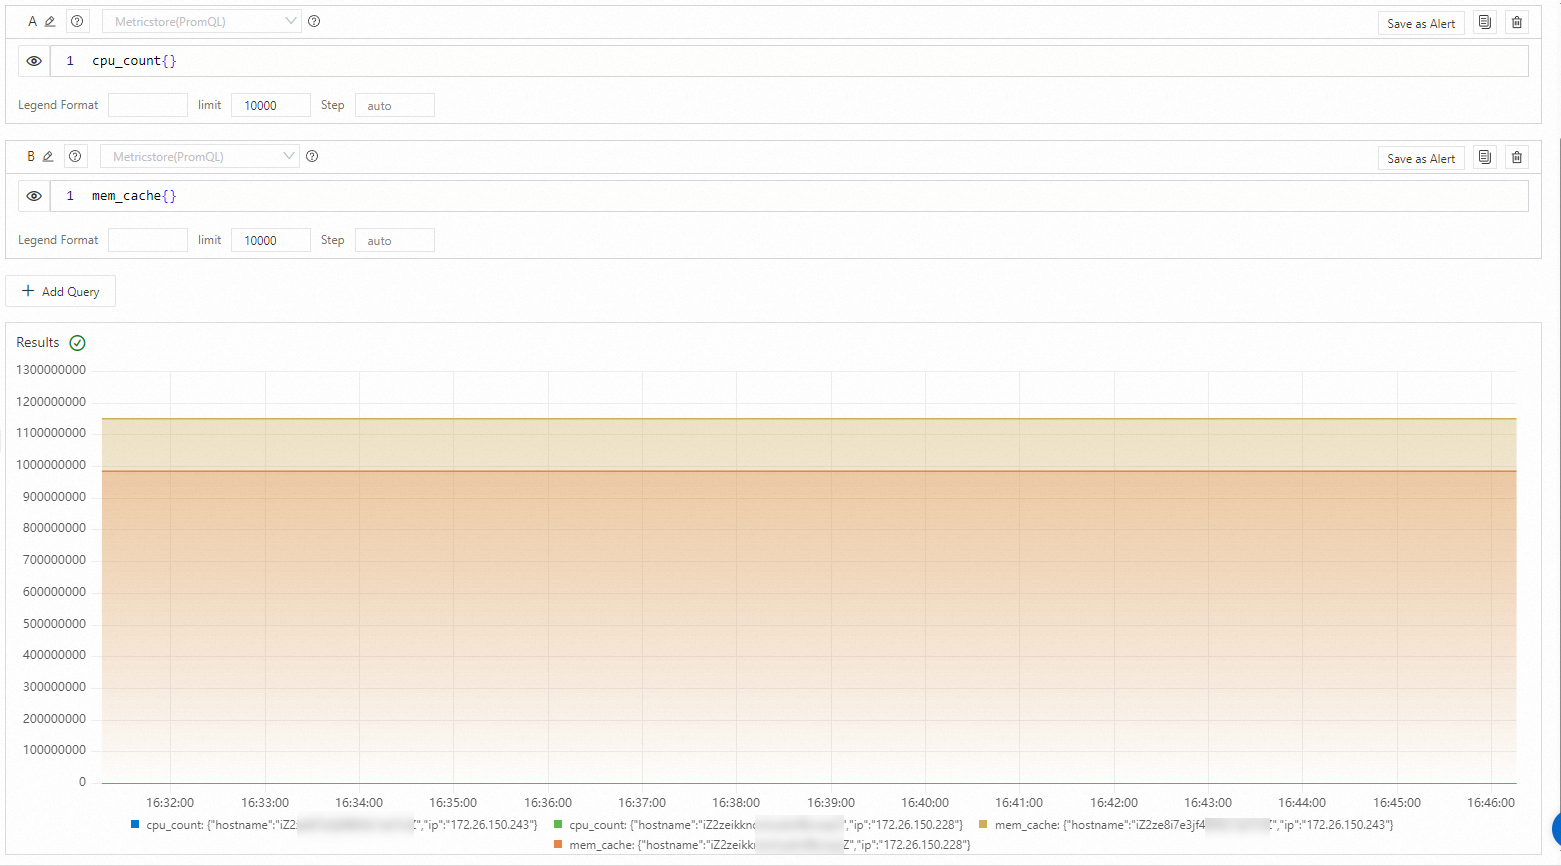
-
You can filter data from multiple instances by
hostnameorip. To ensure accurate results, clear any previous query data before applying a new filter. After selecting a metric such ascpu_count, the page displays its labels (for example, hostname and ip), the count of unique values, and sample values. In the Actions column for a label, click Filter, select an operator, and enter a filter value to create a condition such asip = 172.26.150.228. Then, click + Add to query box to add the condition to your query.
Metrics
The following tables list the available metrics for CPUs, memory, disks, and networks.
-
CPU-related metrics
Metric
Description
Unit
Example value
cpu_count
The number of CPU cores.
N/A
2.0
cpu_util
The CPU utilization, calculated as 1 minus the sum of the idle, iowait, and steal counters.
Percent (%)
7.68
cpu_guest_util
The Linux guest counter. Percentage of CPU time spent on normal-priority guest processes.
Percent (%)
0.0
cpu_guestnice_util
The Linux guest_nice counter. Percentage of CPU time spent on niced-priority guest processes.
Percent (%)
0.0
cpu_irq_util
The Linux irq counter. Percentage of CPU time spent servicing hardware interrupts.
Percent (%)
0.0
cpu_nice_util
The Linux nice counter. Percentage of CPU time spent on niced-priority user-mode processes.
Percent (%)
0.0
cpu_softirq_util
The Linux softirq counter. Percentage of CPU time spent servicing software interrupts.
Percent (%)
0.06
cpu_steal_util
The Linux steal counter. Percentage of CPU time spent running other operating systems in a virtualized environment.
Percent (%)
0.0
cpu_sys_util
The Linux system counter. Percentage of CPU time spent on kernel-mode processes.
Percent (%)
2.77
cpu_user_util
The Linux user counter. Percentage of CPU time spent on normal-priority user-mode processes.
Percent (%)
4.84
cpu_wait_util
The Linux iowait counter. Percentage of CPU time spent idle while outstanding disk I/O requests exist.
Percent (%)
0.11
-
Memory-related metrics
Metric
Description
Unit
Example value
mem_util
The memory usage.
Percent (%)
51.03
mem_cache
The amount of memory allocated but unused.
Byte
3566386668.0
mem_free
The amount of unused memory.
Byte
177350084.0
mem_available
The amount of available memory.
Byte
3699885553.0
mem_used
The amount of used memory.
Byte
4041510463.0
mem_swap_util
The swap usage.
Percent (%)
0.0
mem_total
The total memory size.
Byte
7919128576.0
-
Disk-related metrics
Metric
Description
Unit
Example value
disk_rbps
The disk read throughput per second.
Byte/s
8376.81
disk_wbps
The disk write throughput per second.
Byte/s
247633.58
disk_riops
The number of read operations per second.
Read/s
0.22
disk_wiops
The number of write operations per second.
Write/s
43.39
disk_rlatency
The average read latency.
ms
2.83
disk_wlatency
The average write latency.
ms
2.15
disk_util
The disk I/O utilization.
Percent (%)
0.27
disk_space_usage
The percentage of used disk space.
Percent (%)
9.12
disk_inode_usage
The percentage of used inode space.
Percent (%)
1.18
disk_space_used
The amount of used disk space.
Byte
11068512238.59
disk_space_total
The total disk space.
Byte
126692061184.0
disk_inode_total
The total number of inodes.
N/A
7864320.0
disk_inode_used
The number of used inodes.
N/A
93054.78
-
Network-related metrics
Metric
Description
Unit
Example value
net_drop_util
The percentage of dropped packets out of all packets.
Percent (%)
0.0
net_err_util
The percentage of error packets out of all packets.
Percent (%)
0.0
net_in
The inbound data rate.
Byte/s
8440.91
net_in_pkt
The inbound packet rate.
Packet/s
40.83
net_out
The outbound data rate.
Byte/s
12446.53
net_out_pkt
The outbound packet rate.
Packet/s
39.95
-
TCP-related metrics
Metric
Description
Unit
Example value
protocol_tcp_established
The number of established connections.
N/A
205.0
protocol_tcp_insegs
The number of received packets.
N/A
4654.0
protocol_tcp_outsegs
The number of sent packets.
N/A
4870.0
protocol_tcp_retran_segs
The number of retransmitted packets.
N/A
0.0
protocol_tcp_retran_util
The retransmission rate as a percentage of sent packets.
Percent (%)
0.0
-
System-related metrics
Metric
Description
Unit
Example value
system_boot_time
The system startup time.
s
1578461935.0
system_load1
The 1-minute average system load.
N/A
0.58
system_load5
The 5-minute average system load.
N/A
0.68
system_load15
The 15-minute average system load.
N/A
0.60
What to do next
For more information about Simple Log Service visualization, see Visualization on Simple Log Service and Visualization on Grafana.